While researching for this week’s looking outwards, I came across my friend’s Monica Chang’s week 8 Looking Outwards and became very interested. Her post was about Mike Tucker, an interactive designer and director at a company called MagicLeap, who centers around the future of spatial computing. They have collaborated with Radiohead’s Johnny Greenwood and Enclyopedia Pictura for the creation of Kanye West’s video game.
Spatial Design of Tónandi
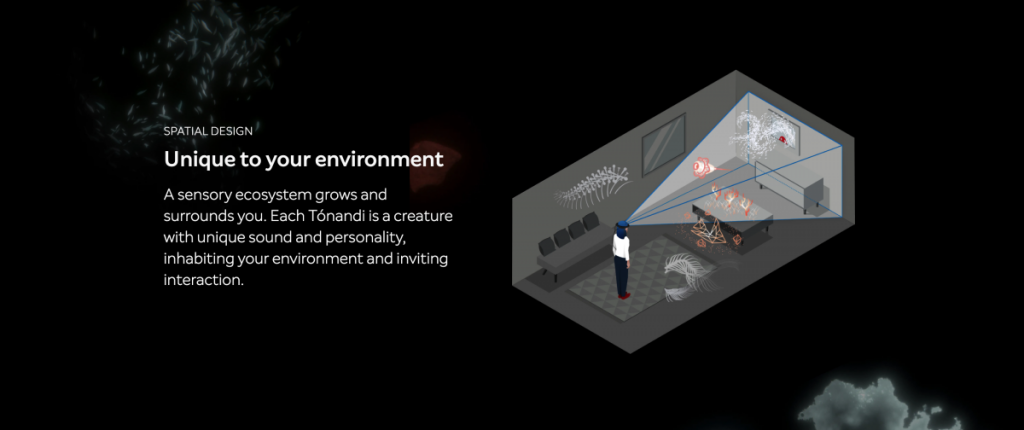
In Monica’s Looking Outwards post, she mentions a virtual app called Tónandi created in collabration with Tucker’s company, Magic Leap and Sigur Rós. Tónandi translates to sound spirit in Icelandic, an interactive audio-visual exploration of the sounds and spirit of Sigur Rós. They claim that Tónandi is a creature with unique sound and personality, inhabiting our environment and inviting interaction. I was very intrigued by this project because of its ability to interact with the environment naturally and how hands and body are all that is needed to execute this project and to connect with the sound creatures around you.
Tónandi, Sigur Rós in collaboration with Magic Leap Studios
I was inspired by Crystal Xue’s Looking Outwards 04. Carsten Nicolai is an artist and musician based in Berlin Germany, and he is known for presenting scientific quality of sound uniquely and artistically. He visualizes sound in minimalist installations. I am particularly inspired by the exhibition Reflektor Distortion at Galerie EIGEN + ART Berlin. The project utilizes disturbances, coincidences and self-organizing structures. Using the contrasting colors black and white, Nicolai visualizes the distortion nuance of frequency. The three main elements used are mirror, image and reflection. Eventually, the surface of a mirror becomes the medium that unveils reality as a distorted reflection.
/* Cathy Dong
Section D
yinhuid@andrew.cmu.edu
Project 09 - Portrait
*/
// load image as color base
var baseImg;
// preload base image
functionpreload(){var img ="https://i.imgur.com/zdFmG5k.jpg";
baseImg =loadImage(img);}functionsetup(){createCanvas(480,480);background(0);
baseImg.loadPixels(); //load image pixels
frameRate(100000); //set draw circle speed with framerate
}functiondraw(){ // set random x and y to make points
var px =random(width);var py =random(height); // constrain to keep x and y within canvas
var ix =constrain(floor(px),0, width-1);var iy =constrain(floor(py),0, height-1); // fill with base image color
var colorXY = baseImg.get(ix, iy); // change circle size based on distance to center
var distance =dist(px, py, width /2, height /2);var cirSize =map(distance,0,sqrt(2)* width /2,10,25); // draw circles
noStroke();fill(colorXY);circle(px, py, cirSize);}
In this project, I used dots/ circles to draw the abstracted self-portrait. Since my face is centered in the image, I used smaller circles near center and larger ones on the canvas edges. The idea is to have finer resolution on the face, whereas the background is blurred.
Drawing in process (start)Drawing in process (general figure)Drawing in process (better resolution)
After looking through the reflections of several other students, I found a post from Julia Nishizaki that she wrote for the Week 6 Looking Outwards on randomness. It was the series of images that she included that really attracted me to wanting to learn more about this project.
The project is called Windwalks, created by British artist Tim Knowles. A lot of his work is focused on movement and creating images through the movement of forms and objects that he can not control. This project utilizes the movement of the wind to create line drawings. Participants in the project are made to wear helmets with large arrows affixed to them. As the participant moves, the arrow is pushed by the wind, and the direction of the arrow determines where they will move next. Knowles collects data from the helmet about the path that the wearer took and uses that to create drawings.
Map of Movement
Map of Movement
I appreciate that Julia mentions that the project is not directly related to computation, but it definitely has to do with random image generation. The path that the wind creates cannot be expected. But it is not just the wind that is random. The wind then informs random movement of the wearers and then informs a randomly generated line drawing. I find the different layers of this project to be super intriguing. The other element that I really enjoy about the project is that we often dont think about the winds affect in our daily movement (except when its super strong…then people notice). But generally, the movement of the wind doesnt usually determine our pathways through an environment, so it is interesting to see the wind being the controlling force in this instance. I also really appreciate the line drawings. You can see the map like qualities in them, but they are also simple line forms that draw attention.
One point of Julia’s that I thought was very interesting was pointing out the ways that the line drawings suggest the environment that the walks take place in. The buildings and other structures inform the movement of the wind and therefore also determine the map that is translated for the drawings.
Overall I found this project super intriguing and Im glad I was able to find something really interesting by looking through someone else’s reflections. Im really interested in learning more about this artist and his other work.
/*
Mari Kubota
Section D
mkubota@andrew.cmu.edu
Assignment-09
*/var lines =[]; // Empty array to store ellipses
// Load image
functionpreload(){
underlyingImage =loadImage("https://i.imgur.com/23aauRel.jpg");}functionsetup(){createCanvas(550,420);
underlyingImage.loadPixels();}
// Determines the properties
functionmakelines(){var ix =constrain(floor(this.x),0, width-1);var iy =constrain(floor(this.y),0, height-1);var theColorAtLocationXY = underlyingImage.get(this.x,this.y); //gets the color value of the image at (x,y)
var linethickness=5;//thickness of lines
fill(theColorAtLocationXY) // Fills the ellipse with the color of the image at (x,y)
noStroke();ellipse(this.x,this.y, linethickness); // Draws the ellipse at (x,y) with the width and the height dimension of 'ballsize' which is a random number between 2 and 8
}
// Makes the lines move
functionlinespeed(){this.x +=this.dx; // MouseY will be later assigned as 'y'
}
// function to create properties of ellipse to be called on later
functiondrawPortrait(originalx, originaly, originaldx){
p ={x: originalx,
y: originaly,
dx: originaldx,
speed: linespeed,
lines: makelines,}return p;}
//draws the lines
functiondraw(){
newLines =[]; // Creates an empty array for new lines
for(var i =0; i < lines.length; i++){var p = lines[i];
p.speed(); //returns the function speed from drawPortrait
p.lines(); //returns the function balls from drawPortrait
newLines.push(p);}
lines = newLines;}
// When the mouse is moved it replaces the originalx, originaly, and originaldx values with mouseX, mouseY and random(-20,20) and make the drawPortrait function actually happen and to be stored in the newball array
functionmouseMoved(){var newLines =drawPortrait(mouseX, mouseY,random(-20,20));
lines.push(newLines);this.x +=random(this.x-3,this.x+3);}
For this project I used a picture of me from over the summer when I was learning how to drive. The image appears when you mouse over the picture and the picture appears with horizontal strips which were made using ellipse().
A series of walks directed by the wind using an array of mechanisms, filmed and plotted by GPS. 50 wind walks simultaneously depart Taylor Square, Sydney and walk guided solely by the wind for 1 hr, dispersing through the city their routes [recorded live via a tailor-made smartphone app] create a live drawing.
Browsing through the Looking Outwards assignments, I chose Julia Nishizaki’s Looking Outwards-06 about Tim Knowles’ Windwalks project. This London based artist focuses on using different mechanisms to form wind patterns directed by a series of walks. Filmed and plotted with a GPS, the line drawing below was the outcome of the design. This immediately stood out to me given my interest in art portraying natural forms of our world. I completely concur with my peer’s assessment of Knowles’ art as she explains the incorporation of the randomness of wind patterns and how this creates a more meaningful experience for the audience.
However, I feel this creates more than just “deeper relationships between individuals, their cities, and the wind itself.” I believe Knowles was trying to recreate and appreciate impalpable aspects of nature such as the wind by involving people in his project. He creates a series of walks starting in Taylor Square, Sydney and allowing people to disperse and walk through city routes for a full hour. By creating this interactive but calculated schema, he was able to bring people not only closer to their environment and nature but also gave them more an appreciation of art in general. Most of the time, people are unaware of the empirical research involved in creating art forms to a wider audience. Knowles was able to use his greatest passion to depict aspects of life that often gets forgotten and underappreciated in the nature of a physically focused group of people.
7 channel video projection, mixed media object and route plot as wall drawing, 2009
//RAYMOND PAI
//Section D
//rpai@andrew.cmu.edu
//Project 09 Comp Portrait
//pre load image
var underlyingImage;functionpreload(){var myImageURL ="https://i.imgur.com/SNQERwr.jpg";
underlyingImage =loadImage(myImageURL);}functionsetup(){createCanvas(500,500);
background (0); //pre load image's pixels
underlyingImage.loadPixels(); // slightly fast frame rate
frameRate(300);}functiondraw(){ //random pixel
//x of pixel
var px =random(width); //y of pixel
var py =random(height);var fx =constrain(floor(px),0, width-1);var fy =constrain(floor(py),0, height-1); //load pixel color to 'give' to the color of the circles
var theColorAtLocationXY = underlyingImage.get(fx, fy); //draws circles
fill(theColorAtLocationXY);noStroke();ellipse(px, py,20,20); //draws circles at mouse
var theColorAtTheMouse = underlyingImage.get(mouseX, mouseY); //color for circles
fill(theColorAtTheMouse); //draw circles at mouse
ellipse(mouseX, mouseY,20,20);}
I used chunky circles to make my portrait. To emphasize the playful style, the original picture is already edited to be really colorful:
color color color more color
The picture loads pretty quickly because I don’t want to wait to see the original. You can also speed up the process even more by rapidly moving the mouse around the portrait. The whole image should appear in about a minute.
I don’t have any paper sketches, but I have some screenshots of the earlier versions. I wanted to make it “print” from left to right and go down to a new row once it reaches the end (width). When it reaches the end of the canvas (width, height), it moves back to 0,0 and starts printing the image again.
Early version 1: step was something like 15px and size was 5px
Early version 2: step and size are the same small value
I wanted to add some interactivity using mousePressed. Every time the mouse is clicked:
A number between 1 and 20 is added to the step and size arrays.
i increases by 1, so that it accesses the newly generated elements in the arrays.
For this weeks post, I will be looking at Jina Lee’s Week 07 Looking Outwards post on data visualization. The emote project for the London 2012 Olympics assessed the global audiences’s real time emotional response to the different events throughout out the games and visualized it physically through a generative physical sculpture. I agree with Jina’s point about how innovative and well executed this project was as it was able to synthesize everyone’s opinions within a small amount of space. This allows people to unify and gain new perspectives on a general response to this global event. One thing that Jina did not touch upon was how this information can help improve future games as the Olympic Committee can use this data to improve parts of the event that weren’t well received by the general public. I think that’s a very effective way to utilize this data beyond an observation tool for visitors of the exhibition
As a designer I also admire the simplicity of the control’s design. The singular nob/button really invites the user to interact with it as there isn’t much complication beyond that one button. This is important as the intent behind this project is to make this information to be as accessible and inclusive to all people as possible.
//Kristine Kim
//Section D
//younsook@andrew.cmu.edu
//Project 09: computational portrait
var newimage;functionpreload(){
//loads image from imugr.com
var OGimage ="https://i.imgur.com/nYi2hyU.jpg[/img]"
newimage =loadImage(OGimage);}functionsetup(){createCanvas(480,320);background(181,209,255);
newimage.loadPixels();frameRate(20);}functiondraw(){var px =random(width);var py =random(height);var ix =constrain(floor(px),0, width -1);var iy =constrain(floor(py),0, height -1);
//retrieve colors at a certain location from the image
var pixelcolorT = newimage.get(ix,iy);
//retrieve colors at mouseX and mouseY location from the image
var pixelcolorE = newimage.get(mouseX, mouseY)
//draws ellipses controlled by mouseX and mouseY
//draws random diameters
noStroke();fill(pixelcolorE);ellipse(pmouseX, mouseY,random(5,15),random(5,15));
//draws text "Miss" and "you" with colors retrieved from OGimage
//and random placements
fill(pixelcolorT);text("Miss", px,py);fill(pixelcolorT);text("you", py, px);}
For my project, I used an image of a picture I took of one of my students that I served in Mexico this summer. I played around with different background colors. To add diversity into my project, I added 3 different elements into my piece, two texts and ellipses that drew with random diameters between 5 to 15. A problem I ran into was that my OGimage was bigger than my canvas size so my code was drawing only white ellipses. I went into photoshop and rescaled my image to 480 x 320 pixels and that solved the problem.
30 seconds1 minuteImage when almost fully rendered ( 4 minutes)Original picture of my student, Jorge.