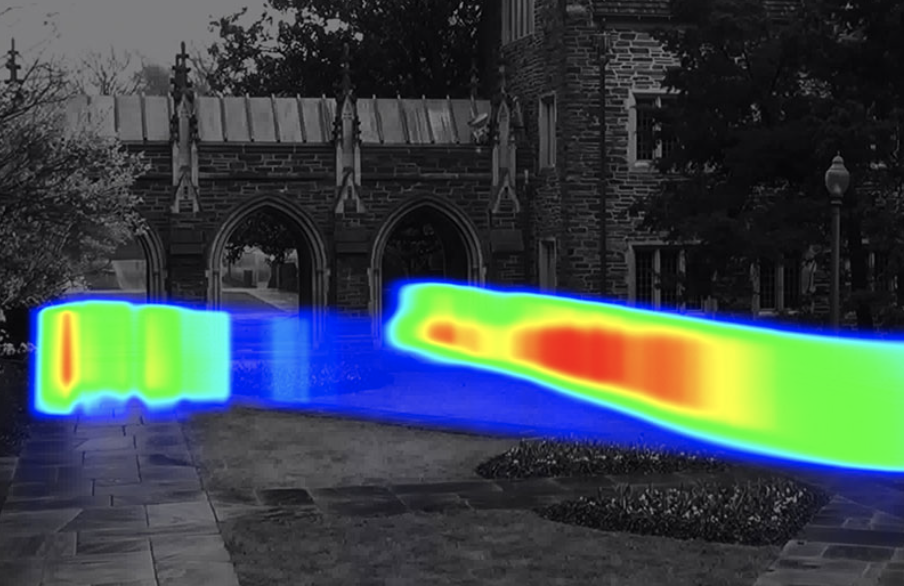
Adam Harvey is an artist based in Berlin. He graduated from the ITP program at NYU and before that, he majored in engineering and photojournalism at Penn State. His work focuses on computer vision, digital imaging technologies and he often gives talks about data and computer vision. Many of his works center around the idea that the collection of images of people has become normalized, however it is still largely unregulated and problematic because they may not know what their images are being used for or even if images of them are being captured. I find his works interesting because they explore implications of invasions of privacy and with his work, how visualizations and reports can allow people to understand how images are being used to power the facial recognition industry. One project in particular, Researchers Gone Wild, showcases discoveries made during his other research project, MegaPixels, but it makes the information more visual. Additionally, when looking at how he presents his research projects, I noticed that there was not a lot of text on the screen and was more visual which is something that I could incorporate into my presentations because it is more engaging for viewers.
Mike Tucker is an interactive director, designer, and developer who has been working at Magic Leap for the past 5 years. I was inspired by his spatial computing projects and even more so after his lecture at EYEO. I am personally very interested in the fields of AR and VR and how they can change the human experience. While he started his career with graphic design, he seems to be more interested in combining music with interactive digital environments. The project he presented at EYEO 2019: Tonandi, was especially interesting to me because of all the different senses incorporated into it. Including sight, sound, and motion, it is amazing how immersive digital environments can be designed nowadays. The lecture itself was effective in showing the actual experience of using the headset Magic Leap designed. Tucker presented videos showing live demos of the VR projects and how the user can interact with the virtual environment. The videos are also shot from a first-person perspective so the viewer can see the project as if they are using the VR headset themselves.
For this Looking outwards I selected Hyphen-Labs 2018 lecture.
They are small company that started in 2014. The company is ran internationally by a team of women of color. They like to transition in-between realities and push the envelope with design, science, and conceptual art to address problems and make aesthetically pleasing things.
One of their projects that I enjoyed was their products that they created to help protect protestors. The first product was an earring that would film police brutality and automatically upload to a cloud or a cop watch. The second product was a scarf that would cause technology to detect faces on the scarf and the thought behind this is to possibly overload a system that may be trying to detect protestors faces in the future.
Hyphen-Labs Prismatic Light Project
During their lecture, I really liked how they presented their light project because they had a close up video of the gear turning. I am not sure if it was CAD or a real video but it gave a lot of visual explanation of how the piece worked with just that one video. Also their overall cinematography of all their pieces was beautiful and made it all look so cool and professional and I think that can really make a design even better then it is.
Meow Wolf is an art collective that specializes in, and is best known for, creating large-scale immersive art installations, although they also produce streaming content, music videos, and arts and music festivals. They formed in February of 2008 in Santa Fe, New Mexico, and presented their first large-scale installation, House of Eternal Return, in the same year. They have since expanded to several permanent installation exhibits across the nation, including Omega Mart in Las Vegas and Convergence Station in Denver. I was initially drawn towards watching Meow Wolf’s lecture simply because I had heard of them from a friend, but their work is so much more interesting now that I know more about it. It’s incredibly admirable how much attention to detail there is and there has to be. To have such an interactive exhibit that people can go as far as to climb on it, the entire installation has to be incredibly well built and well thought out. This became even more clear through Meow Wolf’s presentation. They had a very casual presentation, but they were also able to show how passionate they were about the art installations. I can tell that they care a lot about what they do, but they know that their work also speaks for itself.
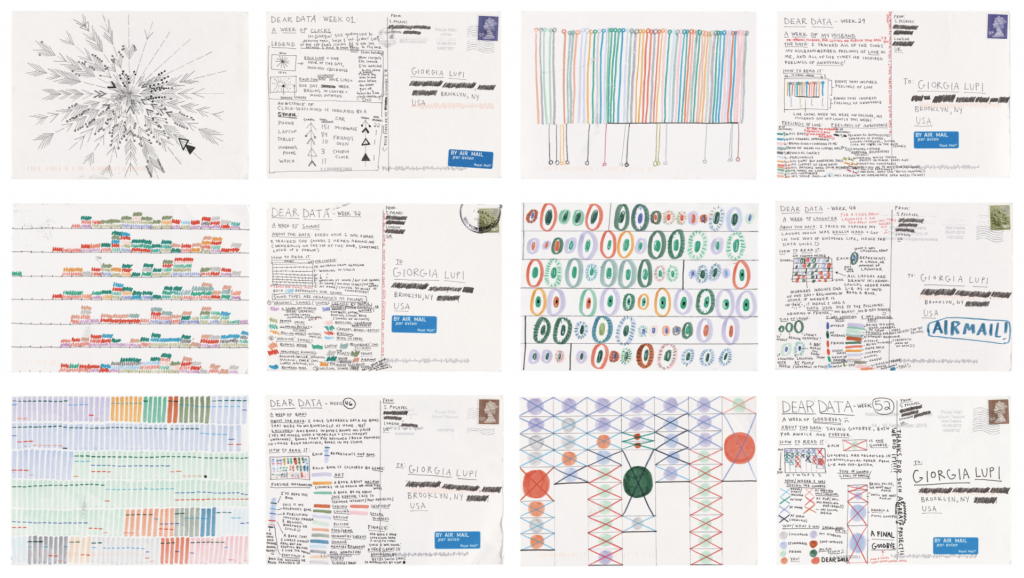
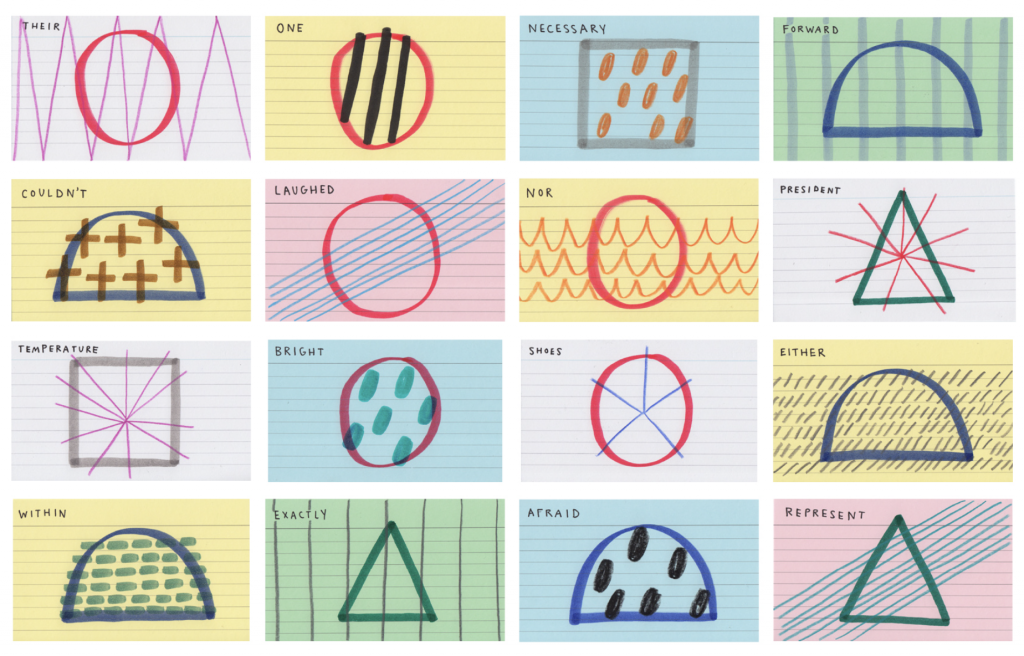
Stefanie Posavec is a designer, artist, and author who creatively communicates data to all audiences. Her work is fun, modern, and has a heavy graphic design influence which shows through her colorful and geometric style. Her designs are not also visual but wearable (“Air Transformed”) or even interactive through dance (“Relationship Dance Steps”). She also enjoys book design when the opportunity presents itself. Her work has been exhibited at places such as the MoMA, the Storefront for Art and Architecture (New York), the Centre Pompidou (Paris), ArtScience Museum (Singapore), and more. One work I particularly enjoy is “Data Murmurations: Points in Flight (People Like You),” which illustrates how the various stakeholders in a biobank perceive the people who consent to their biological samples and data being used for research, specifically at Imperial College. The work itself looks almost childlike with the sketchy line quality, and it’s even more enjoyable when you scroll down and see the sketches of all the ways she imagined the data visualization. Describing her creativity as childlike may sound insulting, but i enjoy the uninhibited and beautiful visual of serious data. Her “Dear Data” and “Drawing the Dictionary” projects looks quite similar, and are actually all physical work, adding to the feeling of a lovely drawing handed to you by your child. Not all her work is in this style, but I find it very charming.
http://www.stefanieposavec.com/mywork
“Data Murmurations: Points in Flight (People Like You)”“Dear Data”Close-up of “Drawing the Dictionary”
Sasha Costanza-Chock’s work focuses on amplifying social movements and transformative justice through design. They are currently based in Boston. After studying at Harvard University, the University of Pennsylvania, and University of Southern California, they taught Civic Media at the Massachusetts Institute of Technology, and continued on to the Berkman-Klein Center for Internet & Society at Harvard University. They describe themselves as “a researcher and designer who works to support community-led processes that build shared power, dismantle the matrix of domination, and advance ecological survival.” I admire their interrogation of white supremacy and colonialism specifically in the context of visualization. I also think it’s important to note that they put their work in conversation with the communities it serves as well as people who have undertaken similar projects. They focus their attention toward on-the-ground organizers who can genuinely create the change rather than some academics who prefer to keep their distance. Their transmedia organizing design is meant to be “cross-platform, participatory, and linked to action.”
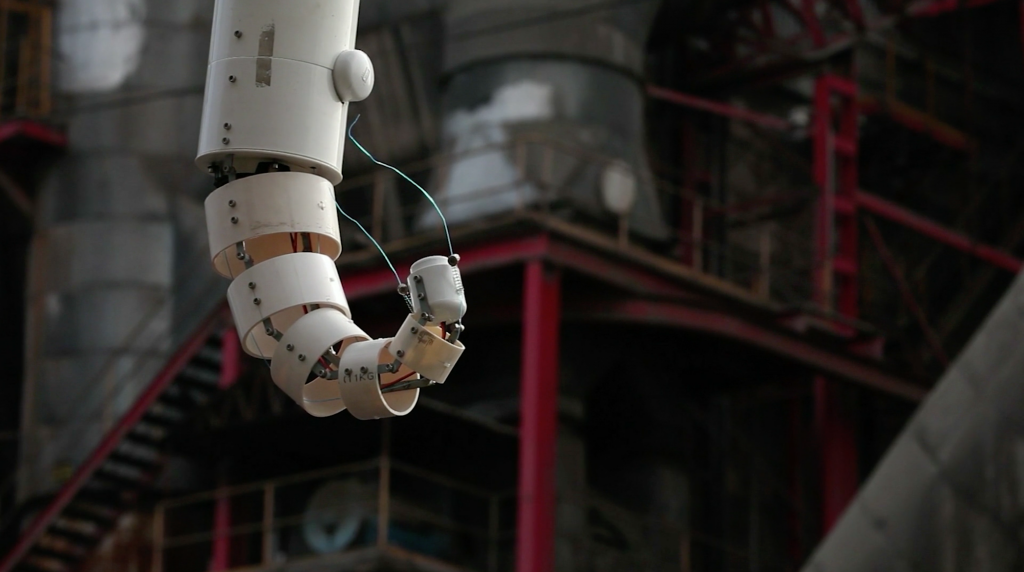
Gilberto Esparza is an artist based in Mexico, and his work explored the relationship between the built environment and the natural environment. Esparza mainly used electronics and robotics as his medium to express, making his work futuristic and engaging. Furthermore, I think his work achieved great depth in discussing our impact on the natural world. I especially admired Esparza’s Urban Parasites project and his Nomadic Plants project. What I found interesting across Esparza’s projects was the interaction between his robots and their surrounding environment. In the Urban Parasites project, Esparza made robot insects from industrial wastes, and he designed the robots to be autonomous. The robot insects convert the city’s light energy into the electricity that they require to function. In the Nomadic Plants project, Esparza’s robots acquired energy from contaminated waters in the city. What was most interesting about Esparza’s work is how he focused on how the robots would blend into the urban environment and people’s interaction with those robots. His projects inspired people living in urban communities to reflect on the consequences of urbanization and pollution. Finally, Esparza’s project lecture presented videos and photographs and introduced his process with sketches, which was engaging.
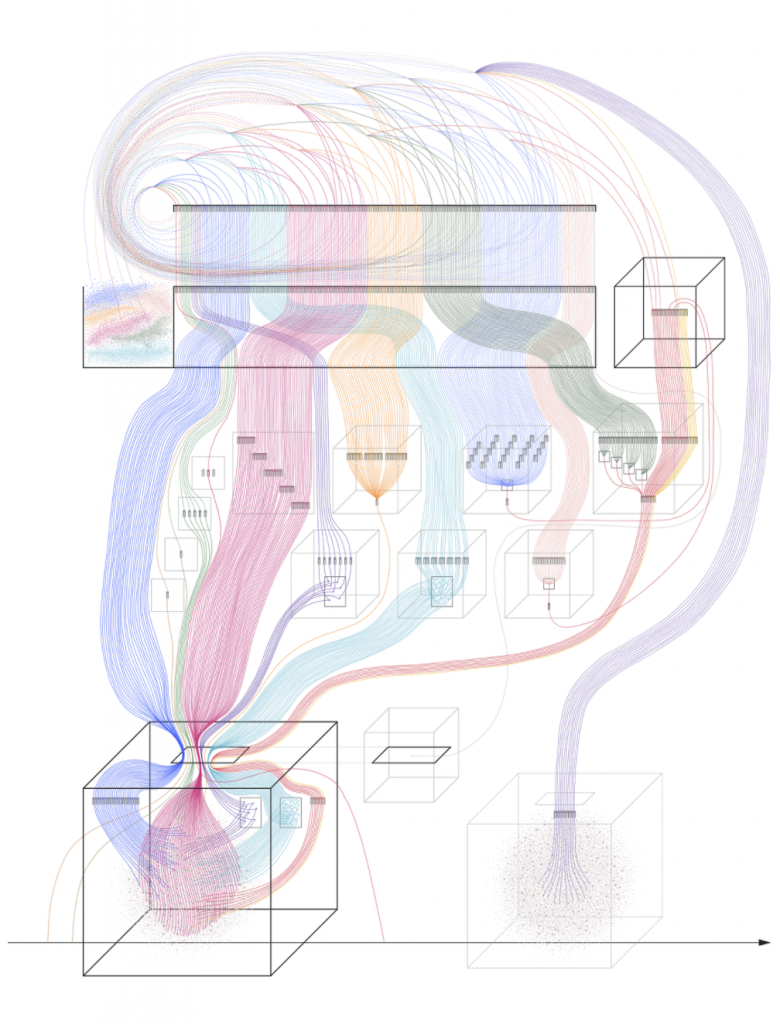
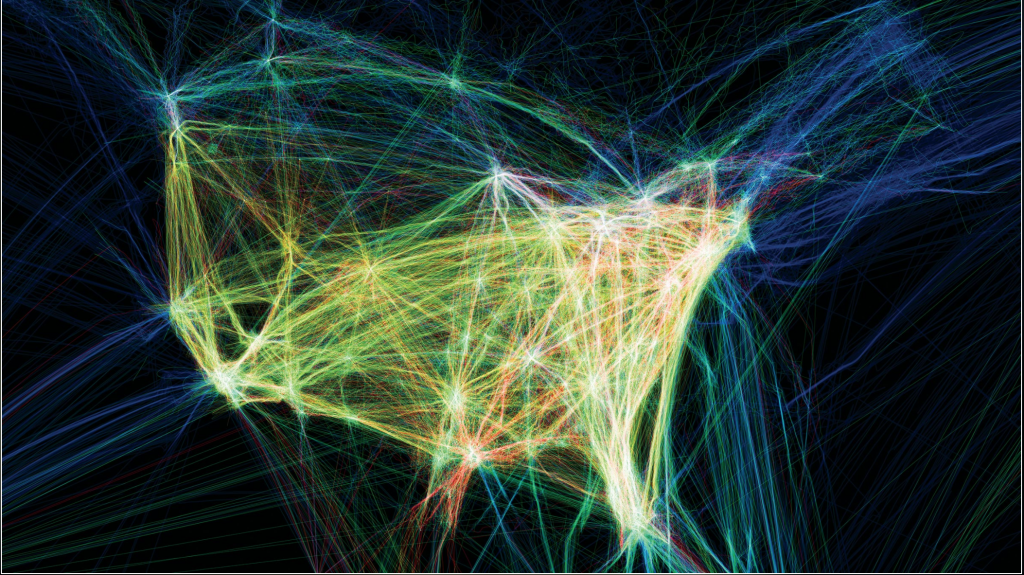
I really enjoyed the work by Aaron Koblin. Their work, “Flight Patterns” is very exquisite in terms of the visual elements. I really enjoy the glowing effect of the many lines. I also am fascinated by the idea behind. It basically maps the paths of air traffic over North America in colour and form. It was done using the Processing programming environment as they took data from the FAA. I enjoy the randomness of the lines and the abstract shape of North America that is created with line densities. I also like how the major destination are highlighted because of the number of lines starting and ending there. The artist has done a good job of preserving its cohesiveness while working that big of a data set.
Mike Tucker has had quite the route to the work he has been doing for the past 5 years(from 2017). Most recently, he worked at Flash until it died due to Facebook and then to Magic Leap. He considers himself to be an Interactive Director, Designer & Develop. His most recent work has been Tonandi, Tana Pura, and PolyFauna. He works on spatial computing projects creating an augmented reality that turns sound into visual tech that you can touch and intact with the changed visuals, and therefore create your sound. People have described this as feeling a sort of synesthesia. Specifically his work with the Tonandi project at Magic Leap doing spatial sound and combining instillation withflexinility, making soundscapes. One thing that Tucker went on in his lecture to talk about was the importance of the environment in these augmented reality experiences. This struck home for me as someone who just did an AR reality project in my environmental design class. It was very easy for me to imagine the future of this project and how it could be used to re-image museum space. I admire his work on Tana Pura creating sound into a visual in real space. I think in the future there will be a real market for this especially for work for clients who want to integrate technology in spaces.
Tana Pura YouTube VideoImage from Tana Pura Project
Tucker’s way of presenting reminded me a lot of listening to a Ted talk. I like how he explains his work first, but at the end also talks about ways and platforms that you can get into work like his and how this technology is being implemented now, and where the future most likely lies in it.
For this project, I was excited to explore different types of curves and how you can create new ones through simple interactions. I started off my process by looking at and trying different curves in Sublime to see which ones were the most interesting to change. I also spent some time plugging mouseX and mouseY into different parts of the equation to see how they changed. I found it interesting that curves can look completely different based on which variables were changed. For instance, I used a Cayley’s Sextic curve for one of my curves, which looks like a rounded heart. However, when you control the ratio multiplied by cosine, it changes the number of curves and their rotation so it looks like a flower.
//Catherine Liu
//jianingl@andrew.cmu.edu
//Section D
//jianingl_07_Project

var type = 1 //keeps track of current type of curve

//draws two different types of curves that changes with mousePressed
function setup() {
    createCanvas(480, 480);
}

function draw() {
    //checks for current curve
    if (type == 1) {
        drawSextic();
    } else if (type == 2) {
        drawAstroid();
    }
}

function drawAstroid() {
    //Astroid
    //https://mathworld.wolfram.com/Astroid.html
    //creates a circular form with curves around the circumference
    var red = min(mouseX, 255);
    var green = min(mouseY, 255);
    fill(red, green, 0);
    noStroke();
    translate(width/2,height/2);
    background(0);
    beginShape();
    var x ;
    var y ;

    var b = map(mouseY, 0, 480, 10, 20); //controls number of curves around circumference
    var a = constrain(mouseX, 0, width/2); //controls size of circle curve
    rotate(radians(mouseY/3));
    for (i = 0; i < 480; i++) {
        var theta = map(i,0,480, 0, TWO_PI);
        x = (a-b)*cos(theta) + b*cos((a-b)/b*(theta));
        y = (a-b)*sin(theta) - b*cos((a-b)/b*(theta));
        vertex(x,y);
    }
    endShape();

}

function drawSextic() {
    //Cayley's Sextic
    //https://mathworld.wolfram.com/CayleysSextic.html
    //creates a flower form with different numbers of petals
    push();
    var blue= min(mouseX, 255);
    var red = min(mouseY, 255);
    translate(width/2,height/2);
    fill(red,0,blue);
    noStroke();
    background(0);
    beginShape();
    var x ;
    var y ;

    var b = map(mouseY, 0, 480, 0, 1); //controls rotation and number of petals
    var a = map(mouseX, 0, width, 0, 150); //controls size of form
    rotate(radians(mouseY/5));
    for (i = 0; i < 480; i++) {
        var theta = map(i, 0, 480, 0, PI * 3);
        x = (3*a*pow(cos((1/b)*theta),3)*cos(theta));
        y = (3*a*pow(cos((1/b)*theta),3)*sin(theta));
        vertex(x,y);
    }
    endShape();
    pop();
}

function mousePressed() {
    //switches current curve when mouse is pressed
    if (type == 1) {
        type += 1
    } else if (type == 2) {
        type = 1
    }
}
![[OLD SEMESTER] 15-104 • Introduction to Computing for Creative Practice](../../../../wp-content/uploads/2023/09/stop-banner.png)