SiminLi- Project 3 One Point Perspective Dynamic Drawing

siminl-project3

// Simin Li
// Section C
// siminl@andrew.cmu.edu
// Project 3
var sqrMin = 20;
var sqrMax = 180; //limitations to size of square
var vanishX = 320;
var vanishY = 240;
var X1 = 200;
var Y1 = 120;
var A1 = 20; //coordinates and length of top left large square

var X2 = 440;
var Y2 = 120;
var A2 = 20; //coordinates and length of top right large square

var X3 = 200;
var Y3 = 360;
var A3 = 20;//coordinates and length of bottom left large square

var X4 = 440;
var Y4 = 360;
var A4 = 20;//coordinates and length of bottom right large square

var light = 255; //control brightness of large suqares and background

function setup() {
    createCanvas(640, 480);
}
function draw() {
    colorMode(RGB);
	background(255 - light);//changes the color of the background with respect to distance from 
    //vanishing points to center of canvas
    rectMode(CENTER); 
    noCursor();//remove mouse

var from14 = color(255,255 ,0);//"Yellow"; first base color for squares 1 and 4
var to14 = color(65,105,225);//"RoyalBlue"; second base color for squares 1 and 4
var from23 = color( 0,191,255); //"Deepskyblue"; first base color for squares 2 and 3
var to23 = color(255,255 ,0);//"Yellow"; second base color for squares 2 and 3
	
    A1 = map(dist(vanishX,vanishY,X1,Y1),0, dist(X1,Y1,640,480),sqrMin,sqrMax);
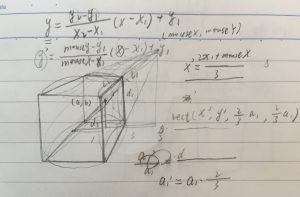
	var a1 = A1 * 2 / 3; //length of small squares is always a third of the large squares
	A2 = map(dist(vanishX,vanishY,X2,Y2),0, dist(X2,Y2,0,480),sqrMin,sqrMax);
    var a2 = A2 * 2 / 3;
    A3 = map(dist(vanishX,vanishY,X3,Y3),0, dist(X3,Y3,640,0),sqrMin,sqrMax);
    var a3 = A3 * 2 / 3;
    A4 = map(dist(vanishX,vanishY,X4,Y4),0, dist(X4,Y4,0,0),sqrMin,sqrMax);
    var a4 = A4 * 2 / 3;
    // length of sqaures is correlated to the distance from square center to farthest corner

    light = map(dist(vanishX,vanishY,width / 2,height / 2),0, dist(width / 2,height / 2,0,0),0,255);
    //changes the color of the background with respect to distance from vanishing points to center of canvas
  
    fill(light);
    rect(X1,Y1,A1,A1);
    rect(X2,Y2,A2,A2);
    rect(X3,Y3,A3,A3);
    rect(X4,Y4,A4,A4); // draw large squares

	vanishX = min( max(0,mouseX),640);
    vanishY = min(max(0,mouseY), 480);//vanish point of one point perspective
    
    var x1 = (2 * X1 + vanishX) / 3; 
    var y1 = ((vanishY - Y1) / (vanishX - X1)) * (x1 - X1) + Y1; //position of small squares are at
    // a third of vanishing point and center of large square
    var X1L = X1 - A1 / 2;
    var X1R = X1 + A1 / 2;
    var Y1T = Y1 - A1 / 2;
    var Y1B = Y1 + A1 / 2;// coordinates of 4 corners of large squares(used later to draw lines)
    var x1L = x1 - a1 / 2;
    var x1R = x1 + a1 / 2;
    var y1T = y1 - a1 / 2;
    var y1B = y1 + a1 / 2; // coordinates of 4 corners of small squares


	strokeWeight(4);
	line(X1L, Y1T, x1L, y1T);//top left connect 
    line(X1R, Y1T, x1R, y1T);//top right connect
    line(X1L, Y1B, x1L, y1B);//bottom left connect
    line(X1R, Y1B, x1R, y1B);//bottom right connect

    var x2 = (2 * X2 + vanishX) / 3; 
    var y2 = ((vanishY - Y2) / (vanishX - X2)) * (x2 - X2) + Y2;
    var X2L = X2 - A2 / 2;
    var X2R = X2 + A2 / 2;
    var Y2T = Y2 - A2 / 2;
    var Y2B = Y2 + A2 / 2;
    var x2L = x2 - a2 / 2;
    var x2R = x2 + a2 / 2;
    var y2T = y2 - a2 / 2;
    var y2B = y2 + a2 / 2;
    

	strokeWeight(4);
	line(X2L, Y2T, x2L, y2T);//top left connect 
    line(X2R, Y2T, x2R, y2T);//top right connect
    line(X2L, Y2B, x2L, y2B);//bottom left connect
    line(X2R, Y2B, x2R, y2B);//bottom right connect

    var x3 = (2 * X3 + vanishX) / 3; 
    var y3 = ((vanishY - Y3) / (vanishX - X3)) * (x3 - X3) + Y3;
    var X3L = X3 - A3 / 2;
    var X3R = X3 + A3 / 2;
    var Y3T = Y3 - A3 / 2;
    var Y3B = Y3 + A3 / 2;
    var x3L = x3 - a3 / 2;
    var x3R = x3 + a3 / 2;
    var y3T = y3 - a3 / 2;
    var y3B = y3 + a3 / 2;

	strokeWeight(4);
	line(X3L, Y3T, x3L, y3T);//top left connect 
    line(X3R, Y3T, x3R, y3T);//top right connect
    line(X3L, Y3B, x3L, y3B);//bottom left connect
    line(X3R, Y3B, x3R, y3B);//bottom right connect

    var x4 = (2 * X4 + vanishX) / 3; 
    var y4 = ((vanishY - Y4) / (vanishX - X4)) * (x4 - X4) + Y4;
    var X4L = X4 - A4 / 2;
    var X4R = X4 + A4 / 2;
    var Y4T = Y4 - A4 / 2;
    var Y4B = Y4 + A4 / 2;
    var x4L = x4 - a4 / 2;
    var x4R = x4 + a4 / 2;
    var y4T = y4 - a4 / 2;
    var y4B = y4 + a4 / 2;

    strokeWeight(4);
    line(X4L, Y4T, x4L, y4T);//top left connect 
    line(X4R, Y4T, x4R, y4T);//top right connect
    line(X4L, Y4B, x4L, y4B);//bottom left connect
    line(X4R, Y4B, x4R, y4B);//bottom right connect
    
    colorMode(RGB);
    inter1 = lerpColor(from14, to14,dist(vanishX,vanishY,X1,Y1) / dist(X1,Y1,height,width));// far right corner is(640,480)
    inter4 = lerpColor(from14, to14,dist(vanishX,vanishY,X4,Y4) / dist(X4,Y4,0,0));// far left corner is(0,0)
    inter2 = lerpColor(from23, to23,dist(vanishX,vanishY,X2,Y2) / dist(X2,Y2,0,height));//far left corner is(0,640)
    inter3 = lerpColor(from23, to23,dist(vanishX,vanishY,X3,Y3),0, dist(X3,Y3,width,0)); //fills squares based 
    //their distance from their furthest corner(according to x, y position)
    //far right corner is(640,0)
    fill(inter1);         
    rect(x1,y1,a1,a1);
    fill(inter4); 
    rect(x4,y4,a4,a4); 
    fill(inter2); 
	rect(x2,y2,a2,a2);
    fill(inter3); 
	rect(x3,y3,a3,a3); //draw and fill small squares 
  
    
     push();  //draw rotating flower to replace cursor
    translate(mouseX,mouseY);
    scale(2, 1); //stretched horizontally to 2 times
    rotate(millis() / 1000) ;
    noStroke();

    fill(255);
    ellipse(0,0,20,4);
    ellipse(0,0,4,20);//white petals 

    push();
    rotate(PI/4.0);
    ellipse(0,0,20,4);
    ellipse(0,0,4,20);//white petals that are rotated 45 degrees 
    fill("Gold");
    ellipse(0,0,5,5);//center
    pop(); 
    pop();
}

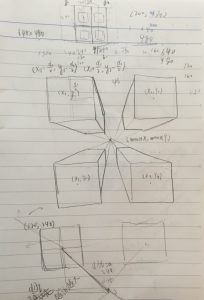
The idea for this project was inspired by learning about one point perspective, two point perspective and three point perspective images in drawing class. In one point perspective images all lines on the yz plane intersect at one point called the vanishing point. the rest of the lines are parallel. The vanishing point in this dynamic drawing is the flower and the boxes are leaves.

project-3-2project-3

mdambruc-Looking Outwards-03

weather-forecast-box-tempescope-ken-kawamoto-5

The Tempescope; A Bedside Visual Representation of Weather

Video of The Tempescope

http://www.tempescope.com/


Ken Kawamoto “The Tempescope”

The Tempescope, created by Japanese software engineer Ken Kawamoto in 2015 is a physical display of weather that is wirelessly connected to a computer in real-time to show a visual representation of the world outside – who needs windows? I admire this project because the simulation of weather in a small compact box is amazing to me. It is taking an aspect of life that I used to believe was out of the hands of humans and manipulating it to a size that fits on a bedside table. Kawamoto’s sensibilities have manifested in rain droplets, mist and even personal thunderstorms. Starting as a shampoo bottle prototype, crowdfunding has single-handedly brought the tempescope to consumers. The entire programming of the product is available on GitHub which allows the public to create their own Tempescope if they wish. Kawamoto’s goal for the project was to “always have the sunshine (and occasional tropical thunderstorms) of the Okinawa Isles in the living room”, which I believe he has achieved quite successfully. Kawamoto is very generous in allowing open access to his opensource GitHub of the Tempescope, and I believe it is a response to the overwhelming support he received through crowdfunding.  

LookingOutwards-03

My dad is a Mechanical Engineering professor here at CMU, and for the longest time I assumed that, being a humanities person, I would never understand exactly what my dad does. A few months ago, he brought home some metal rings and some plastic bracelets and necklace pendants. I’d been amazed when he told me that it was a computer algorithm that made aesthetically pleasing patterns. This was the kind of programming that I could be interested in. I’m sorry to admit that I know very little about the actual algorithm other than my dad and some of his students created it.  The goal is for users to be able to design their own creations from home and then be able to print them themselves.

screen-shot-2016-09-13-at-6-36-56-pm

http://phys.org/news/2016-05-complex-d-jewelry.html

Michal Luria – Looking Outwards – 03

Growing Objects / N-e-r-v-o-u-s System

The project I chose this week is an exhibition presented in 2014 called “Growing Objects”. The notion behind this work is to explore how structures are created in nature. The artists translated complex scientific theories and mathematical growing models into algorithms, and allowed 3D printers to generate objects according to these rules.

nervous.com

What I like about this work is that the artist, like in all generative art, does not know what will be the outcome on their art. But even more so, the artist experiences a creation of something that is structured in the same mysterious way as in nature. They can learn something new, and allow others to learn – how models evolve in nature, sometimes over hundreds or thousands of years, is now presented in an art gallery, by using fabrication.

nervous.com

Furthermore, this type of art using a set of rules creates beautiful sculptures that would be hard to create otherwise. The rules are already determined. The artist just needs to choose an inspiration (in this case, structures from nature), analyze their scientific rules, and then must let go and allow the art to create itself.

nervous.com

mdambruc-Project-03-Dynamic Drawing

project-03

//Mairead Dambruch
//mdambruc@andrew.cmu.edu
//Section C
//Project-03
var xT;// x value for turquoise circles
var yT; // y value for turquoise circles

var diamx = 30; //x value diameter
var diamy = 30; // y value diameter

var diffx = 0;
var diffy = 0;// x and y values to get dragging effect

var drag = .05; //speed of dragging effect

var swarmX = 300;
var swarmY = 300;// original ball orientation

var swarmXA = 200;
var swarmYA = 200;//copy A ball orientation

var swarmXB = 100;
var swarmYB = 100;//copy B ball orientation

var swarmXC = 400;
var swarmYC = 400;//copy C ball orientation

function setup() {
    createCanvas(640, 480);
    xT = width/2;
    yT = height/2; // original orientation of turqoise circles
}

function draw() {

  var colR = map(mouseY, 0, height, 0, 255);
  var colG = map(mouseY, 0, height, 95, 95);
  var colB = map(mouseY, 0, height, 120, 120); //magic numbers are being used for color
    background(colR, colG, colB);

  diffx = mouseX - swarmX;
  diffy = mouseY - swarmY; // subtracting to get same position

  swarmX = swarmX + drag*diffx;
  swarmY = swarmY + drag*diffy; //specific speed of drag

  noStroke();
  fill(255);
  ellipse(swarmX, swarmY, diamx, diamy);//original circle

  diffx = mouseX - swarmXA;
  diffy = mouseY - swarmYA;
  swarmXA = swarmXA + (drag*2) *diffx;
  swarmYA = swarmYA + (drag*2) *diffy;
  noStroke();
  fill(255);
  ellipse(swarmXA, swarmYA, diamx, diamy);//altered circle A

  diffx = mouseX - swarmXB;
  diffy = mouseY - swarmYB;
  swarmXB = swarmXB + (drag/2)*diffx;
  swarmYB = swarmYB + (drag/2)*diffy;
  noStroke();
  fill(255);
  ellipse(swarmXB, swarmYB, diamx, diamy);//altered circle B

  diffx = mouseX - swarmXC;
  diffy = mouseY - swarmYC;
  swarmXC = swarmXC + (drag/4) *diffx;
  swarmYC= swarmYC + (drag/4) *diffy;
  noStroke();
  fill(255);
  ellipse(swarmXC, swarmYC, diamx, diamy);//altered circle C

  if (mouseIsPressed) //changes x diameter of ellipses
   diamx = 50;
   else {
     diamx = 30;
   }

  noStroke();
  fill("Turquoise");
  ellipse(xT, yT, diamx, diamy); //original turquoise circle
  noStroke();
  fill("Turquoise");
  ellipse(xT, yT/2, diamx, diamy); // altered position
  noStroke();
  fill("Turquoise");
  ellipse(xT/2, yT/2, diamx, diamy);//Altered position
  noStroke();
  fill("Turquoise");
  ellipse(xT/2, yT, diamx, diamy);//altered position

  if (mouseX > xT) {
    xT -= 1;
    offset = 5;//moves circles to the left if x variable of mouse is greater
  }

  if (mouseX < xT){
    xT += 1;
    offset = 5; // moves circles to the right if x variable of mouse is lesser
  }
}

I struggled a lot with many aspects of this assignment – mostly the functions and how they are able to be used without effecting other parts of the drawing. My drawing uses a few functions to vary different aspects of the piece and I am hoping to get better at being efficient at variables and hopefully more elaborate with designs. My drawing uses both the position of the mouse and the mousePressed function.

Brian Bizier-Looking Outwards-03


I’ll be honest, I’m not really what you’d call a “visual artist,” or whatever. I’m a writer who wanted to take a computer science class. In that sense, a lot of the work I’ve encountered because of this course has been a little over my head, both in terms of content and technique. That’s why I was happy to find this project: Grand Old Party. This fellow, Matthew Epler, the artist, took Gallup poll data for Republican candidates from the 2012 election. He visualized it as a simple line graph, and turned that line graph into the outline for butt plugs. Now, that’s a move that appealed to me on a number of levels. First, I understood how he did what he did. Second, given the traditional Judeo-Christian set of beliefs that defined (for some) the Republican party of 2012, and the fact that that particular set of beliefs doesn’t really incorporate butt plugs, I thought that this project had the perfect balance of humor, irony, and anti-authoritarian-punk-rock-fuck-you-icity.

Project-03-Dynamic Drawing

I wanted to experiment with triangles; when the first run came out okay, I gave it the company of 4 little ones. With the mouse pointer rolling around the screen, the motion is butterfly like.

I would have preferred the colors inside the triangles.

james-dynamicdrawing

//James Katungyi
//Section A 0900
//jkatungy@andrew.cmu.edu
//Assignment-Project-03

//butterfly1
var Wide = 300;
var Space = (310 - Wide);//fix space between triangles
var High = 4*Wide/5;
//butterfly 2,3,4,5
var Wide2 = 120;
var Space2 = (130 - Wide2); //fix space between triangles
var High2 = 4*Wide2/5;

function setup() {
  createCanvas(640, 480);
  background(0);
}

function draw() {
//map canvas background color to mouse X position
    var colR = map(mouseX,0,width,0,255);
    var colG = map(mouseX,0,width,0,0);
    var colB = map(mouseX,0,width,255,0);
    background (colR,colB,colG);
//map triangle base to mouse X & Y position on canvas
//when mouse X is in left half, triangle width reduces
	if (mouseX<=320){
	Wide = map(mouseX,10,320,30,150);
    Wide2 = map(mouseX,10,320,20,60);
    } 
//when mouse X is in right half, triangle width increases
    if ((mouseX>320) & (mouseX<640)){	
	Wide = map(mouseX,320,620,150,300);
    Wide2 = map(mouseX,320,620,60,120);
    }
//when mouse Y is in top half, triangle height reduces
    if (mouseY<=240){
	High = map(mouseY,0,240,20,120);
    High2 = map(mouseY,0,240,10,48);
    } 
//when mouse Y is in bottom half, triangle height increases
    if ((mouseY>240) & (mouseY<480)){	
	High = map(mouseY,240,480,120,240);
    High2 = map(mouseY,240,480,48,96);
    }
//butterfly 1 - center
    push();
    translate(width/2,height/2); //locate origin of triangle canvas at center of original canvas
    triangle(-Wide/2,-High/2,Wide/2,-High/2,0,High/2);//middle triangle
    triangle(-Wide/2-Space,-High/2,-Space-Wide,High/2,-Space,High/2);//left triangle
    triangle(Wide/2+Space,-High/2,Space+Wide,High/2,Space,High/2); //right triangle
    pop();
//butterfly 2 - top left
    push();
    translate(width/4,60); //relocate canvas origin to top left
    triangle(-Wide2/2,-High2/2,Wide2/2,-High2/2,0,High2/2);//middle triangle
    triangle(-Wide2/2-Space2,-High2/2,-Space2-Wide2,High2/2,-Space2,High2/2);//left triangle
    triangle(Wide2/2+Space2,-High2/2,Space2+Wide2,High2/2,Space2,High2/2); //right triangle
    pop();
//butterfly 3 - top right
push();
    translate(width - width/4,60); //relocate canvas origin to top right
    triangle(-Wide2/2,-High2/2,Wide2/2,-High2/2,0,High2/2);//middle triangle
    triangle(-Wide2/2-Space2,-High2/2,-Space2-Wide2,High2/2,-Space2,High2/2);//left triangle
    triangle(Wide2/2+Space2,-High2/2,Space2+Wide2,High2/2,Space2,High2/2); //right triangle
    pop();
//butterfly 4 - bottom left
    push();
    translate(width/4,420); //relocate canvas origin to bottom left
    triangle(-Wide2/2,-High2/2,Wide2/2,-High2/2,0,High2/2);//middle triangle
    triangle(-Wide2/2-Space2,-High2/2,-Space2-Wide2,High2/2,-Space2,High2/2);//left triangle
    triangle(Wide2/2+Space2,-High2/2,Space2+Wide2,High2/2,Space2,High2/2); //right triangle
    pop();
//butterfly 5 - bottom right
push();
    translate(width - width/4, 420); //relocate canvas origin to top bottom right
    triangle(-Wide2/2,-High2/2,Wide2/2,-High2/2,0,High2/2);//middle triangle
    triangle(-Wide2/2-Space2,-High2/2,-Space2-Wide2,High2/2,-Space2,High2/2);//left triangle
    triangle(Wide2/2+Space2,-High2/2,Space2+Wide2,High2/2,Space2,High2/2); //right triangle
    pop();
}

Michal Luria – Project 03 – Dynamic Drawing

mluria-project03

/*  Submitted by: Michal Luria
	Section A: 9:00AM - 10:20AM
	mluria@andrew.cmu.edu
	Assignment-03-A
*/

var space = 130; //space between squares 

function setup() {
    createCanvas(640, 480);
}
 
function draw() {
 
    noStroke();
    
    //pink square location determined by blue square
    var pinkSqX = width - mouseX; 
    var pinkSqY = height - mouseY;

    //map mouse movement to background range
    var bg = map(mouseY, 0, height, 150, 255);

    //map distance from center to square size
    var distCenter = dist(mouseX, mouseY, width/2, height/2);
    var sqSize = map(distCenter, 0, 300, 50, 400);
    
    background(bg);
    rectMode(CENTER);

    //top square
    fill("LightBlue");
    rect(mouseX, mouseY, sqSize, sqSize); 

    //bottom square
    fill("LightPink");
    rect(pinkSqX, pinkSqY, sqSize, sqSize);

    rectMode(CORNER);
    //top rect
    fill("DarkBlue");
    rect(0, 30, mouseX - space, 200);  

    fill("DeepPink");
    //bottom rect
    rect(pinkSqX + space, 250, mouseX - space, 200); 

}

Looking Outwards 04

I really liked this display of music through the use of both repeating and unique algorithms that harmonize together in a real world fashion. Everything was controlled by the computer’s MIDI signal and was converted into either mechanical or electronic sounds. I really respect the amount of time and effort that must have gone into making this ensemble, and the author’s own creativity was really shown through the complexity and scale of this project. It introduced a new form of sound generation to me, and I think that it is an interesting and fascinating way to produce new music. I’ll definitely be keeping an eye out for more in the future!

Project 3: Dynamic Drawing

sketch

/*Emma Shi
Section B
eyshi@andrew.cmu.edu
Project 3
*/

function setup() {
    createCanvas(640, 480);
}
function draw() {
    var ellipseR = map(0, mouseX, height, 255, 254);
    var ellipseG = map(0, mouseX, height, 203, 138);
    var ellipseB = map(0, mouseX, height, 2, 5);
    var backR = map(0, mouseX, height, 15, 139);
    var backG = map(0, mouseX, height, 19, 237);
    var backB = map(0, mouseX, height, 37, 255);

    background(backR, backG, backB);
    //background changes from navy to light blue as mouse moves across
    fill(ellipseR, ellipseG, ellipseB);
    ellipse(320, 240, 100, 100);
    //circle changes from yellow to orange as mouse moves across

    var xHeight = map(0, mouseX, height, 640, 480);
    var xWidth = map(0, mouseX, height, 640, 480);
    ellipse(width/2, height/2, xWidth, xHeight);
    //changes size (height) of circle 

    fill(255);
    rect(width-mouseX, height/500, 50, 50);
    rect(width-mouseX, height/8, 50, 50);
    rect(width-mouseX, height/4, 50, 50);
    rect(width-mouseX, height/2.67, 50, 50);
    rect(width-mouseX, height/2, 50, 50);
    rect(width-mouseX, height/1.6, 50, 50);
    rect(width-mouseX, height/1.33, 50, 50);
    rect(width-mouseX, height/1.14, 50, 50);
    //transition rectangles that change direction with mouseX

    fill(248, 221, 136);
    noStroke();
    angleMode(DEGREES);
    var rot = atan2(mouseY-height/2, mouseX-width/2);
    push();
    translate(width/2, height/2);
    rotate(rot);
    rect(130, 150, 60, 60);
    rect(-190, 150, 60, 60);
    rect(-250, -100, 60, 60);
    rect(-80, -250, 60, 60);
    rect(160, -170, 60, 60);
    rect(200, -10, 60, 60);
    pop();
    //changes rotation of rectangles around the circle

    }

For this project, I had for the screen to switch from an abstract, simplistic version of nighttime to daytime. As the user moves the mouse from left to right, the background changes from navy to light blue, and the “sun” (circle in the middle) changes from yellow to orange. The rotating rectangles around can represent craters of the moon or rays of sun.

I also took the idea of a changing “slide” (the column of rectangles that moves through the image) as a transition aide that allows the viewer to move from seeing the “night” to “day” (and vice versa).