rkondrup-project-04-string-art

sketch

//ryu kondrup
//rkondrup@andrew.cmu.edu
//Section D
//project-04-string-art

var shadow = 5;
var downDown = 30;

function setup() {
    createCanvas(400, 300);
    strokeWeight(1);
    noFill();

}

function draw() {
    background(0);
    for (var i = 20; i < 400; i += 20) {
      //line(i*1.2+120, 0, i/4-50, height);
      //line(i*1.2+120, 0, i/20+200, height+200);
      //line(i/20+200, height+200, 0, 0);

      //red
      stroke(255, 0, 0);
      //big swoop
      bezier(-100, height+1000,
        i*.6, i+10, i*2, i*1.2,
        width-i+100, height-i+100);
        //small swoop
      bezier(0, i*.2+downDown,
             i*.2, i*.3+downDown,
             i*1.7, i*1.6+downDown,
             -100, height+1000+downDown);

        //blue
        stroke(0, 0, 255);
        //big swoop
        bezier(-100+shadow*.4, height+1000,
          i*.6, i+10+shadow*.4, i*2, i*1.2,
          width-i+100+shadow*.4, height-i+100);
          //small swoop
          bezier(0+shadow*.4, i*.2+downDown,
                 i*.2+shadow*.4, i*.3+downDown,
                 i*1.7+shadow*.4, i*1.6+downDown,
                 -100 + shadow*.6, height+1000+downDown);

        //green
        stroke(0, 255, 0)
        //big swoop
        bezier(-100 + shadow*.6, height+1000,
          i*.6 + shadow*.6, i + 10,
          i*2 + shadow*.6, i*1.2,
          width-i + 100 + shadow, height - i + 100);
        //small swoop
        bezier(0 + shadow*.6, i*.2+downDown,
               i*.2 + shadow*.6, i*.3+downDown,
               i*1.7 + shadow*.6, i*1.6+downDown,
               -100 + shadow*.6, height+1000+downDown);


    }

}

In this project, I wanted to create something simple and abstract, but also explore different forms that can be made using curves inside of for loops. I also wanted to experiment with visual effects, so I offset each curve slightly and changed colors to RGB values to give the lines a sense of three-dimensionality and layering.

nahyunk1-Looking Outwards 04 : Sound Art

The computational sound art that I’m most familiar with is the sound looper that many artists and composers use when they create instrumentals or the background music for most songs. Because I enjoy listening to music and is very much interested in knowing about the mechanism of some musical productions, the loops used for each measure is a quality in music that I admire and also aspire to learn the techniques later on. This looper is used with an artist adding a few notes in a rhythmical series as an input and keeps on adding more notes and other sound effects by adding layers of loops on top of each other.

here is the link to an artist who sings and creates music through looping sound.

yunzhous-LookingOutward-02

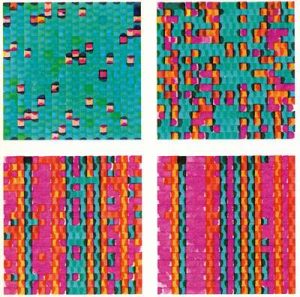
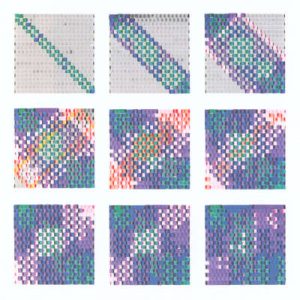
The artwork I chose is the “Matrizenmultiplikation, Serie 40” by Frieder Nake. Using the right colors and combining colors is hard. It can be troubling when making such decision. What if the computer helped us to make the decision? I really appreciate the variety of colors and the saturation in the artwork. I think the computer has generated a beautiful image. The software that the artist used is called Matrizenmultiplikation in Algol60. I suppose the artist set a grid system through the algorithm and assign made many categories of colored squares. Then the colored squares would randomly be scattered in the grid system to make color combinations. I think Nake shows hist artistic sensibilities through dividing the grid system into several areas and each area can only have certain number of random colors. This way the colors won’t be all randomly mixed together. They would have certain order while still being random. I think it would be interesting to try out more shapes than grid system.
You can see the work here

yoonyouk-project04-stringart

sketch

//Yoon Young Kim
//Section E
//yoonyouk@andrew.cmu.edu
//project04-stringart

var x = 0;
var y = 10;

function setup() {
    createCanvas(400, 300);
    background(0);
    strokeWeight(2);    
    for(var i = 0; i<200; i+=5){
    //red line
    stroke(247, 38, 81, 95);
    line (6*i, height, width, height-2*i);

    //yellow line
    stroke(247, 219, 29, 95);
    line (6*i, height, width, height-6*i);

    //green line 
    stroke(55, 156, 121, 100);
    line (0, 5*i, 5*i, 299);


    //blue line
    stroke(66, 126, 226, 95);
    line (0, 5*i, 5*i+100, 299);
    }

//CUBE
changeX = 20;
changeY = 20;
    // purple line

    translate(100, -25);
    stroke(181, 52, 255);
    strokeWeight(2);
    x1 = 20;
    y1 = height/2 - 25;
    x2 = 70;
    y2 = height/2;
    for (var i = 0; i<9;i++){
    line(x1 + changeX, y1, x2 + changeX, y2);
    changeX += 10;
    }

    //magenta line
    stroke(181, 39, 103);
    strokeWeight(2);
    x1 = -20;
    y1 = 150;
    x2 = -20;
    y2 = height/2 + 75;
    for(var i = 0; i<9;i++){
    line(x1+changeX, y1, x1+changeX, y2);
    changeX +=10;
    }

    //violent line
    stroke(64, 50, 130);
    strokeWeight(2);
    x1 = -160;
    y1 = 105;
    x2 = -160;
    y2 = 180;
    for(var i = 0; i<5;i++){
    line(x1 + changeX, y1 + changeY, x2 + changeX, y2 + changeY);
    changeX += 10;
    changeY += 6; 
    }
}

function draw() {
}

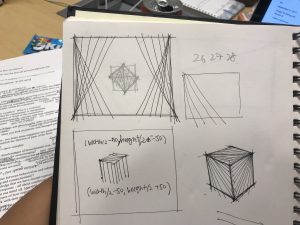
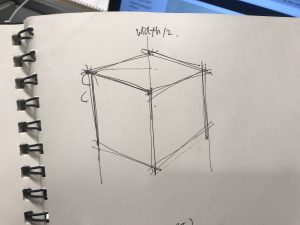
I found this project particularly difficult because, unlike the previous projects, we cannot simply plug in different values. It was very confusing when I though I added the appropriate values. However, once I understood how to use loops I realized how much easier it is to use rather than drawing out many different lines individually.

Originally my plan was a little more complicated than the final product; however, I was still able to achieve something that looks like a cube.

mmiller5-Project-04

sketch

//Michael Miller
//mmiller5
//Section A
function setup() {
    createCanvas(400, 300);
}

function draw() {
    var centerDist =
	min(dist(mouseX, mouseY, width / 2, height / 2), 100);
    var inverseCenterDist =
	min(100 / dist(mouseX, mouseY, width / 2, height / 2), 100);
    /* gradient circle background, use loop to make many progressivley smaller
       circles that are slightly different color */
    for(var count = 0; count < 255; count++) {
	noStroke();
	var countPerc = (1 - count / 255) //percentage of the way through loop
	fill(255 - count);
	ellipse(width / 2, height / 2,
		1.4 * width * countPerc, 1.4 * height * countPerc);
    }
    
    /*Outside curves, as the mouse approaches the center, less iterations occur
      because iteration count is tied to mouse distance from the center*/
    stroke(0);
    strokeWeight(1);
    //top left curve
    curves(0, 0, 0, height / 2, 0, 0,
	   0, -height / 2 / centerDist, width / 2 / centerDist, 0,
	   centerDist, 0);
    //bottom left
    curves(0, 0, 0, height / 2, 0, height,
	   0, height / 2 / centerDist, width / 2 / centerDist, 0,
	   centerDist, 0);
    //top right
    curves(width, height, 0, height / 2, 0, height,
	   0, height / 2 / centerDist, width / 2 / centerDist, 0,
	   centerDist, 180);
    //bottom right
    curves(width, height, 0, height / 2, 0, 0,
	   0, -height / 2 / centerDist, width / 2 / centerDist, 0,
	   centerDist, 180);
    
    //Inside curves, as mouse approaches center, more iterations occur
    stroke(255);
    //bottom right middle curve
    curves(width / 2, height / 2, 0, height / 2, 0, 0,
	   0, -height / 2 / inverseCenterDist, width / 2 / inverseCenterDist, 0,
	   inverseCenterDist, 0);
    //top right middle
    curves(width / 2, -height / 2, 0, height / 2, 0, height,
	   0, height / 2 / inverseCenterDist, width / 2 / inverseCenterDist, 0,
	   inverseCenterDist, 0);
    //bottom left
    curves(width / 2, 3 * height / 2, 0, height / 2, 0, height,
	   0, height / 2 / inverseCenterDist, width / 2 / inverseCenterDist, 0,
	   inverseCenterDist, 180);
    //top left
    curves(width / 2, height / 2, 0, height / 2, 0, 0,
	   0, -height / 2 / inverseCenterDist, width / 2 / inverseCenterDist, 0,
	   inverseCenterDist, 180);
}
/*Generic curve function, x and y are the coordinates of translation, x1 and y1
are coordinates of one line endpoint, x2 and y2 are for the other endpoint, the
x and y steps are how much the coordinates shift after each iteration, limit is
how many iterations will be done, angle is the rotation of the curve*/
function curves(x, y, x1, y1, x2, y2,
		x1Step, y1Step, x2Step, y2Step,
		limit, angle) {
    for (var count = 0; count < limit; count++) {
	push();
	translate(x, y);
	rotate(radians(angle));
	line (x1 + x1Step * count, y1 + y1Step * count,
	      x2 + x2Step * count, y2 + y2Step * count);
	pop();
    }
}
	

I think this turned out pretty well.  Creating a general function for curves made the project much easier and cut down on the coding significantly.  I also wanted to make a gradient in the background, and I was able to use for loops to make that happen which I thought was pretty neat.  I also wanted it to be dynamic, so I had the inner and outer curves have different iteration counts depending on where the mouse was on the screen.

kyungak-project-04-string-art

sketch

function setup() {
    createCanvas(400, 300);
}

function draw() {
    background(95, 138, 128);

    var xpt1; //starting x coordinate
    var ypt1; //starting y coordinate   

//background blue lines
    strokeWeight(1);
    stroke(45,72,94,100);
    
    for (var xpt1 = 0; xpt1 < 30; xpt1 += 1) {
        line(0,10*xpt1,50*xpt1,300); //bottom grid background
        line(399,10*xpt1,20*xpt1,1); //top grid background
    }

//thick transparent blue lines 
    strokeWeight(7);                           
    stroke(82, 88, 135,130);

    for (var xpt1 = 0; xpt1 < 250; xpt1+=25) {      
        var ypt1 = 200;
        line(130, 50, xpt1, ypt1); //starting from top right
        line(130,250,xpt1,ypt1); //starting from bottom right

    }

//thin brown line inside the blue lines
    strokeWeight(1.5);
    stroke(140, 126, 15);
    for (var xpt1 = 0; xpt1 < 250; xpt1+=25) {      
        var ypt1 = 200;
        line(130, 50, xpt1, ypt1); //starting from top right
        line(130,250,xpt1,ypt1);

    }

//think transparent red lines
    strokeWeight(10);
    stroke(140,69,94,130);

    for (var ypt1 = 0; ypt1 < 300; ypt1+=40) {
        var xpt1 = mouseX;
        line(230,200,xpt1,ypt1+10);
    }

//turquoise lines
    strokeWeight(2);
    stroke(111,138,95,150);

    for (var ypt1 = 0; ypt1 < 300; ypt1+=20) {
        var xpt1 = mouseX;
        line(227,200,xpt1,ypt1+10)

    }

//eyebrow + eyes
    strokeWeight(10);
    stroke(0,0,0,150);
    line(40,120,80,130); //eyebrow
    ellipse(50,150,10,10); //outer eye
    stroke(255);
    ellipse(50,150,2,2);//inner eye

}

I was able to further practice the function “for loop” to create the abstract lines in the background. I then used the template to make the body and the moving tail of the fish. I thought the project turned out to be interesting, but not as aesthetically pleasing as I wanted it to be.

creyes1-Project-04-String-Art

creyes1 Project-04

//Christopher Reyes
//Section D
//creyes1@andrew.cmu.edu
//Project-04 (String Art)

//Variables for all 4 quadrants of diamond, counter-clockwise from top-right
var x1q1 = 200;
var y1q1 = 0;
var y1q1Interval = 5;
var x2q1 = 200;
var x2q1Interval = 5;
var y2q1 = 150;

var x1q2 = 200;
var y1q2 = 0;
var y1q2Interval = 5;
var x2q2 = 200;
var x2q2Interval = 5;
var y2q2 = 150;

var x1q3 = 200;
var y1q3 = 300;
var y1q3Interval = 5;
var x2q3 = 200;
var x2q3Interval = 5;
var y2q3 = 150;

var x1q4 = 200;
var y1q4 = 300;
var y1q4Interval = 5;
var x2q4 = 200;
var x2q4Interval = 5;
var y2q4 = 150;

//Variables for counter-clockwise spinning blue ring
var angleRing1 = 0;
var innercircleSaturation = 74;
var saturationInterval = -1;

//Variables for clockwise spinning rainbow ring
var angleRing2 = 0;
var circleHue = 0;

//Centerpoint to base rings off of
var cx = 200; //X coordinate of circle origin
var cy = 150; //Y coordinate of circle origin

function setup() {
    createCanvas(400, 300);
    background(229, 225, 174); //Darker yellow background
    angleMode(DEGREES);

    noStroke();

    fill(252, 248, 194); //Lighter yellow circle
    ellipse(width/2, height/2, 350, 350);

    fill(158, 224, 239); //Sky blue circle
    ellipse(width/2, height/2, 245, 245);

    fill(256, 40); //Transparent white circles
    ellipse(100, 100, 300, 300);
    ellipse(300, 200, 300, 300);
    ellipse(300, 100, 300, 300);
    ellipse(100, 200, 300, 300);

    //Diamond, Quadrant 1
    for(var i = 1; i <= 40; i++) {
        x2q1 += x2q1Interval;
        y1q1 += y1q1Interval;
        stroke(256);
        line(x1q1, constrain(y1q1, 30, 150), constrain(x2q1, 200, 320), y2q1);
    }

    //Diamond, Quadrant 2
    for (var i = 1; i <= 40; i++) {
        x2q2 -= x2q2Interval;
        y1q2 += y1q1Interval;
        stroke(230);
        line(x1q2, constrain(y1q2, 30, 150), constrain(x2q2, 80, 200), y2q2);
    }

    //Diamond, Quadrant 3
    for (var i = 1; i <= 40; i++) {
        x2q3 -= x2q3Interval;
        y1q3 -= y1q3Interval;
        stroke(256);
        line(x1q3, constrain(y1q3, 150, 270), constrain(x2q3, 80, 200), y2q3);
    }

    //Diamond, Quadrant 4
    for (var i = 1; i <= 40; i++) {
        x2q4 += x2q4Interval;
        y1q4 -= y1q4Interval;
        stroke(230);
        line(x1q4, constrain(y1q4, 150, 270), constrain(x2q4, 200, 320), y2q4);
    }

}

function draw() {

    colorMode(HSB);

    //Creates a constantly-looping, counter-clockwise spinning
    //blue ring with a varying saturation
    for(var i = 1; i <=1; i++) {
        angleRing1 -= 5
        stroke(205, innercircleSaturation, 105);
        line(computeX(50, angleRing1), computeY(50, angleRing1),
            computeX(50, angleRing1+140), computeY(50, angleRing1+140));
        innercircleSaturation += saturationInterval;
        //Switches b/w increasing & decreasing saturation at certain thresholds
        if (innercircleSaturation < 20 && saturationInterval < 0 ||
            innercircleSaturation > 74 && saturationInterval > 0) {
            saturationInterval = -saturationInterval;
        }
    }

    //Creates a constantly-looping, clockwise spinning rainbow ring
    for(var i = 1; i <=1; i++) {
        angleRing2 += 5
        stroke(circleHue, 52, 70);
        line(computeX(350, angleRing2), computeY(350, angleRing2),
             computeX(350, angleRing2+140), computeY(350, angleRing2+140));
        circleHue += 15;
        //Resets hue of line drawn to H = 0 to make a continuous transition
        if (circleHue > 360) {
            circleHue = 0;
        }
    }

}

//Computes the X position of a point on a circle according to given parameters
function computeX(ringRadius, angle) {
    return cx + ringRadius*cos(angle);
}

//Computes the Y position of a point on a circle according to given parameters
function computeY(ringRadius, angle) {
    return cy + ringRadius*sin(angle);
}

I was initially unsure as to how to approach this project, but I was somewhat inspired by circular string art patterns and – after accidentally creating several infinite loops while figuring out this week’s assignments – the motion of loading cursors (the blue ring on Windows and rainbow pinwheel on iOS). I’m definitely pleased with the final product, and enjoyed being able to experiment with parameters and seeing the various effects it could have on the program. For instance, the rainbow swirl was initially an accident, but it forced me to look into precisely what that code was doing, understanding it, and then modifying and leveraging it in order to achieve the final effect.

eeryan-LookingOutwards-04

Link to vimeo

The Creatures of Prometheus by Simon Russell is a generative visualization of a Beethoven song, using pulsing graphics in coordination with the music to create a visual representation of the ballet. The animation is driven by a program (I think it’s a MIDI file, possibly through the Houdini program) that takes into account the pitch, note, and volume of the notes of the ballet and translates these factors into visual components like color and position that correspond to the particles that make up the visual representation. I like the extra dimension that this visualization gives to the ballet, allowing for a modern voice to be spoken through the traditional ballet piece.

jennyzha-Project 04

sketch

//project

var yspace = 10;
var xspace = 25; 
var x1 = 1;
var y1 = 299;
var x2 = 399;
var y2 = 1; 

function setup(){
	createCanvas(400, 300);
	background(0);
}

function draw() {
	for(var i = 0; i < 100; i +=1){
		strokeWeight(0.01);
		stroke(255);
		line(x1, height - yspace * i, xspace * i, y2);
		line(x1, yspace * i, xspace * i, y1);
		line(xspace * i, y1, x2, height - yspace * i); 
		line(x2, yspace * i, xspace * i, y2); 
	}
}


This was a really cool project for me, I think my favorite part is that when you refresh the page you can almost see the loop working as it draws up. The math behind the concepts of this code are also super interesting.

ablackbu-project04-String-Art

*move mouse between red and blue

sketch

var A = 5

function setup() {
    createCanvas(400, 300);
    strokeWeight(2);
}

function draw() {
    background(200);
    for (var i = 1; i < 50; i ++) { //draw 50 diagonal lines
      stroke(25,173,210)
      line(A*i, 0, 15*i, 150); //top blue lines
      line(15*i, 150, A*i, 300); //bottom blue lines
      stroke(0)
      line(15*i, 0, A*i, 150); //top black lines
      line(A*i, 150, 15*i, 300); //bottom black lines
    
    }
    if (mouseX > width/2){ //in mouse goesto blue, lines are less slanted
        A = 10
    }else{A = 5} //if red the lines are origionaly slanted

    //draws that 50% opaque box's
    push()
    strokeWeight(0)
    fill(255,0,0,50)
    rect(0,0,width/2,height)
    
    fill(0,0,255,50)
    rect(width/2,0,width/2,height)
    pop()
}

I thought this project was very interesting. Unlike previous weeks, this project was more about learning to use the program, in this example with “for” statements. I wanted to make a very intricate web of lines and I wanted to make them move. I made it so the web looks far more concentrated when you drag your mouse from one side to the other.