dnoh-sectionD-lookingoutwards-04

Project: Computer Replicating Voices

Video:

Key times: 9:30 -> 11:48

Artist (?): Cary Huang

Year: 2017

Although this “project” is from a content creator on Youtube, I thought it was fascinating how a programmer could create a specific algorithm to teach a computer to learn a specific voice. This was all done through the program, ARSS, or The Analysis & Resynthesis Sound Spectograph, Python, and another program called HyperGAN. The ARSS transfer sounds into images which is also modified through Python, then the HyperGAN software uses Convolutional and Deconvolutional neural networks to generate new images in the same style. The ARSS then transfer the images back into audio to become audible.

I find it amazing how not only can we start to teach computers to slowly learn through parameters, but also that such complex process and discovery was put into a YouTube video as if it were “just something cool”. Technology has come far enough to dismiss this amazing demonstration as “a cool video” that is shared around.

This video didn’t highlight an “artist”, rather it showed how complex computers can develop its neural networks. This creator also showed how AI could learn to play Jazz or Baroque music through hours of “training”, which brings another question… is a completely computer generated (through human made parameters) art? I think the thought and artistry behind the codes and programs behind such acts allow AI creation to be artworks.

rkondrup-Looking-Outwards-04


Artist Paul Prudence has created a new panoramic audiovisual performance work called The Mylar Typology which combines gelatinous oil-colored forms with slow pulsing auditory stimulus. The work utilizes what Prudence describes as “Slowly transforming abstractions of iridescent wavelets and hyperchromatic emulsions synchronised to binaural drones” to produce a calming effect, in part due to the effect of brainwave entrainment, in which neural wave frequencies synchronize with outside stimulus in order to reach an associated state of mental cognition, in this case, relaxation. Prudence aims to produce a sensorially immersive viewer/listener experience which leaves the subject matter largely ambiguous.

jwchou-project04-stringart

sketch 285

var ellipseX = 0
var ellipseY = -10


function setup() {
    createCanvas(400, 300);
    background(255, 173, 158);
    strokeWeight(0.5);
}


function draw() {
	createCanvas(400, 300);
	background(255, 173, 158);

	stroke(196, 154, 108);
	for (var i = 5; i < 100; i+=20) {
	line(50, 0, 380, i*0.1+20);
	stroke(27, 117, 188);		
	line(380, i*0.1+20, 0, i*0.2+70);
	stroke(43, 182, 115);
	line(0, i*0.25+70, 350, 0.4*i+150);
	stroke(241, 90, 41);
	line(350, 0.4*i+150, 0, i*1.5+200)

	ellipseX = ellipseX += 3;
    ellipseY = ellipseY += 0.2;
	ellipse(ellipseX, ellipseY, 15, 15);

    if(ellipseX > width) {
    	ellipseX -= 3;
    	ellipseY += 0;
    }


	}

//stroke(150);
//	strokeWeight(0.5);
//	for (var i = 0; i < 30; i++) {
//		line(0, height, 130 + (i*15), 70 - (i));
//	}
//
//	for (var i = 0; i< 500; i++) {
//		fill(255, 255, 0);
//		ellipse(0, height + i * 40, 40, 40);
//	}

}

Here is my… project… I wanted to lines to have some perspective, and I also wanted some kind of physical animation. I think I need to go back and review these concepts later because I don’t have a firm grasp on them yet (and I’m on a severe time crunch).

mmirho – Project 4 – Line Art

After constructing a loop template for myself, the rest of the process was simple figuring out how each end of the line moves: Left, right, up or down.

When it came to the curves inside the middle box, I had to change the structure a little, but it was still relatively the same.

It was interesting trying to find a balance between the number of loop iterations and the distance the lines move each iteration, it creates different densities.

sketch

function setup() {
  createCanvas(400, 300);
}

function draw() {
    background(200);

    //Top Left
    x1 = 0;
    y1 = height/2;
    //These two set up the location of the first coordinate
    //of the line

    x2 = 0;
    y2 = 0;
    //These two set up the second coordinate
    //And by setting the coordinates as variables, I can
    //manipulate them in the loop to move the line

    fill(0);

    for (loop = 0 ; loop < 12 ; loop += 1) {
        //This loop moves a simple variable loop
        //along a series of steps, and then the actual
        //changing line-effecting variables change
        //within the loop

        line(x1, y1, x2, y2);
        //The actual line, composed of variables

        x1 += 0;
        y1 -= height/20;
        //Controls the movement of the first coordinate

        x2 += width/20;
        y2 -= 0;
        //Controls the movement of the second

        //These coordinate movement controls vary depending
        //on the corner the curve is created in, because each
        //coordinate needs to move a different direction
    }
    noLoop();
    //Cuts off the loop

    //This formula is used over and over again
    //for all four outside curves and the two inside curves


    //Top Right
    x1 = width;
    y1 = height/2;
    x2 = width;
    y2 = 0;

    for (loop = 0 ; loop < 12 ; loop += 1) {
        line(x1, y1, x2, y2);
        x1 += 0;
        y1 -= height/20;
        x2 -= width/20;
        y2 -= 0;
    }
    noLoop();


    //Bottom Left
    x1 = 0;
    y1 = height/2;
    x2 = 0;
    y2 = height;

    for (loop = 0 ; loop < 12 ; loop += 1) {
        line(x1, y1, x2, y2);
        x1 += 0;
        y1 += height/20;
        x2 += width/20;
        y2 -= 0;
    }
    noLoop();


    //Bottom Right
    x1 = width;
    y1 = height/2;
    x2 = width;
    y2 = height;

    for (loop = 0 ; loop < 12 ; loop += 1) {
        line(x1, y1, x2, y2);
        x1 += 0;
        y1 += height/20;
        x2 -= width/20;
        y2 -= 0;
    }
    noLoop();
    
    rectMode(CENTER);
    rect(width/2, height/2, height/2, height/2);
    stroke(200);

    //Middle Box top left
    x1 = width/2 - height/4;
    y1 = 3*height/4;
    x2 = width/2 - height/4;
    y2 = height/4;

    for (loop = 0 ; loop < 21 ; loop += 1) {
        line(x1, y1, x2, y2);
        x1 += 0;
        y1 -= height/40;
        x2 += height/40;
        y2 -= 0;
    }
    noLoop();


    //Middle Box bottom right
    x1 = width/2 + height/4;
    y1 = height/4;
    x2 = width/2 + height/4;
    y2 = 3*height/4;

    for (loop = 0 ; loop < 21 ; loop += 1) {
        line(x1, y1, x2, y2);
        x1 += 0;
        y1 += height/40;
        x2 -= height/40;
        y2 -= 0;
    }
    noLoop();
    
    noStroke();
    fill(255,235,0);
    ellipse(width/2, height/2, height/7, height/7);
    //I tried to make a creepy-ish eye here
}

danakim-Project-04

sketch

//Dana Kim
//danakim@andrew.cmu.edu
//Section D
//Project-04

function setup() {
  createCanvas(400, 300);
  background(247, 196, 195);
}
function draw() {
  //midpoints of edge of canvas
  var x1 = width/2;
  var y1 = 0;
  var x2 = 0;
  var y2 = height/2;
  var x3 = width/2;
  var y3 = height;
  var x4 = width;
  var y4 = height/2;
  //outer corners
  var x5 = 0;
  var y5 = 0;
  var x6 = width;
  var y6 = 0;
  var x7 = width;
  var y7 = height;
  var x8 = 0;
  var y8 = height;

  stroke(0);
  strokeWeight(5);
  //midpoints of edges
  point(x1, y1);
  point(x2, y2);
  point(x3, y3);
  point(x4, y4);
  //outer corners
  point(x5, y5);
  point(x6, y6);
  point(x7, y7);
  point(x8, y8);

//midpoint of edge lines
  //lines from left midpoint of canvas to
  //points along the y-axis on top side of
  //canvas
  for(var i = 0; i <= 75; i+= 18.75){
    stroke(0);
    strokeWeight(1);
    line(0, height/2, width/2, i);
  }
  //lines from top midpoint of canvas to
  //points along the x-axis on left side of
  //canvas
  for(var i = 0; i <= 100; i+= 25){
    line(width/2, 0, i, height/2);
  }
  //lines from right midpoint of canvas to
  //points along the y-axis on top side of
  //canvas
  for(var i = 0; i <= 75; i+= 18.75){
    line(width, height/2, width/2, i);
  }
  //lines from top midpoint of canvas to
  //points along the x-axis on right side
  //of canvas
  for(var i = 400; i >= 300; i-= 25){
    line(width/2, 0, i, height/2);
  }
  //lines from left midpoint of canvas to
  //points along the y-axis on bottom side of
  //canvas
  for(var i = 300; i >= 225; i-= 18.75){
    line(0, height/2, width/2, i);
  }
  //lines from bottom midpoint of canvas to
  //points along the x-axis on left side of
  //canvas
  for(var i = 0; i <= 100; i+= 25){
    line(width/2, height, i, height/2);
  }
  //lines from right midpoint of canvas to
  //points along the y-axis on bottom side of
  //canvas
  for(var i = 225; i <= 300; i+= 18.75){
    line(width, height/2, width/2, i);
  }
  //lines from bottom midpoint of canvas to
  //points along the x-axis on right side
  //of canvas
  for(var i = 400; i >= 300; i-= 25){
    line(width/2, height, i, height/2);
  }

//outer corner lines
  //lines from top left corner to points
  // along top half of y-axis
  for(var i= 0; i <= 150; i += 18.75){
    stroke(0);
    strokeWeight(0.5);
    line(0, 0, width/2, i);
  }
  //lines from top left corner to points
  // along left half of x-axis
  for(var i= 0; i <= 200; i += 25){
    line(0, 0, i, height/2);
  }
  //lines from top right corner to points
  // along top half of y-axis
  for(var i= 0; i <= 150; i += 18.75){
    line(width, 0, width/2, i);
  }
  //lines from top right corner to points
  // along right half of x-axis
  for(var i= 200; i <= 400; i += 25){
    line(width, 0, i, height/2);
  }
  //lines from bottom left corner to points
  // along bottom half of y-axis
  for(var i= 150; i <= 300; i += 18.75){
    line(0, height, width/2, i);
  }
  //lines from bottom left corner to points
  // along right half of x-axis
  for(var i= 0; i <= 200; i += 25){
    line(0, height, i, height/2);
  }
  //lines from bottom right corner to points
  // along bottom half of y-axis
  for(var i= 150; i <= 300; i += 18.75){
    line(width, height, width/2, i);
  }
  //lines from top right corner to points
  // along right half of x-axis
  for(var i= 200; i <= 400; i += 25){
    line(width, height, i, height/2);
  }
}

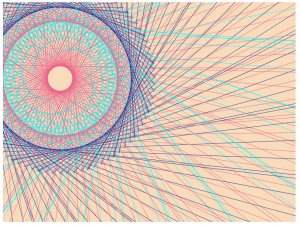
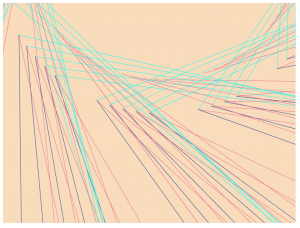
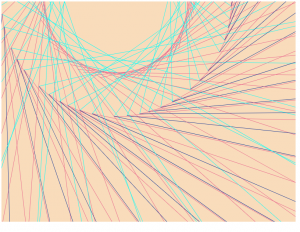
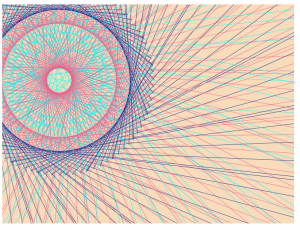
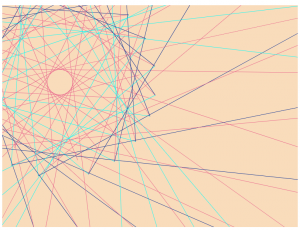
This project was one of the easier ones we’ve had so far in my opinion. I used for() loops to generate the sets of lines. I kept it fairly simple by assigning the starting points to the corners of the canvas and to the midpoints of the edges of the canvas.

ifv-Looking-Outwards-04

“Great Animal Orchestra”

by Bernie Krause and United Visual Artists.


Krause takes recorded audio of natural elements and creatures to create soundscapes that are not only interesting to listen to but are also visually compelling. Krause uses the information within the audio to generate a spectrogram which is projected on the walls of a fully immersive space. This visual component is not only meant to draw in the observer, it also teaches the visual cues of certain types of sound created by different creatures. I admire the focus Krause brings to parts of nature most people overlook, in his TedTalk regarding his work he talks about his discovery that even the smallest insects, such as ants, have their own unique soundscape. His attention to detail shows in the execution and thought behind the creation and presentation of this work.


Bernie Krause talking about his work with soundscapes in his TedTalk

ashleyc1-Section C-Project-04-String-Art

sketch

//Ashley Chan
//Section C
//ashleyc1@andrew.cmu.edu
//Project-04-String-Art


var width = 400;
var height = 300;

var x1; //x of line
var y1; //y of line
var r; //rotational angle

function setup() {

    createCanvas(400, 300);

}

function draw() {
    background(249, 220, 187);

        x1 = 0; 
        y1 = 0;
        r = atan(height, width);

   for (var i = 0; i < 1000; i += 10) { 

        strokeWeight(.5);

        translate(width/2, height/2);
        rotate(r); //rotates lines so you can see it

        stroke(233, 100, 140); //pink
        line(x1 + 50, y1, 500, 1000); 
        line(x1, y1, 0, 500); 

        stroke(11, 47, 148); //navy
        line(x1, y1, -100, 500);

        stroke(0, 255, 252); //teal
        line(x1, y1, i + 200, 500); 
    }
}


Initially, I wanted to draw concentric circles for this project because the string art examples I found reminded me of spirographs and the fun “complex” circles children often make with a special tool. But after I made the image I wanted, for funsies, I continued altering my values and ended up with happier accidents. Below are some of the images I got along the way but this final image was the one that I personally responded to the most because of how different it was from the other iterations.


juyeonk-LookingOutwards-04


Title: Ambient Synthesis

Creator: Amanda Ghassaei

Year: 2012

Link to the project: http://www.amandaghassaei.com/projects/ambient_synthesis/

Link to the bio of the artist: http://www.amandaghassaei.com/about/


Ambient Synthesis is a sound sculpture created by Amanda Ghassaei that senses the change in light stimuli in its surroundings and transforms them into sound. The program that is in charge of this transformation is called ‘Inkblot’, which uses the MaxMSP application to convert the light data into slowly evolving synthetic tones.

This sculpture was inspired by the concept of ‘additive synthesis,’ which outlines that simple sounds can be added or mixed together in order to create a broader and a more complex range of sounds.

This mechanism is best observed during sunrise and sunset where there is a drastic change in the amount of light present around the machine. When the sculpture is stimulated, one or more pixel will appear on its screen. Each pixel represents a different frequency of the harmonic series. When these pixels become activated, the tones that correspond to each pixel are added to the mixture, producing a gradually evolving soundscape over time.


mjnewman Project-04, Section A

sketch

//Meredith Newman
//Section A
//mjnewman@andrew.cmu.edu
//Project-04-LineArt

function setup() {
    createCanvas(400, 300);
    background(135, 12, 3);
}

function draw() {
	//variables used to vary spacing inbetween lines
	//for lines going from the top of canvas to right
	var x1StepSize = 10;
	var y1StepSize = 15;

	//for lines going from the right of the canvas to the bottom
	var x2StepSize = 24;
	var y2StepSize = 16;

	//for lines going from the bottom to the left of the canvas
	var x3StepSize = 22;
	var y3StepSize = 12;

	//for lines going from the left to the top
	var x4StepSize = 11;
	var y4StepSize = 12;

	for (var spacing = 0; spacing < 30; spacing ++) {
		//as mouse moves across width of canvas, grayscale changes
		stroke(map(mouseX, 0, width, 0, 255));

		//equation for lines that go from top to right of canvas
		line(x1StepSize * spacing, 0, width, y1StepSize * spacing);

		//equation for lines that go from right to the bottom
		line(width, y2StepSize * spacing, (x1StepSize * -spacing) + width / 2, height);

		//equation for lines that go from bottom to the left
		line(x3StepSize * spacing, height, 0, y3StepSize * spacing);

		//equation for lines that go from left to the top
		line(0, (y4StepSize * spacing) + width / 2, (x4StepSize * -spacing) + width, 0);
	};
}

After creating three of the “curves,” my code started to remind me of the opening credits by Saul Bass for Vertigo. So, I tried to place the fourth set of lines so that the curve echoed the eye that is synonymous with the Vertigo opening sequence. In addition, I set the background a darker red that also echoes the opening sequence. The sequence is embedded below:


aranders-project-04

aranders-project-04

//Anna Anderson
//Section D
//aranders@andrew.cmu.edu
//project-04

function setup() {
  createCanvas(400, 300);
}

function draw() {
  background(0, 0, 180);

  var xpoint;
  var ypoint;

//daisy petals

  strokeWeight(1);
  stroke(255);


//top petal
  for (var xpoint = 175; xpoint < 225; xpoint += 3) {
      line(200, 20, xpoint, 150);
  }

//top left petal
  for (var xpoint = 165; xpoint < 230; xpoint += 3.5) {
      line(100, 55, xpoint, 150);
  }

//left petal
  for (var ypoint = 125; ypoint < 175; ypoint += 3) {
      line(55, 150, xpoint - 10, ypoint);
  }

//bottom left petal
  for (var xpoint = 175; xpoint < 230; xpoint += 3.5) {
      line(100, 245, xpoint, 150);
  }

//bottom petal
  for (var xpoint = 175; xpoint < 225; xpoint += 3) {
      line(200, 280, xpoint, 150);
  }

//bottom right petal
  for (var xpoint = 175; xpoint < 230; xpoint += 3.5) {
      line(300, 245, xpoint, 150);
  }

//right petal
  for (var ypoint = 125; ypoint < 170; ypoint += 3) {
      line(340, 150, xpoint - 25, ypoint);
  }

//top right petal
  for (var xpoint = 170; xpoint < 230; xpoint += 3.5) {
      line(295, 55, xpoint, 150);
  }

//daisy center
  noStroke();
  fill(255, 255, 77);
  ellipse(200, 150, 70, 70);

}

I like how my daisy project turned out. The string idea really confused me, but eventually I got the hang of it.