jooheek – Project07 – Curves

sketch

//JooHee Kim
//Section E
//jooheek@andrew.cmu.edu
//Project-07


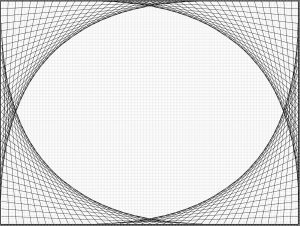
//This project is based on the epicycloid formula
//http://mathworld.wolfram.com/Epicycloid.html
function setup() {
    createCanvas(480, 480);
    angleMode(DEGREES);
}

function draw() {
	background(0,30);
	
	//moves lines to the middle of canvas
	translate(width/2, height/2);
	
	//draws 5 curve shapes in different sizes
	for (var curveSize = 0; curveSize < 10; curveSize += 2) {
		//draws lines on every angle of the curve in degrees mode
		for (var i=0; i<360; i++) {

			//variable that remaps mouseX from 0 to 12
			//represents "a" in original formula
			var M = map(mouseX, 0, width, 0, 12);

			//represents "b" in original formula
			var b = 5;

			//variables of line coordinates drawn according to the epicycloid curve formula
			//substitutes with M so that the size and number of petals change according to mouseX
			var lineX1 = curveSize*((M+b)*cos(i-100) - b*cos(((M+b)/b)*i-100));
			var lineY1 = curveSize*((M+b)*sin(i-100) - b*sin(((M+b)/b)*i-100));
			var lineX2 = curveSize*((M+b)*cos(i) - b*cos(((M+b)/b)*i));
			var lineY2 = curveSize*((M+b)*sin(i) - b*sin(((M+b)/b)*i));

			//draw line with variables
			stroke(i, 210, 210, curveSize);
			line(lineX1, lineY1, lineX2, lineY2);
		}
	}

}

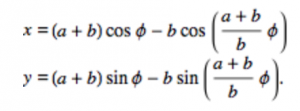
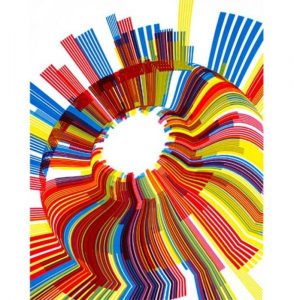
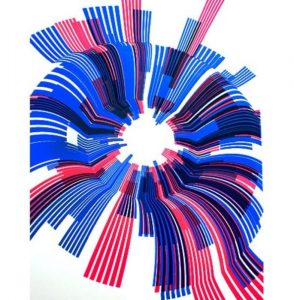
After looking at the types of curves that were given to us, I decided to choose the epicycloid. It uses a parametric equation:


I first tried to figure out how the graph works in coding, and after trying out many options I liked using lines with graph formula. Although I thought this project was simpler than other projects, I found it fun using curve formulas to represent curves in different ways. I first started out with one curve shape but found that putting it in a for loop that varies in sizes makes it more interesting. I also had fun playing with the opacity in both the background and lines.

Before I put it in a for loop and put opacity in it

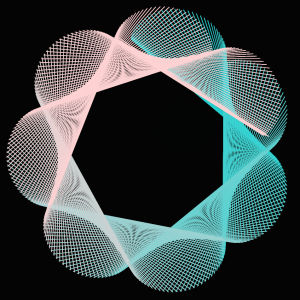
*There are more curves when looked on the browser than when looked in this WordPress blog.

LookingOutwards07 – jooheek

The Rhythm of Food: Moritz Stefaner

This collaboration with Google News Lab called “The Rhythm of Food” by Moritz Stefaner tries to visualize seasonal patterns in food searches based on twelve years of Google search data related to food. It compares seasons, the year, and the relative search interest of the particular type of food. This is done by representing the seasons on the outer most circle, the colors as the year, and the distance from the center of the circle as the relative search interests.

I find it interesting how this data visualization compares multiple variables that you would never think of comparing. Who knew that there would be a correlation between food searches and the type of year? The way the data is visualized also helps people see that correlation in a way that makes sense. I appreciate how they created their own system or in a sense, computation, to demonstrate data visualization.

They also made an animation making it easier to see the visualization.

Rhythm of Food – flying charts from Moritz Stefaner on Vimeo.

LookingOutwards06-jooheek

Marius Watz: Random Numbers

Link: https://creators.vice.com/en_us/article/vvzxkb/random-numbers-screen-printed-generative-art-nyc-event

Marius Watz “Arcs04-01” from the series Random Numbers Multiples

In the project, Random Numbers, Marius Wats, a generative artist, collaborates with Jer Thorp to create a series of visualizations that demonstrates data of random numbers. They described that their project is about “pseudo-random compositions of radial shapes, subtly distorted by a 3D surface that lends the image a strong focal point and sense of movement.”

Marius Watz “Arc04-00” from the series Random Numbers Multiples

I think that the randomness of this artwork really adds to the aesthetic of the piece. The artist combines two factors that are usually not juxtaposed together: randomness and data. Data is something that is really not random but by adding randomness to it, the artist demonstrates an aesthetic for the visualization.

jooheek-Project06-AbstractClock

Blender making peach and lemon smoothie

sketch

//JooHee Kim
//jooheek@andrew.cmu.edu
//Section E
//Project06

function setup() {
    createCanvas(480, 480);
    angleMode(DEGREES);
	ellipseMode(CENTER);
    rectMode(CENTER);
}

function draw() {
	//variables for each seconds, minutes, and hours
	var S = second();
    var M = minute();
    var H = hour();

	background(245, 245, 220);

	//start of graphics for blender background
	//blender handle
	fill(200, 200, 200);
	noStroke();
	rect(20, height/2, 40, 40);

	//whole blender
	fill(240, 240, 240, 140);
	stroke(200, 200, 200);
	strokeWeight(10);
	rect(width/2, height/2, 400, 400, 100);

	//blender base
	fill(220, 220, 220);
	noStroke();
	rect(width/2, height/2, 150, 150, 50);

	//blender center circle piece
	fill(200, 200, 200);
	stroke(180, 180, 180);
	strokeWeight(5);
	ellipse(width/2, height/2, 50, 50)

	//blender knife star
	beginShape();
	vertex (width/2, height/2 - 30);
	vertex (width/2 + 10, height/2 - 10);
	vertex (width/2 + 30, height/2);
	vertex (width/2 + 10, height/2 + 10);
	vertex (width/2, height/2 + 30);
	vertex (width/2 - 10, height/2 + 10);
	vertex (width/2 - 30, height/2);
	vertex (width/2 - 10, height/2 - 10);
	vertex (width/2, height/2 - 30);
	endShape();

	//measurement marks at side of blender
	noStroke();
	var x = width/2 + 100;
	for (var i = 1; i <= 6; i += 1) {
		rect(x, height/2, 3, 10*i);
		x += 20;
	}
	//center line going through measurement marks
	stroke(200, 200, 200);
	strokeWeight(3);
	line(width/2 + 100, height/2, width/2 + 180, height/2);

	//HOURS
	//changing from 24 hour to 12 hour clock
	var H = hour()%12;
	if (H == 0) {
		H = 12;
	}

	//making pink transparent juice get larger proportionate to the hour
	noStroke();
	fill(255, 180, 160, 125);
	rect(width/2, height/2, 33*H, 33*H, 50 + H);

	//SECONDS
	//rotates 4 peaches in the middle by seconds
	push();
	translate(width/2, height/2);
	rotate(6*S);
		for (peachY = -40; peachY <= 40; peachY += 80) {
			for (peachX = -40; peachX <= 40; peachX += 80) {
				fill(245, 142, 80);
				ellipse(peachX + 10, peachY, 70, 70);

				fill(245, 162, 100);
				ellipse(peachX, peachY, 70, 70);

				fill(64, 183, 75);
				ellipse(peachX + 10, peachY - 35, 10, 5);

				fill(245, 182, 120);
				ellipse(peachX + 15, peachY - 15, 15, 15);
			}
		}
	pop();

	//MINUTES
	//rotates 2 lemons by minutes
	var Mmap = map(M, 0, 60, 0, 360);

	push();
	translate(width/2, height/2);
	rotate(Mmap);
	for (lemonX = -125; lemonX <= 125; lemonX += 250) {
			fill(240, 229, 90);
			ellipse(lemonX + 55, 0, 20, 15);

			fill(240, 229, 90);
			ellipse(lemonX - 55, 0, 20, 15);

			fill(250, 239, 100);
			ellipse(lemonX, 0, 110, 90);

			fill(255, 249, 120);
			ellipse(lemonX + 20, - 20, 30, 20);
	}
	pop();

}

I got inspiration from my previous project and decided that I wanted to do something fruit related again. To show time, I wanted to have things rotate according to the hours, minutes, and seconds. When thinking of fruits and rotation, I thought of fruits in a blender. Therefore, I chose the peach and lemon and made the peach go according to the seconds and the lemon according to the minutes. After thinking about what to do for the hour, I figured out I could make the juice that the peach and lemon make rise according to the hours.

LookingOutwards05-jooheek

Creative Miniworld: By Jan Reeh

This is a 3D art piece made by 3D artist Jan Reeh through a computer graphics program. I was very impressed by how much detail the artist portrays in his artwork. No matter how much you zoom, you can see every detail, and the artwork looks so alive. It’s impressive how through computer graphics, you can get art that could look so real and like a photograph. Through computer graphics, you can more detail than you can ever get by drawing or making by hand.

3D template that is later overlayed

Jan Reeh also shows in a video about this project how he made a 3D template first and overlayed color and visuals over that 3D template, just like how when you physically sculpt something, you make the scaffold first and then overlay color, texture, etc. This made me realize how art does not always have to be about physical making but it can also be made through technology and computers, although the process is the same.

Detailed shot 1
Detailed shot 2

jooheek-Project05-Wallpaper

sketch

function setup() {
    createCanvas(450, 450);
    ellipseMode(CENTER);
    angleMode(DEGREES);
}

function draw() {
	background(255, 227, 238);

	noStroke();

	//orange position variables
	var orangeX = 0;
	var orangeY = 50;

	//start of loops for oranges
	for (orangeY = 0; orangeY < 500; orangeY += 115) {
		for (orangeX = 0; orangeX < 500; orangeX += 115) {

			//shadow of oranges
			fill(191, 128, 153);
			ellipse(orangeX + 5, orangeY + 5, 70, 70);

			//if-else that makes orange slices at every even increment
			//and whole oranges at every odd increment
			if ((orangeX+1)%2 == 0) {

				//outer orange peel circle
				fill(249, 201, 65);
				ellipse(orangeX, orangeY, 70, 70);

				//inner lighter orange peel circle
				fill(249, 234, 175);
				ellipse(orangeX, orangeY, 60, 60);

				//inner orange slice sections
				fill(249, 201, 65);
				arc(orangeX, orangeY, 50, 50, 7, 72);

				fill(249, 201, 65);
				arc(orangeX, orangeY, 50, 50, 79, 144);

				fill(249, 201, 65);
				arc(orangeX, orangeY, 50, 50, 151, 216);

				fill(249, 201, 65);
				arc(orangeX, orangeY, 50, 50, 223, 288);

				fill(249, 201, 65);
				arc(orangeX, orangeY, 50, 50, 295, 360);

			} else {

				//whole orange peel
				fill(249, 201, 65);
				ellipse(orangeX, orangeY, 70, 70);

				//orange shine circles
				fill(249, 225, 130);
				ellipse(orangeX + 23, orangeY - 10, 10, 10);

				fill(249, 225, 130);
				ellipse(orangeX + 15, orangeY - 20, 5, 5);

				//orange leaf
				fill(99, 187, 83);
				ellipse(orangeX - 10, orangeY - 35, 15, 8);
			}
		}
	}

//cherry variable positions set to be in middle of each orange increment
	var cherryX = 57;
	var cherryY = 57;

	//start of for loops for cherries
	//same increment but starts at the middle of orange increment
	for (cherryY = 57; cherryY < 500; cherryY += 115) {
		for (cherryX = 57; cherryX < 500; cherryX += 115) {
			//stem shadows
			stroke(211, 148, 173);
			strokeWeight(3);
			noFill();
			//right stem shadow
			arc(cherryX + 18, cherryY + 8, 60, 60, 180, 250);
			//left stem shadow
			arc(cherryX + 38, cherryY - 22, 70, 70, 123, 170);

			//stems
			//right stem
			stroke(99, 187, 83);
			arc(cherryX + 15, cherryY + 5, 60, 60, 180, 250);
			//left stem
			arc(cherryX + 35, cherryY - 25, 70, 70, 123, 170);

			//leaf shadow
			noStroke();
			fill(211, 148, 173);
			ellipse(cherryX + 13, cherryY - 18, 20, 10);
			//leaf
			fill(99, 187, 83);
			ellipse(cherryX + 10, cherryY - 21, 20, 10);

			//cherries
			//right cherry shadow
			fill(211, 148, 173);
			ellipse(cherryX + 18, cherryY + 18, 20, 20);
			//left cherry shadow
			fill(211, 148, 173);
			ellipse(cherryX -12, cherryY + 18, 20, 20);
			//right cherry
			fill(239, 58, 71);
			ellipse(cherryX + 15, cherryY + 15, 20, 20);
			//left cherry
			fill(239, 58, 71);
			ellipse(cherryX - 15, cherryY + 15, 20, 20);
			//left cherry shine
			fill(249, 125, 135);
			ellipse(cherryX + 18, cherryY + 10, 5, 5);
			//right cherry shine
			fill(249, 125, 135);
			ellipse(cherryX - 12, cherryY + 10, 5, 5);
		}
	}

}

I started by looking at inspiration from the Internet and found cute fruit wallpapers that I really liked, so I decided to do some kind of wallpaper with oranges. But, I realized that just oranges seemed too bland and wanted to add some other fruit that would compliment it, so I chose the cherry. I also wanted to have some kind of element alternate, so I made the whole orange and sliced orange alternate.

LookingOutwards04-jooheek

The Creatures of Prometheus – Generative visualisation of Beethoven’s ballet with Houdini

By: Simon Russell

The visual outcome the algorithm creates

This project shows the relationship between audio and visuals through computation. Specifically, it creates visuals for a Beethoven ballet. Through an algorithm, it detects the pitch and amplitude of the music and makes different shapes and colors for different musical notes. It also detects how high or low the note is compared to the previous note, and uses this to determine how high the shapes are in the composition.

I found this project interesting because it shows how computation can create a connection between audio and visuals, which creates both music and visual art at the same time. It shows that music doesn’t always have to be heard and art doesn’t always have to be seen.

The screenshots of the program at work.
Program at work

However, what’s interesting is that he did not get the algorithm perfectly. The first four bars of the computation is incorrect, but he states he just wanted to get it finished and out rather than being perfect. He states, “It was quite a fun one because I plugged in the data, hit render and then didn’t really know what would come out. Usually I’d hand animate every last detail but this one is essentially generative.” It’s fun to know that this project was just a fun experiment of someone rather than an actual serious project.

Site: http://www.creativeapplications.net/sound/the-creatures-of-prometheus-generative-visualisation-of-beethovens-ballet-with-houdini/

jooheek -Project04-StringArt

sketch

//JooHee Kim
//Section E
//jooheek@andrew.cmu.edu
//Project-04

function setup() {
    createCanvas(400, 300);
}

function draw() {
	background(0);

	//color variables so that it can change to mouseX & Y
	var sRColor = mouseX;
	var sGColor = mouseY;
	var sBColor = 255;

	//x1,y1 is for the left 2 curves when mouse is at 0, 300
	var x1StepSize = 30;
	var y1StepSize = 20;
	
	//x2, y2 for stationary right 2 curves when mouse is at 0, 300
	var x2StepSize = 15;
	var y2StepSize = 25;

	//x&y position is the same for both curves
	var xposition = mouseX;
	var yposition = mouseY;

    for (var i = 0; i <= 30; i ++) {
    	//variables that constrain x1&y1 position to canvas size
    	var cx = constrain(xposition, 0, 400);
    	var cy = constrain(yposition, 0, 300);

    	strokeWeight(0.75);
    	stroke(sRColor, sGColor, sBColor);

    	//curve at top left corner when mouse is at 0, 300
    	//i*4/3 because height and width of canvas is different
    	line(cx, y1StepSize*i, x1StepSize*i*4/3, cy);

    	//curve at bottom left corner when mouse is at 0, 300
    	line(cx, height - y1StepSize*i, x1StepSize*i*4/3, height - cy);

    	//curve at top right corner when mouse is at 0, 300
    	stroke(sRColor - 100, sGColor - 100, sBColor-100);
    	line(x2StepSize*i*4/3, height - cy, width - cx, y2StepSize*i/2);

    	//curve at bottom right corner when mouse is at 0, 300
    	line(x2StepSize*i*4/3, cy, width - cx, height - y2StepSize*i/2);

    }


}

I started by creating a simple composition on Illustrator just to understand how the coordinates work in string art curves. From there, I decided on the intervals of the lines to have some variation in the curves. I also wanted it to make it interactive with the mouse, so I made x&y positions and the color of the lines to be dependent of the lines. Although the code for this project was fairly short and simple, I thought it was pretty complicated when I was trying to understand the concept.


Initial sketch on Illustrator

LookingOutwards03-jooheek

Silk Pavillion

Site: https://www.media.mit.edu/projects/silk-pavilion/overview/


This project is part of Mediated Matter of the MIT Media Lab. It exploresthe interaction between digital fabrication and natural fabrication by mimicing the silk thread structure of a silkworm’scocoon through a Computer-Numerically Controlled (CNC) machine and then having silkworms create their own silk structures from that primary, fabricated structure. Inspired by how silkworms can create their silk structure through one continuous

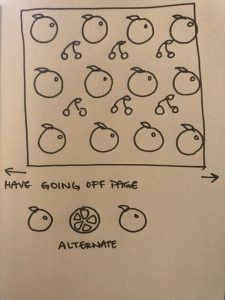
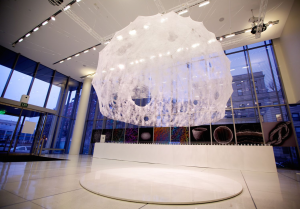
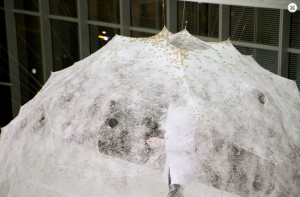
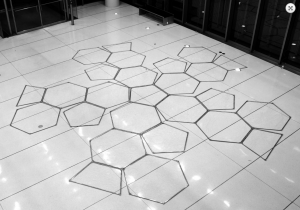
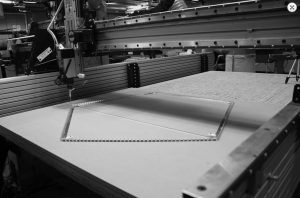
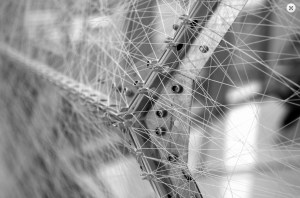
line of thread, an algorithm was created to mimic the single continuous style of the natural silkworm pattern and the variation of density of the fabricated threads. 26 panels of this silk scaffold was made and put together to make a dome. Then, silkworms were put into the dome structure to fill in the gaps with their own biological silk structures.

What admired me the most about this project was how mechanically fabricated structures can work alongside biologically, naturally created structures. It demonstrates how mechanic and natural physical worlds can work together to create beautiful outcomes. Another interesting aspect about this project was how because these two drastically different worlds worked together, they created a beautiful, artistic outcome. By generating an algorithm, scientists were able to mimic the natural world.

jooheek-Project03-DynamicDrawing

sketch

//Joo Hee Kim
//Section E
//jooheek@andrew.cmu.edu
//Project-03

var faceW = 300;
var faceH = 300;
var eyeW = 50;
var eyeH = 50;
var pupilW = 20;
var pupilH = 20;
var mouthW = 40;
var mouthH = 20;
var candyW = 70;
var candyH = 50;
var r = 255;
var g = 100;
var b = 171;

function setup() {
    createCanvas(640, 480);
}

function draw() {
	background(55, 55, 175);
	noStroke();

	var mouthX = width/2;
	var mouthY = height/2 + faceH/4;
	
	//face
	fill(249, 225, 197);
	ellipse(width/2, height/2, faceW, faceH);

	//eye-white
	fill(255);
	ellipse(width/2 - faceW/4, height/2, eyeW, eyeH);

	fill(255);
	ellipse(width/2 + faceW/4, height/2, eyeW, eyeH);

	//mouth
	fill(204, 64, 64);
	ellipse(width/2, height/2 + faceH/4, mouthW, mouthH);

	//pupil-left
	push();
	translate(width/2 - faceW/4, height/2);//make point of rotation the middle of eye
	rotate(mouseX/100);
	fill(0);
	ellipse(10, 10, pupilW, pupilH);
	pop();

	//pupil-right
	push();
	translate(width/2 + faceW/4, height/2);
	rotate(mouseX/100);
	fill(0);
	ellipse(10, 10, pupilW, pupilH);
	pop();

	//candy
	fill(r, g, b);
	ellipse(mouseX, mouseY, 70, 50);

	fill(r, g, b);
	triangle(mouseX, mouseY, mouseX - 40, mouseY + 40, mouseX - 40, mouseY -40);

	fill(r, g, b);
	triangle(mouseX, mouseY, mouseX + 40, mouseY -40, mouseX + 40, mouseY + 40);


	//mouth gets bigger & color gets random as candy gets closer to the face
	if (mouseX > width/2-faceW/2 & mouseX < width/2+faceW/2 && mouseY > height/2 - faceH/2 && mouseY < height/2 + faceH/2) {
		mouthW = mouthW+1;
		mouthH = mouthH+1;
		r = random(0, 255);
		g = random(0, 255);
		b = random(0, 255);
	}

	//mouth resets when it reaches certain size
	if (mouthW > 200 & mouthH > 100) {
		mouthW = 40;
		mouthH = 20;
	}

	if (dist(mouseX, mouseY, width/2, height/2 + faceH/4) < 50) {
		faceW = 450;
		faceH = 450;
		eyeW = 100;
		eyeH = 100;
		pupilW = 50;
		pupilH = 50;
		mouthW = 200;
		mouthH = 100;
	}

	if (dist(mouseX, mouseY, width/2, height/2) > 225) {
		faceW = 300;
		faceH = 300;
		eyeW = 50;
		eyeH = 50;
		pupilW = 20;
		pupilH = 20;
		mouthW = 40;
		mouthH = 20;

	}
	
}

For this assignment, I started with the concept of a guy desperate for a piece of candy. Then, I worked out how to include interactive properties that were associated with mouseX and mouseY.