mjeong1-Project-07-Curves

sketch

//Min Young Jeong
//15-104 Section A
//mjeong1@andrew.cmu.edu
//Project-07

function setup() {
    createCanvas(480, 480);
}

function draw() {
    var r = mouseX * 0.25;//creating r,g,b values to color strokes based on position of mouse on canvas
    var g = mouseY;
    var b = 255;
    noFill();
    background(0);


    push();
    stroke(r, g, b);
    strokeWeight(0.5);
    translate(width/2,height/2);
    drawmodifiedhypotrochoid();
    pop();
    //first geomety, modified hypotrochoid(middle one)
 
   push();
    stroke(g,r,b);
    strokeWeight(0.5);
    translate(width/2-100,height/2);
    drawmodifiedhypotrochoid2(300,300);
    pop();
    //secon geometry,modified hypotrochoid(left one)

   push();
    stroke(b,g,r);
    strokeWeight(0.5);
    translate(width/2+100,height/2);
    drawmodifiedhypotrochoid3(300,300);
    pop();
    //thrid geometry, modified hypotrochoid(right one)

}

function drawmodifiedhypotrochoid() {
    var x;
    var y;
    var x1 = map(mouseX, 0, width, 0, 100);
    var y2 = map(mouseY, 0, height, 0, 150);
    beginShape();
      for(var i = 0; i <50; i ++) {
        var angle = map(i, 0, 50, 0, 360);
        x = (x1 - y2) * cos(angle) - y2 * cos(((x1 - y2)) * angle);
        y = (x1 + y2) * sin(angle) - y2 * sin(((x1 - y2)) * angle);
        vertex(x, y);
    endShape();
      }
}
//first modified hypotrochoid that represents nose of the face

function drawmodifiedhypotrochoid2() {
    var x;
    var y;
    var x1 = map(mouseX, 0, width, 0, 100);
    var y2 = map(mouseY, 0, height, 0, 150);
    beginShape();
      for(var i = 0; i <100; i ++) {
        var angle = map(i, 0, 50, 0, 360);
        x = (x1 - y2) * cos(angle) - y2 * cos(((x1 - y2)) * angle);
        y = (x1 - y2) * sin(angle) - y2 * sin(((x1 - y2)) * angle);
        vertex(x, y);
    endShape();
      }
}
//second geometry that represents left eye of the face

function drawmodifiedhypotrochoid3() {
    var x;
    var y;
    var x1 = map(mouseX, 0, width, 0, 100);
    var y2 = map(mouseY, 0, height, 0, 150);
    beginShape();
      for(var i = 0; i <200; i ++) {
        var angle = map(i, 0, 50, 0, 360);
        x = (x1 - y2) * cos(angle) - y2 * cos(((x1 - y2)) * angle);
        y = (x1 - y2) * sin(angle) - y2 * sin(((x1 - y2)) * angle);
        vertex(x, y);
    endShape();
      }
}
//third geometry that represents right eye of the face

//http://mathworld.wolfram.com/Hypotrochoid.html

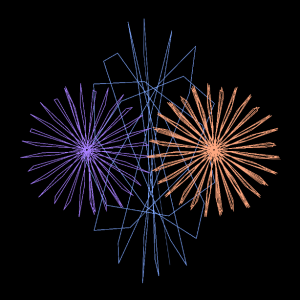
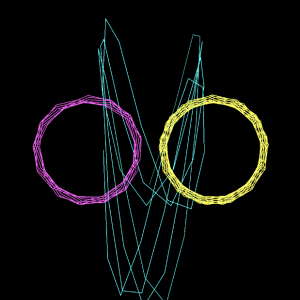
For this assignment, I initially started with a hypotrochoid with varying color based on position of mouse. And I moved on to three modifications of the hypotrochoid to see how the geometry can be different based on different input values. I played with changing y values which created elongated geometry and also with varying number x values in order to change the number of strokes.
 

mjeong1-Looking Outwards-07-sectionA

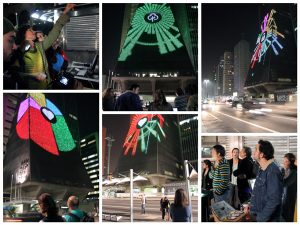
“Smart Citizen Sentiment Dashboard Sao Paulo” by  Moritz Behrens. The installation is displayed on the media façade of the Galeria de Arte Digital.

Citizen Feedback to Visual Language

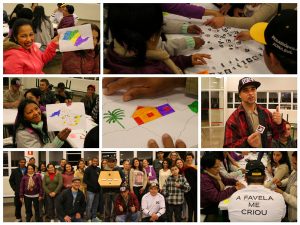
The project called Smart Citizen Sentiment Dashboard (SCSD) is an interactive media installation that translate set of data from the citizens into visual language. The screen is divided into three low resolution LED façades which are connected to the main computer through VGA connection. Data sets are collected through a number of workshops in which the artists invited citizens from Sao Paulo with different social and economic background.

The visualization of the data set is generated through RFID technology, facilitating on the ubiquitous Bilhete Unico travel card. The purpose of this project was to utilize this smart technology not only for travel purpose and allow citizens to express their opinion in the technology mediated urban realm.

Moritz Behrens succeeded not only in effectively translating the collected data into visual language but also in chose what kind of data they wanted to translate. Their decision to hear opinions from citizens deserves admiration since they newly opened a window for Sao Paulo’s citizens to have chance to express their feelings to public.


Link to Moritz Behrens

mjeong1-LookingOutwards-06-sectionA

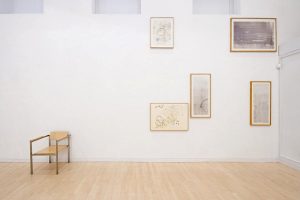
Exhibition in Kettle’s Yard gallery in Cambridge by John Cage
Computer-generated Random Numbers Determined Media, Composition and Color of the Art Work

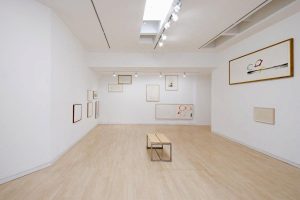
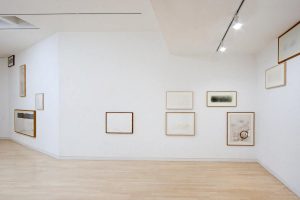
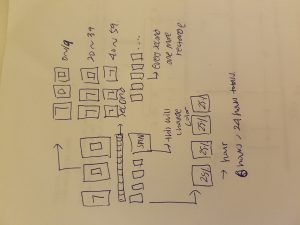
John Cage is known for the use of randomness in his art. In his art works in The Kettles Yard exhibition, Cage used computer generated random numbers to determine which row of stones, which brush to use, and the position of the stone on the paper. After generating such randomness, he finally paints around the stone. He also uses randomness in the form of exhibition, using computer generated-coordinates to determine the heights and positions of the pictures. Even during the exhibition, art pieces are removed and added through the random process.

I think his approach to randomness is remarkable because unlike Jackson Pollock, who used randomness as a controlled expression, Cage completely sacrificed his control to use chance operation. Art has been considered as a form of expressed feelings. However, Cage in Kettles Yard completely challenged this notion of traditional art and enlighten public with the beauty of randomness.

link to Kettle’s Yard

mjeong1-06-Abstract-Clock-SectionA

sketch

//Min Young Jeong
//mjeong1@andrew.cmu.edu
//Project-06
//section A

function setup() {
    createCanvas(500,500);//create canvas 500X500 
}

function draw() {
    background(51,51,51);

    var h = hour(); 
    var m = minute(); 
    var s = second(); 
    //setting up variables for the time
    var mappedh= map(h,0,24,0,4);
    //divide 24 hours into 4 so that later I can create 4 rectangles that represents hours 
    //each rectangle will represent 6 hours

    stroke(203,203,203);
    strokeWeight(5);
    fill(33,33,33);
    quad(20,330,480,330,460,490,40,490);
    stroke(0);
    //initial back ground which is the machine 

    for(var i = 0; i<mappedh; i++){
        fill(255,100,100);
        noStroke();
        rect(i*70+35,370,60,60,20);
        fill(0);
        noStroke();
        textSize(20);
        text("25%",i * 70+45,405);
    }
    //hour each pink rectancle represents 6 hours so that 4 rectangles as totall will have 100% which is 24 hours

    if(m%2 ==0){
        fill(255,50,50);
        rect(350,370,80,80,15);
    }
    else{
        fill(7,196,7);
        rect(350,370,80,80,15);
    }
    //min 
    //spin button will change the color, green to red, red to green. 
    //color change happens every minute
    fill(0);
    strokeWeight(2);
    textSize(25);
    text("SPIN",360,415);
    noStroke();
    fill(162,162,162);
    rect(0,0,500,350);
    fill(68,62,64);
    quad(10,10,490,10,470,30,30,30);
    fill(102,102,102);
    quad(10,10,30,30,30,320,10,340);
    fill(221,221,221);
    quad(10,340,30,320,470,320,490,340);
    fill(124,122,116);
    quad(490,340,470,320,470,30,490,10);
    fill(0);
    rect(30,30,440,290);
    //background of slot machine
    //grey picture frame

    for(var i = 0; i<3; i++){
        fill(255);
        stroke(180);
        strokeWeight(3);
        rect(i*150+35,50,130,200);
        //three white background for three screens
        //use for loop create three rectangles using on rect command
        if(m<20){
            fill(255,50,50);
            stroke(0);
            textSize(180);
            text("7",150*(i-2)+50,210);
            fill(200);
            rect(350,100,100,100);
            rect(200,100,100,100);
        }
        //if we have min 0 to 19(for example 06:15am or pm), then we have one 7 and two rectangles
        //on the screen
        if (m>=20 & m<40){
            fill(255,50,50);
            stroke(0);
            textSize(180);
            text("7",150*(i-1)+50,210);
            fill(200);
            rect(350,100,100,100);
        //if the minute is 20 to 39, then it has two 7s and one rectangle 

        }
        if (m>=40 & m<60){
            fill(255,50,50);
            stroke(0);
            textSize(180);
            text("7",150*i+50,210);
        }
        //if the minute is 40 to 59, then we have three 7s

        if (m<60 & m>50){
            fill(255,50,50);
            stroke(0);
            textSize(180);
            text("7",150*i+50+random(1,5),210);
        }
        //from 50 min to 60 min, 7s are shaking
    }

    for(var i = 0; i<s; i++){
        fill(255,50,50);
        stroke(255);
        strokeWeight(2);
        rect(i*7+35,290,7,20);
    }
    //number of red rectanlges that represent the secs

    if(m==0){
        textSize(50);
        text("JACKPOT",50,480);
    }
    //each o'clock will have jackpot, ex)3 o'clock, 4 o'clock

}


For this assignment I created slot machine that represents abstract clock. Every second, the number of red rectangles under the slot machine screes will increase. Every other minute, the color of button will change its color. And every 20 min you get “7” on your screen which increases its number at 20 min, 40min, and 60min. As the number of the “7” will increase and when it reaches three “7”s, then you will get “jackpot”

mjeong1-05-Wallpaper-SectionA

sketch

//Min Young Jeong
//Section A 9:30am
//mjeong1@andrew.cmu.edu
//Project-05

function setup() {
    createCanvas(500, 500);
    noLoop();
    
}

function draw() {
    background(254,218,0);
    noStroke();

    for (var x = 0; x <= 500; x += 50){
    	for (var y=0;y<=500;y+=50){
    	fill(0);
    	ellipse(x,y,2,4);
    	}
    }
    //yellow background with black seed grid (spacing 50,50)

    for (var x = 0; x < 500; x += 200){
        for (var y = 0; y< 500; y+= 100){
            push();
            translate(x,y);
            drawTile();
            pop();

        }
    }

    //half watermellon concave spacing 200
    
    for (var x = 100; x < 500; x += 200){
        for (var y = 0; y< 500; y+= 100){
            push();
            translate(x,y);
            drawTile2();
            pop();

        }
    }
    //eaten half watermellon convex spacing 200
}

function drawTile(){
	fill(2,130,115)
	arc(50,50,70,70,0,PI,CHORD);
	fill(255);
	arc(50,50,60,60,0,PI,CHORD);
	fill(255,64,108);
	arc(50,50,50,50,0,PI,CHORD);
	fill(0);
	ellipse(60,60,3,6);
	ellipse(40,65,3,6);
	ellipse(45,55,3,6);    
}
//half watermellon tile

function drawTile2(){
	fill(2,130,115)
	arc(50,70,70,70,PI,0,CHORD);
	fill(255);
	arc(50,70,60,60,PI,0,CHORD);
	fill(255,64,108);
	arc(50,70,50,50,PI,0,CHORD);
	fill(0);
	ellipse(60,65,3,6);
	ellipse(40,55,3,6);
	ellipse(45,65,3,6);  
	fill(254,218,0);
	ellipse(65,70,20,20);
	ellipse(55,70,15,15);
}
//helf watermeelon with bite tile


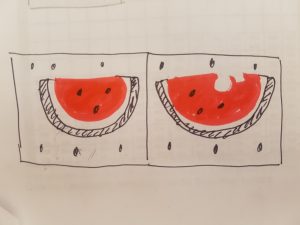
For this project, I started with two different types of tile, one with half watermelon and the other with eaten watermelon.  And I created pattern with two tiles with yellow background with seed pattern.

mjeong1-Looking Outwards-05-SectionA

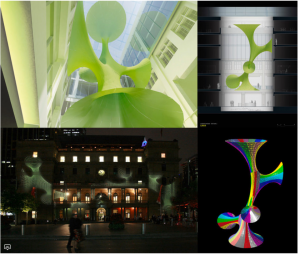
Green Void / LAVA

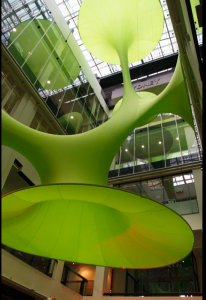
“Green Void” by Architect LAVA in Sydney,Austrailia
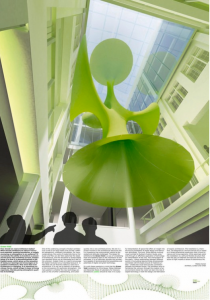
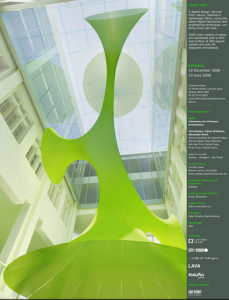
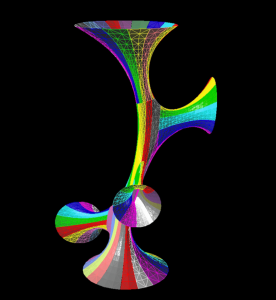
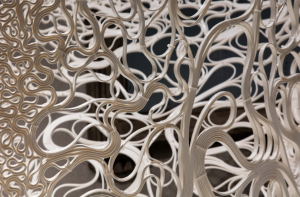
The installation Green Void is a digitally patterned product which is located in the main interior atrium of the Customs House. The design process started with 3D computer modelling, and fabricated under a process of computer controlled(CNC) material cutting. The computer model is exclusively based on the simulation of  complex evolving system using certain geometric algorithm, which feeds directly into a production through manufacturing. The design shows a new way of digital workflow by enabling shape of the product to be generated through computational workflow in a extremely shot time.

What I admire about this project is how rendered 3D graphic image looks similar to final installation and how the 3d image can inform people about the final work even before the fabrication. It might be impossible to have this indirect experience of the space without the computer generated image. Especially in the field of architecture, design through computer graphic can be a core of design process since it is much easier to explain your project through visual representation and also you can have feedback in a relatively short time.


link to original

mjeong1-Looking Outwards-04-SectionA

Nature and Humans Harmonize in a Symphony of Architectural Sound

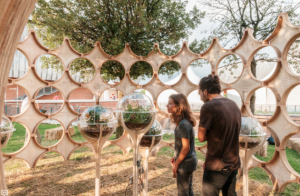
Wunderbugs by OFL Architecture in Rome, Italy

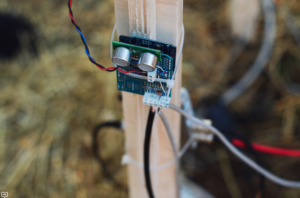
Wunderbug is a installation that explored connection between human and nature. The pavilion has 6 plastic spheres inside of circular wall. Each sphere contains small terrarium and insects. The pavilion is equipped with a series of Arduino sensors to detect motion of insects as well as weather data, which is programmed to record changes and produce a soundtrack of data. I think the way OFL Architecture approaches to nature is interesting because they focused on acoustic quality of nature and how the sound is not only interactive with humans but also with the insects, the nature. I admire how they closely looked into motion of each insect and how they produce tactile experience  for humans not only through visual installation but also through sound effect. It would be a valuable lesson that the nature is not just a beautiful picture frame that people just look at, but it has life and constantly produce small changes even though changes are too subtle to notice.

I think it could be more intersecting to see visual changes of the pavilion based on those data. Perhaps, the facade of the pavilion could be interactive according to the insect motion data. On the other side, the visual quality of the pavilion could be related to sound that is being generated.

Link to archdaily

mjeong1-Project-04-String-Art-SectionA

sketch

//Min Young Jeong
//Section A 9:30am
//mjeong1@andrew.cmu.edu
//Project-04

function setup() {
    createCanvas(400,300);
}
function draw() {
    background(225);
    strokeWeight(0.3);
    var r = mouseX; //controls r vallue of color based on mouseX
    var g = mouseY; //controls g vallue of color based on mouseY
    for (i = 0; i < 100; i++) {
        var x1 = 0;
        var x2 = i * mouseX/40;
        //x2 incrementally increases based on mouseX
        var y1 = i * mouseY/30;
        //y1 incrementally increases based on mouseY
        var y2 = height;
    stroke(r,g,100);
    line(x1,y1,x2,y2); //lower left 
    line(width-x1,height-y1,width-x2,height-y2);//upper right
    line(width-x1,height-y1,x2,y2); //lower right
    line(x1,0,x2,height);//left "right triangle" geometry
    line(width-x1,height,width-x2,0);//right "right triangle" geometry

    }
}

For this assignment, I drew inspiration from wave. I created  five different geometry using strings and made them intersection at some point to give some characteristic of the wave. Also, I wanted to create an interactive string art. Position of mouse controls distance and color of the strings.

mjeong1-Project-03-Dynamic Drawing-Section A

sketch

//Min Young Jeong
//Section A 9:30am
//mjeong1@andrew.cmu.edu
//Project-03
var a;
var x = 400;
var y = 400;
var cloud = 100;
var dir = 1;
var dir2 =1;
var speed = 4;
var speed2 = 1;
var diam = 50;

function setup() {
    createCanvas(640, 480);
}
 
function draw() {
    background(168,204,239);
    //sunny background
    if (dist(mouseX,mouseY,width/2,height/2)<=100) {
        background(124,146,181);
    }
    //cloudy background
    noStroke();
    fill(150,234,148);
    rect(0,390,640,height - 350);
    //sunny ground
    if (dist(mouseX,mouseY,width/2,height/2)<=100) {
        fill(107,145,106);
        rect(0,390,640,height - 350);
    }
    //cloudy ground


    fill(206,166,124);
    strokeWeight(1);
    stroke(255);
    rect(width/2 - 4,height/2 - 4,8,200);
    stroke(255);
    //1st windmill stick


    push();
    translate(width/2,height/2);
    var a = atan2(mouseY-height/2,mouseX-width/2);
    rotate(a);
    if (dist(mouseX,mouseY,width/2,height/2)<=100) {
        fill(255,105,113);
    }
    else {fill(100);}
    triangle(-50,-50,0,-50,0,0);
    triangle(-50,-50,-100,0,0,0);
    if (dist(mouseX,mouseY,width/2,height/2)<=100) {
        fill(118,135,255);
    }
    else {fill(100);}
    triangle(0,0,0,-100,50,-50);
    triangle(0,0,50,-50,50,0);
    if (dist(mouseX,mouseY,width/2,height/2)<=100) {
        fill(118,255,118);
    }
    else {fill(100);}
    triangle(0,0,100,0,50,50);
    triangle(0,0,50,50,0,50);
    if (dist(mouseX,mouseY,width/2,height/2)<=100) {
        fill(255,242,118);
    }
    else {fill(100);}
    triangle(0,0,0,100,-50,50);
    triangle(0,0,-50,50,-50,0);
    pop();

    fill(0);
    ellipse(width/2,height/2,10,10);
    //center windmill clockwise


    push();
    translate(width/2 - 200, height/2 + 100);
    var a = atan2(mouseY-height/2,mouseX-width/2);
    rotate(-a);
    if (dist(mouseX,mouseY,width/2,height/2)<=50) {
        fill(158,118,255);
    }
    else {fill(100);}
    triangle(-25,-25,0,-25,0,0);
    triangle(-25,-25,-50,0,0,0);
    triangle(0,0,0,-50,25,-25);
    triangle(0,0,25,-25,25,0);
    triangle(0,0,50,0,25,25);
    triangle(0,0,25,25,0,25);
    triangle(0,0,0,50,-25,25);
    triangle(0,0,-25,25,-25,0);
    pop();
    //left windmill counterclockwise 

    push();
    translate(width/2 + 200, height/2 + 100);
    var a = atan2(mouseY-height/2,mouseX-width/2);
    rotate(-a);
    if (dist(mouseX,mouseY,width/2,height/2)<=50) {
        fill(155,189,115);
    }
    else {fill(100);}
    triangle(-25,-25,0,-25,0,0);
    triangle(-25,-25,-50,0,0,0);
    triangle(0,0,0,-50,25,-25);
    triangle(0,0,25,-25,25,0);
    triangle(0,0,50,0,25,25);
    triangle(0,0,25,25,0,25);
    triangle(0,0,0,50,-25,25);
    triangle(0,0,-25,25,-25,0);
    pop();
    //right windmill counterclockwise


    if (dist(mouseX,mouseY,width/2,height/2)<=100) {
        x = mouseX; 
        y = mouseY; 
        noFill();
        strokeWeight(5);
        stroke(65,95,183);
        beginShape ();
        curveVertex(x,y);
        curveVertex(x,y);
        curveVertex(x + 25, y +25);
        curveVertex(x + 50, y);
        curveVertex(x + 75, y +25);
        curveVertex(x + 100, y);
        curveVertex(x + 100, y);
        endShape();
        beginShape ();
        curveVertex(x,y + 20);
        curveVertex(x,y + 20);
        curveVertex(x + 25, y +45);
        curveVertex(x + 50, y + 20);
        curveVertex(x + 75, y +45);
        curveVertex(x + 100, y +20);
        curveVertex(x + 100, y +20);
        endShape();
        beginShape ();
        curveVertex(x,y + 40);
        curveVertex(x,y + 40);
        curveVertex(x + 25, y + 65);
        curveVertex(x + 50, y + 40);
        curveVertex(x + 75, y + 65);
        curveVertex(x + 100, y + 40);
        curveVertex(x + 100, y + 40);
        endShape();
    }
    //wind 


    fill(178,119,119);
    stroke(255);
    strokeWeight(2);
    ellipse(0,0,200,200);
    //sunny sun 


    if (dist(mouseX,mouseY,width/2,height/2)>=100){
        fill(249,143,143);
        ellipse(0,0,200,200);
    }
    //cloudy sun 


    if (dist(mouseX,mouseY,width/2,height/2)<=100){
        fill(220);
        ellipse(0,100,50,50);
        ellipse(30,110,40,40);
        ellipse(50,70,70,70);
        ellipse(70,100,50,50);
        ellipse(100,90,50,50);

        ellipse(200,100,50,50);
        ellipse(230,110,40,40);
        ellipse(250,70,70,70);
        ellipse(270,100,50,50);
        ellipse(300,90,50,50);

        ellipse(400,100,50,50);
        ellipse(430,110,40,40);
        ellipse(450,70,70,70);
        ellipse(470,100,50,50);
        ellipse(500,90,50,50);

        ellipse(600,100,50,50);
        ellipse(630,110,40,40);
        ellipse(650,70,70,70);
        ellipse(670,100,50,50);
        ellipse(700,90,50,50);
}
    //cloud


    fill(255);
    noStroke();

    ellipse(x,100,diam,diam);
    ellipse(x - diam/2,100-diam/3,diam,diam);
    ellipse(x + diam/2,100-diam/3,diam * 1.5,diam *1.5);
    ellipse(x + diam * 1.4,100-diam/4,diam,diam);
//cloud 1
    ellipse(x - 100,150,diam,diam);
    ellipse(x - diam/2 - 100,150-diam/3,diam,diam);
    ellipse(x + diam/2 -100,150-diam/3,diam * 1.5,diam *1.5);
    ellipse(x + diam * 1.4 -100,150-diam/4,diam,diam);
//cloud 2
    ellipse(x + 100,150,diam,diam);
    ellipse(x - diam/2 + 100,150-diam/3,diam,diam);
    ellipse(x + diam/2 +100,150-diam/3,diam * 1.5,diam *1.5);
    ellipse(x + diam * 1.4 +100,150-diam/4,diam,diam);
//cloud 3
    x += dir*speed;
    if (x > width - 25 || x < 25) {
        dir = -dir;
    }

    if (diam > 50) {
        dir2 = -dir2;
    }

    if (diam < 10){
        dir2 = -dir2;
    }

    if (mouseX < width/2 + 50 || mouseX > width/2 - 50) {
        diam += dir2 * speed2;
    }
    //moving clouds

}

For this assignment I created windmills generated by mouse movement. As the middle windmill rotates clockwise, the other windmills on both sides rotates counterclockwise. Weather condition is also controlled by the mouse movement.

mjeong1-Looking Outwards-03-Section A

Zaha Hadid Architects generated geometry through robotic-assisted design

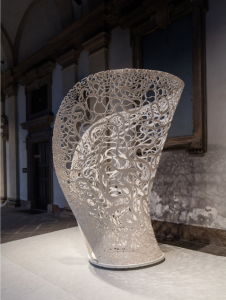
“Thallus” by Zaha Hadid Architects in Accademia di Belle Arti di Brera, Milan,Italy

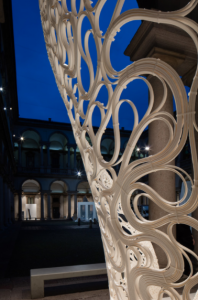
Thallus is a installation being part of the exhibition “White In The City” in Milan. The exhibition explored use of white color for art and architecture in the contemporary world. The structure is 3D printed using premium polylactide plastic. I think how the shape and pattern are generated is interesting. The pattern started with simple cylinders on surface and Six-axis robotic 3D-printing technology generated one continuous stroke connecting the each cylinder, which produced “calla lily”-like geometry on the surface. The design explores how the curve is guided along the surface and change its density and size through parametric boundaries.

What is interesting about ZHA’s Thallus was use algorithmic thinking to clarify the relationship between the design intent and design response. The geometry is clearly defined by certain rules within the boundary of parametric calculation also it successfully rendered its parametric relationship with the original cylinder shape and its final calla lily-like curve.

Link to Thallus