![[OLD FALL 2017] 15-104 • Introduction to Computing for Creative Practice](../../../../wp-content/uploads/2020/08/stop-banner.png)
Artist Paul Prudence has created a new panoramic audiovisual performance work called The Mylar Typology which combines gelatinous oil-colored forms with slow pulsing auditory stimulus. The work utilizes what Prudence describes as “Slowly transforming abstractions of iridescent wavelets and hyperchromatic emulsions synchronised to binaural drones” to produce a calming effect, in part due to the effect of brainwave entrainment, in which neural wave frequencies synchronize with outside stimulus in order to reach an associated state of mental cognition, in this case, relaxation. Prudence aims to produce a sensorially immersive viewer/listener experience which leaves the subject matter largely ambiguous.
Category: Section D
danakim-Project-04
//Dana Kim
//danakim@andrew.cmu.edu
//Section D
//Project-04

function setup() {
  createCanvas(400, 300);
  background(247, 196, 195);
}
function draw() {
  //midpoints of edge of canvas
  var x1 = width/2;
  var y1 = 0;
  var x2 = 0;
  var y2 = height/2;
  var x3 = width/2;
  var y3 = height;
  var x4 = width;
  var y4 = height/2;
  //outer corners
  var x5 = 0;
  var y5 = 0;
  var x6 = width;
  var y6 = 0;
  var x7 = width;
  var y7 = height;
  var x8 = 0;
  var y8 = height;

  stroke(0);
  strokeWeight(5);
  //midpoints of edges
  point(x1, y1);
  point(x2, y2);
  point(x3, y3);
  point(x4, y4);
  //outer corners
  point(x5, y5);
  point(x6, y6);
  point(x7, y7);
  point(x8, y8);

//midpoint of edge lines
  //lines from left midpoint of canvas to
  //points along the y-axis on top side of
  //canvas
  for(var i = 0; i <= 75; i+= 18.75){
    stroke(0);
    strokeWeight(1);
    line(0, height/2, width/2, i);
  }
  //lines from top midpoint of canvas to
  //points along the x-axis on left side of
  //canvas
  for(var i = 0; i <= 100; i+= 25){
    line(width/2, 0, i, height/2);
  }
  //lines from right midpoint of canvas to
  //points along the y-axis on top side of
  //canvas
  for(var i = 0; i <= 75; i+= 18.75){
    line(width, height/2, width/2, i);
  }
  //lines from top midpoint of canvas to
  //points along the x-axis on right side
  //of canvas
  for(var i = 400; i >= 300; i-= 25){
    line(width/2, 0, i, height/2);
  }
  //lines from left midpoint of canvas to
  //points along the y-axis on bottom side of
  //canvas
  for(var i = 300; i >= 225; i-= 18.75){
    line(0, height/2, width/2, i);
  }
  //lines from bottom midpoint of canvas to
  //points along the x-axis on left side of
  //canvas
  for(var i = 0; i <= 100; i+= 25){
    line(width/2, height, i, height/2);
  }
  //lines from right midpoint of canvas to
  //points along the y-axis on bottom side of
  //canvas
  for(var i = 225; i <= 300; i+= 18.75){
    line(width, height/2, width/2, i);
  }
  //lines from bottom midpoint of canvas to
  //points along the x-axis on right side
  //of canvas
  for(var i = 400; i >= 300; i-= 25){
    line(width/2, height, i, height/2);
  }

//outer corner lines
  //lines from top left corner to points
  // along top half of y-axis
  for(var i= 0; i <= 150; i += 18.75){
    stroke(0);
    strokeWeight(0.5);
    line(0, 0, width/2, i);
  }
  //lines from top left corner to points
  // along left half of x-axis
  for(var i= 0; i <= 200; i += 25){
    line(0, 0, i, height/2);
  }
  //lines from top right corner to points
  // along top half of y-axis
  for(var i= 0; i <= 150; i += 18.75){
    line(width, 0, width/2, i);
  }
  //lines from top right corner to points
  // along right half of x-axis
  for(var i= 200; i <= 400; i += 25){
    line(width, 0, i, height/2);
  }
  //lines from bottom left corner to points
  // along bottom half of y-axis
  for(var i= 150; i <= 300; i += 18.75){
    line(0, height, width/2, i);
  }
  //lines from bottom left corner to points
  // along right half of x-axis
  for(var i= 0; i <= 200; i += 25){
    line(0, height, i, height/2);
  }
  //lines from bottom right corner to points
  // along bottom half of y-axis
  for(var i= 150; i <= 300; i += 18.75){
    line(width, height, width/2, i);
  }
  //lines from top right corner to points
  // along right half of x-axis
  for(var i= 200; i <= 400; i += 25){
    line(width, height, i, height/2);
  }
}
This project was one of the easier ones we’ve had so far in my opinion. I used for() loops to generate the sets of lines. I kept it fairly simple by assigning the starting points to the corners of the canvas and to the midpoints of the edges of the canvas.
aranders-project-04
//Anna Anderson
//Section D
//aranders@andrew.cmu.edu
//project-04

function setup() {
  createCanvas(400, 300);
}

function draw() {
  background(0, 0, 180);

  var xpoint;
  var ypoint;

//daisy petals

  strokeWeight(1);
  stroke(255);


//top petal
  for (var xpoint = 175; xpoint < 225; xpoint += 3) {
      line(200, 20, xpoint, 150);
  }

//top left petal
  for (var xpoint = 165; xpoint < 230; xpoint += 3.5) {
      line(100, 55, xpoint, 150);
  }

//left petal
  for (var ypoint = 125; ypoint < 175; ypoint += 3) {
      line(55, 150, xpoint - 10, ypoint);
  }

//bottom left petal
  for (var xpoint = 175; xpoint < 230; xpoint += 3.5) {
      line(100, 245, xpoint, 150);
  }

//bottom petal
  for (var xpoint = 175; xpoint < 225; xpoint += 3) {
      line(200, 280, xpoint, 150);
  }

//bottom right petal
  for (var xpoint = 175; xpoint < 230; xpoint += 3.5) {
      line(300, 245, xpoint, 150);
  }

//right petal
  for (var ypoint = 125; ypoint < 170; ypoint += 3) {
      line(340, 150, xpoint - 25, ypoint);
  }

//top right petal
  for (var xpoint = 170; xpoint < 230; xpoint += 3.5) {
      line(295, 55, xpoint, 150);
  }

//daisy center
  noStroke();
  fill(255, 255, 77);
  ellipse(200, 150, 70, 70);

}
I like how my daisy project turned out. The string idea really confused me, but eventually I got the hang of it.
rkondrup-project-04-string-art
//ryu kondrup
//rkondrup@andrew.cmu.edu
//Section D
//project-04-string-art

var shadow = 5;
var downDown = 30;

function setup() {
    createCanvas(400, 300);
    strokeWeight(1);
    noFill();

}

function draw() {
    background(0);
    for (var i = 20; i < 400; i += 20) {
      //line(i*1.2+120, 0, i/4-50, height);
      //line(i*1.2+120, 0, i/20+200, height+200);
      //line(i/20+200, height+200, 0, 0);

      //red
      stroke(255, 0, 0);
      //big swoop
      bezier(-100, height+1000,
        i*.6, i+10, i*2, i*1.2,
        width-i+100, height-i+100);
        //small swoop
      bezier(0, i*.2+downDown,
             i*.2, i*.3+downDown,
             i*1.7, i*1.6+downDown,
             -100, height+1000+downDown);

        //blue
        stroke(0, 0, 255);
        //big swoop
        bezier(-100+shadow*.4, height+1000,
          i*.6, i+10+shadow*.4, i*2, i*1.2,
          width-i+100+shadow*.4, height-i+100);
          //small swoop
          bezier(0+shadow*.4, i*.2+downDown,
                 i*.2+shadow*.4, i*.3+downDown,
                 i*1.7+shadow*.4, i*1.6+downDown,
                 -100 + shadow*.6, height+1000+downDown);

        //green
        stroke(0, 255, 0)
        //big swoop
        bezier(-100 + shadow*.6, height+1000,
          i*.6 + shadow*.6, i + 10,
          i*2 + shadow*.6, i*1.2,
          width-i + 100 + shadow, height - i + 100);
        //small swoop
        bezier(0 + shadow*.6, i*.2+downDown,
               i*.2 + shadow*.6, i*.3+downDown,
               i*1.7 + shadow*.6, i*1.6+downDown,
               -100 + shadow*.6, height+1000+downDown);


    }

}
In this project, I wanted to create something simple and abstract, but also explore different forms that can be made using curves inside of for loops. I also wanted to experiment with visual effects, so I offset each curve slightly and changed colors to RGB values to give the lines a sense of three-dimensionality and layering.
yunzhous-LookingOutward-02
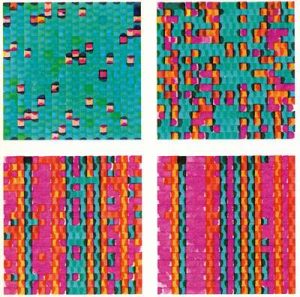
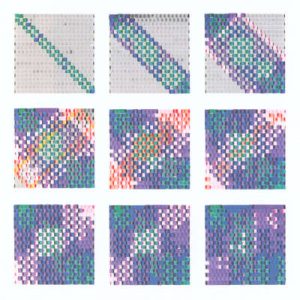
The artwork I chose is the “Matrizenmultiplikation, Serie 40” by Frieder Nake. Using the right colors and combining colors is hard. It can be troubling when making such decision. What if the computer helped us to make the decision? I really appreciate the variety of colors and the saturation in the artwork. I think the computer has generated a beautiful image. The software that the artist used is called Matrizenmultiplikation in Algol60. I suppose the artist set a grid system through the algorithm and assign made many categories of colored squares. Then the colored squares would randomly be scattered in the grid system to make color combinations. I think Nake shows hist artistic sensibilities through dividing the grid system into several areas and each area can only have certain number of random colors. This way the colors won’t be all randomly mixed together. They would have certain order while still being random. I think it would be interesting to try out more shapes than grid system.
You can see the work here
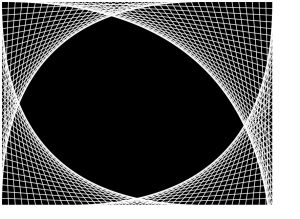
creyes1-Project-04-String-Art
//Christopher Reyes
//Section D
//creyes1@andrew.cmu.edu
//Project-04 (String Art)

//Variables for all 4 quadrants of diamond, counter-clockwise from top-right
var x1q1 = 200;
var y1q1 = 0;
var y1q1Interval = 5;
var x2q1 = 200;
var x2q1Interval = 5;
var y2q1 = 150;

var x1q2 = 200;
var y1q2 = 0;
var y1q2Interval = 5;
var x2q2 = 200;
var x2q2Interval = 5;
var y2q2 = 150;

var x1q3 = 200;
var y1q3 = 300;
var y1q3Interval = 5;
var x2q3 = 200;
var x2q3Interval = 5;
var y2q3 = 150;

var x1q4 = 200;
var y1q4 = 300;
var y1q4Interval = 5;
var x2q4 = 200;
var x2q4Interval = 5;
var y2q4 = 150;

//Variables for counter-clockwise spinning blue ring
var angleRing1 = 0;
var innercircleSaturation = 74;
var saturationInterval = -1;

//Variables for clockwise spinning rainbow ring
var angleRing2 = 0;
var circleHue = 0;

//Centerpoint to base rings off of
var cx = 200; //X coordinate of circle origin
var cy = 150; //Y coordinate of circle origin

function setup() {
    createCanvas(400, 300);
    background(229, 225, 174); //Darker yellow background
    angleMode(DEGREES);

    noStroke();

    fill(252, 248, 194); //Lighter yellow circle
    ellipse(width/2, height/2, 350, 350);

    fill(158, 224, 239); //Sky blue circle
    ellipse(width/2, height/2, 245, 245);

    fill(256, 40); //Transparent white circles
    ellipse(100, 100, 300, 300);
    ellipse(300, 200, 300, 300);
    ellipse(300, 100, 300, 300);
    ellipse(100, 200, 300, 300);

    //Diamond, Quadrant 1
    for(var i = 1; i <= 40; i++) {
        x2q1 += x2q1Interval;
        y1q1 += y1q1Interval;
        stroke(256);
        line(x1q1, constrain(y1q1, 30, 150), constrain(x2q1, 200, 320), y2q1);
    }

    //Diamond, Quadrant 2
    for (var i = 1; i <= 40; i++) {
        x2q2 -= x2q2Interval;
        y1q2 += y1q1Interval;
        stroke(230);
        line(x1q2, constrain(y1q2, 30, 150), constrain(x2q2, 80, 200), y2q2);
    }

    //Diamond, Quadrant 3
    for (var i = 1; i <= 40; i++) {
        x2q3 -= x2q3Interval;
        y1q3 -= y1q3Interval;
        stroke(256);
        line(x1q3, constrain(y1q3, 150, 270), constrain(x2q3, 80, 200), y2q3);
    }

    //Diamond, Quadrant 4
    for (var i = 1; i <= 40; i++) {
        x2q4 += x2q4Interval;
        y1q4 -= y1q4Interval;
        stroke(230);
        line(x1q4, constrain(y1q4, 150, 270), constrain(x2q4, 200, 320), y2q4);
    }

}

function draw() {

    colorMode(HSB);

    //Creates a constantly-looping, counter-clockwise spinning
    //blue ring with a varying saturation
    for(var i = 1; i <=1; i++) {
        angleRing1 -= 5
        stroke(205, innercircleSaturation, 105);
        line(computeX(50, angleRing1), computeY(50, angleRing1),
            computeX(50, angleRing1+140), computeY(50, angleRing1+140));
        innercircleSaturation += saturationInterval;
        //Switches b/w increasing & decreasing saturation at certain thresholds
        if (innercircleSaturation < 20 && saturationInterval < 0 ||
            innercircleSaturation > 74 && saturationInterval > 0) {
            saturationInterval = -saturationInterval;
        }
    }

    //Creates a constantly-looping, clockwise spinning rainbow ring
    for(var i = 1; i <=1; i++) {
        angleRing2 += 5
        stroke(circleHue, 52, 70);
        line(computeX(350, angleRing2), computeY(350, angleRing2),
             computeX(350, angleRing2+140), computeY(350, angleRing2+140));
        circleHue += 15;
        //Resets hue of line drawn to H = 0 to make a continuous transition
        if (circleHue > 360) {
            circleHue = 0;
        }
    }

}

//Computes the X position of a point on a circle according to given parameters
function computeX(ringRadius, angle) {
    return cx + ringRadius*cos(angle);
}

//Computes the Y position of a point on a circle according to given parameters
function computeY(ringRadius, angle) {
    return cy + ringRadius*sin(angle);
}
I was initially unsure as to how to approach this project, but I was somewhat inspired by circular string art patterns and – after accidentally creating several infinite loops while figuring out this week’s assignments – the motion of loading cursors (the blue ring on Windows and rainbow pinwheel on iOS). I’m definitely pleased with the final product, and enjoyed being able to experiment with parameters and seeing the various effects it could have on the program. For instance, the rainbow swirl was initially an accident, but it forced me to look into precisely what that code was doing, understanding it, and then modifying and leveraging it in order to achieve the final effect.
jennyzha-Project 04
//project

var yspace = 10;
var xspace = 25;
var x1 = 1;
var y1 = 299;
var x2 = 399;
var y2 = 1;

function setup(){
	createCanvas(400, 300);
	background(0);
}

function draw() {
	for(var i = 0; i < 100; i +=1){
		strokeWeight(0.01);
		stroke(255);
		line(x1, height - yspace * i, xspace * i, y2);
		line(x1, yspace * i, xspace * i, y1);
		line(xspace * i, y1, x2, height - yspace * i);
		line(x2, yspace * i, xspace * i, y2);
	}
}
This was a really cool project for me, I think my favorite part is that when you refresh the page you can almost see the loop working as it draws up. The math behind the concepts of this code are also super interesting.
daphnel-Project 04-String Art
//Daphne Lee
//15-104::1 (9:30am) Section D
//daphnel@andrew.cmu.edu
//Project 04-String Art
function setup() {
createCanvas(400,300);
}
function draw(){
background(0);
strokeWeight(1);
stroke(255);
var xCanvas=400;
var yCanvas=300;
var x=0;
var y2=0;
//anytime the increment is increasing the y coord, it's 3/4*x1 because
//the height is less than the width
for(var x1 = 0; x1 < xCanvas; x1 += 10){
//bottom left curve
var y = x1 * 3/4;
line(x, y, x1, yCanvas);
//top left curve
line(x, yCanvas-y, x1, y2);
//bottom right curve
line(xCanvas, y, xCanvas-x1,yCanvas);
//top right curve
line(x1,y2,xCanvas,y);
}
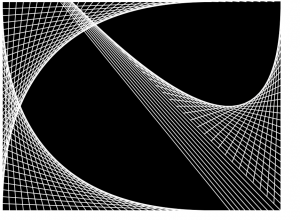
}
Since I’ve never done much work with using such lines to create curves, I looked a lot at the 7th grade webpage provided to us. I wanted to do something simple yet nice and thought of this.
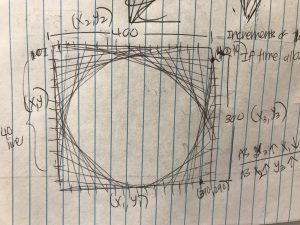
It took me a while to get the lines to fit the way I wanted them too especially because the canvas isn’t a square. I had to tinker around with the variables to make them fit better. Additionally, I spent more time probably looking at my paper trying to figure out which points connected to which and how I would get the coordinates of them.
Some screenshots of my process. The first one was just flew out of the canvas literally while the other one was just not having symmetrical halves at all.
cduong-looking outward 04-FabricKeyboard
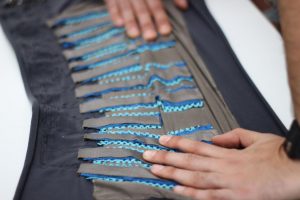
The project is “FabricKeyboard”, which is a stretchable fabric that is used as a musical instrument. It is a physical interaction media based on fabric. The way it functions is that it is a multilayer design that is created in a way to look as though it has different ‘keys” that have extensions that can determine things such as touch, proximity, pressure, stretch, position, etc. The video was honestly so amazing to watch, especially with the range of sounds that they can make and it is just so interesting to think that technology has advanced so far that people can now produce sounds from a piece of fabric.
They used software known as MIDI that allows the FabricKeyboard to “plug and play” and they are currently exploring the OSC protocol to use it wirelessly. The algorithms that were possibly used to develop this work had to be working on different combinations of factors such as pressure, proximity, etc. to produce a specific type of sound and they had to determine exactly what types of sounds they wanted to produce.
They had to develop this fabric to look a specific way and it looks somewhat like a futuristic keyboard or piano, especially with the sounds that it makes. The creator’s had full control of what they wanted the sounds to be and how they wanted every little factor to affect the sounds.
The FabricKeyboard was created by the Responsive Environments team at the MIT Media Lab. This was created this year in 2017.
FabricKeyboard – Stretchable fabric (sensate media) as a musical instrument
jennyzha – Looking Outwards 04
Carsten Nicolai is a german artist and musician based in berlin. He often incorporates mathematic patterns such as grids and codes, as well as error, random and self-organizing structures.
For his musical attributes he uses the pseudonym alva noto; leading his sound experiments into the field of electronic music by creating his own code of acoustics and visual symbols.
Reflektor distortion is a rotating, basin filled with water – is inspired by the shape of a parabolic mirror that ‘rotates’ water. The installation consists of the three main parts including mirror, reflection and distortion. Both the curve and distortion of the water is affected by speed and integrated resistors that generate a permanently new and re-organizing mirror reflection. The water surface will be affected by the speaker due to the low sound frequencies. Therefore, the water shows the distorted reflection; ultimately personifying a distorted reality.