Looking Outwards: Information Visualization

World City-to-City connections

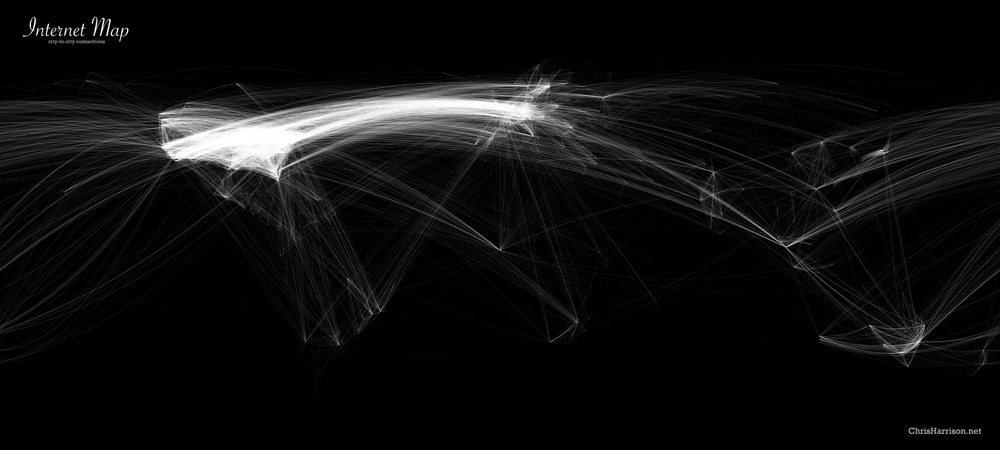
Creator: Chris Harrison

Link: https://www.chrisharrison.net/index.php/Visualizations/InternetMap

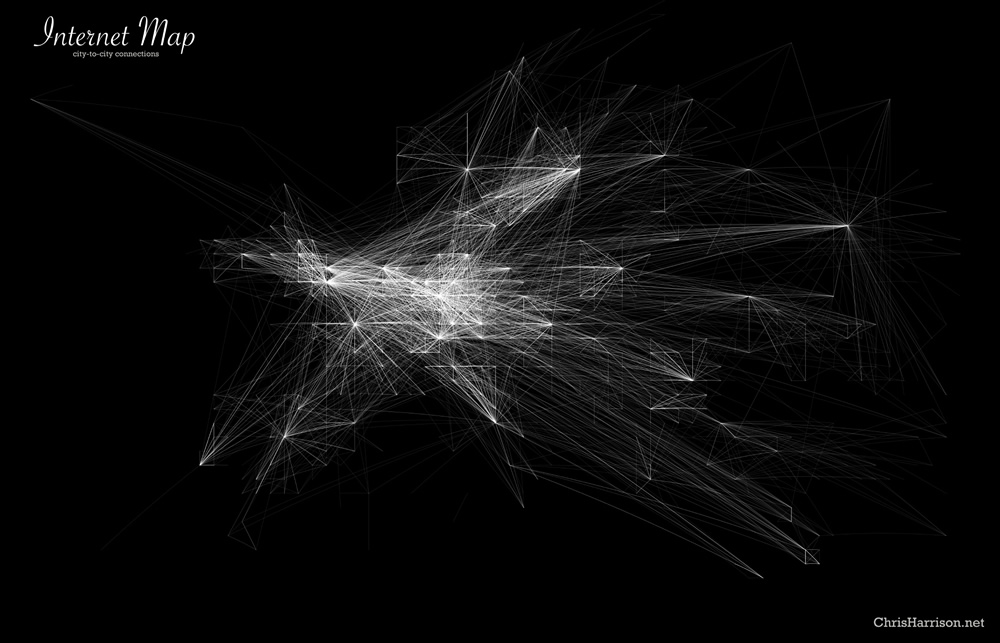
This map visualizes the city-to-city Internet connections, which play a huge role in our lives nowadays. For those of us in the US, it seems like we would no longer be able to survive without the Internet. Yet looking at this map helped me realize how millions of people have little to no access to the Internet. Being connected online feels like a guarantee for many of us, and at least for me, this map made me realize that I’ve been taking granted how easy it is to access the Internet, when in reality, access to the Internet would be a life changing resource for the millions of people without access. 

World Connection Density

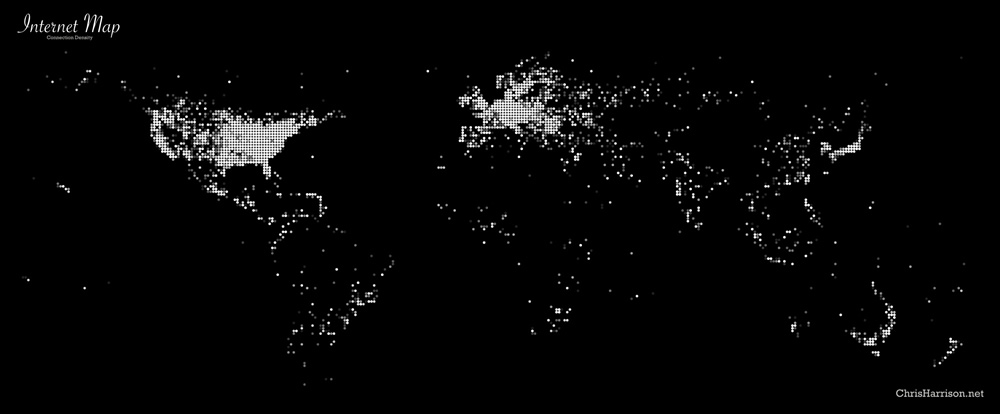
This project also made me wonder about the quantity of communication between high internet usage countries and low internet usage countries. Due to globalization, the choices that more powerful countries make can drastically affect every single other country in the world. It seems to me that as a resource, the Internet has become so fundamental for so many things that lack of Internet access and infrastructure is a huge disadvantage for many countries and people. 

The map was created with data from the DIIMES Project. It displays a total of 89,344 connections.

European City-to-City Connections

Project 06 – Abstract Clock

sketch
function setup() {
    createCanvas(400, 400);
    angleMode(DEGREES);
}

function draw() {
    background(0); //black
    translate(200,200);

    let hr = hour();
    let min = minute();
    let sec = second();

    strokeWeight(10);
    stroke(244,195,195); // pink outline
    noFill();

    let end1 = map(sec, 0, 60, 0, 360); //seconds
    arc(0,0,300,300,0,end1); 

    push();
    rotate(end1); //rotate following the seconds
    stroke(255,0,0);
    line(0,0,100,0); //big clock line RED
    pop();

    stroke(137,207,240); // blue outline
    let end2 = map(min, 0, 60, 0, 360); //minutes
    arc(0,0,280,280,0,end2); 

    push();
    rotate(end2); //rotate following the minutes
    stroke(255);
    line(0,0,100,0); //big clock line WHITE
    pop();

    stroke(157,193,131); //green outline
    let end3 = map(hr,0,24,0,360); //hour
    arc(0,0,260,260,0,end3);

    push();
    rotate(end3); //rotate following the hour
    stroke(255);
    line(0,0,50,0); //small clock line WHITE
    pop();


//let end = map(mouseX, 0, width, 0, 360);
//arc(200,200,300,300,0,360); 
//strokeWeight(6);
//stroke(255); // white
//noFill();
//ellipse(200,200,300,300);


    //fill(255);
   // noStroke();
   // text
}

LO 06: Random Computational Art

While looking for examples of random art on google, something that came up was “Scott Pakin’s Random Art Generator.” In this webpage, the user is able to toggle a few settings in order to create a randomly generated image. They have the ability to adjust the canvas size, the complexity, the color model, and whether they equalize color or not. By adjusting these, the computer then generates a unique image of random color, lines, and shapes. The outcome of the graphics mostly stick to being a similar style, as seen below, but they do change with the inputs you give them. I admire that the engineer of this website is able to create an algorithm that can produce these unique images. I think the algorithm they use is similar to the one that we use in class where colors are generated within a specific random set and so are graphics/canvas size.

Name: Scott Pakin’s Random Art Generator
Link: https://www.pakin.org/random-art/

Project 06: Abstract Clock

sketch

I found this project a little challenging, but I do like what I was able to make in the end! There were elements that I was really hoping to add, like an inverted color for the background and lines between the morning and afternoon, but my hours function was not working so I wasn’t able to include that aspect. But I mainly wanted to create a clock that created a full picture with the end of a day. The circles on the right count the minutes and sections and the lines on the right create a grid that has lines added each hour.

//Jacky Lococo
//jlococo
//Section C
function setup() {
    createCanvas(370, 600);
}

function draw() {
    background(0);
    var sec = second() // variable ofr the seconds
    var min = minute() // variable for minutes
    var h = hour()
    var strokeLine = 255 // varible for stroke (ended up not working)

    //white lines that divide seconds, minutes, hours
    strokeWeight(1)
    stroke(strokeLine)
    line(330, 0, 330, 600)

    strokeWeight(1)
    stroke(strokeLine)
    line(290, 0, 290, 600)

    //y value for the seconds cirlces
    for (var y = 10; y <= 10*(sec); y += 10) {
        strokeWeight(0)
        fill(255, 204, 204)
        ellipse(350, y, 10, 10);
    }
    //y value for the minutes since x is the same for each added cirlce
    for(var ym = 10; ym <= 10*(min); ym +=10){
        strokeWeight(0)
        fill(255, 102, 102)
        ellipse(310, ym, 10, 10)
    }

    //hour-horizontal and verticle lines will be drawn with each hour to create a grid
    //y value change for the hours - horizontal visualization
    for(var yh = 25; yh <= 25*(h); yh += 25){
        strokeWeight(1)
        stroke(strokeLine)
        line(0, yh, 290, yh)
    } 
    //x valye for the change in hour - verticle depiction 
    for(var xh = 290/24; xh <= (290/24)*(h); xh += 290/24){
        strokeWeight(1)
        stroke(strokeLine)
        line(xh, 0, xh, 600)
    }

    //red cirlces that follow the hour lines
    strokeWeight(0)
    fill(255, 51, 51)
    ellipse(275, yh - 25, 10, 10)

    strokeWeight(0)
    fill(255, 51, 51)
    ellipse(xh-290/24, 580, 10, 10)


}


Project 06: Abstract Clock

project 6 sketch copy

var beginday;
var seconds;
var minutes;
var hours;
var bloomx = []; 
var bloomy = [];

function setup(){
    createCanvas(460, 300);
    
    //flower per each passing second
    for (i = 0; i < 60; i ++) {
        bloomx[i] = random(20,440);
        bloomy[i] = random(20,280);
   }
}

function draw(){
    hours = hour();
    minutes = minute();
    seconds = second();
    beginday = 270;
    angleMode(DEGREES);
    
    //daytime background or nightime background 
    if (hours < 7 || hours > 18){
        background(31, 47, 71);
        
    } else{
        background(102, 178, 255);
        
    }
    
    //clock lines
    noFill();
    strokeWeight(15);
    
    //hours measure
    stroke(255, 102, 102, 175);
    arc(230, 150, 240, 240, beginday, beginday + hours * 30);
    
    //minutes measure
    stroke(255, 128, 0, 190);
    arc(230, 150, 200, 200, beginday, beginday + minutes * 6);
    
    //seconds measure
    stroke(255,255,0, 125);
    arc(230, 150, 160, 160, beginday, beginday + seconds * 6);

    for (i = 0; i < seconds; i ++) {
        strokeWeight(10);
        fill(255);
        ellipse(bloomx[i], bloomy[i], 6, 6);
    }

    //determines whether sun or moon is shown and whether the star is present 
    if (hours < 7 || hours > 18){
        
        //moon
        noStroke();
        fill(160,160,160);
        circle (230, 150, 125);
        fill(192,192,192);
        ellipse(270, 115, 10, 10);
        ellipse(235, 110, 30, 30);
        ellipse(270, 150, 40, 40);
        ellipse(230, 175, 20, 20);
        ellipse(205, 140, 40, 40);

        //star that appears every OTHER second
        noStroke();
        fill(255);
        translate(300, 70);
        triangle(25 * (seconds % 2), 0, 0, 4, 0, -4);
        triangle(-4, 0, 4, 0, 0, 25 * (seconds % 2));
        triangle(-4, 0, 4, 0, 0, -25 * (seconds % 2));
        triangle(-25 * (seconds % 2), 0, 0, 4, 0, -4);

        } else{

        //sun
        noStroke();
        fill(249, 228, 95);
        circle (230, 150, 125);
        
        //cloud that appears every OTHER second
        fill(255);
        noStroke();
        ellipse(330, height/2-70, 50, 50 * (seconds % 2));
        ellipse(360, height/2-80, 80, 80 * (seconds % 2));
        ellipse(390, height/2-70, 80, 80 * (seconds % 2));
        ellipse(420, height/2-70, 50, 50 * (seconds % 2));
        
    }
}

I wanted to use lines and play around with transparency, so that’s what I did with the three seconds, minutes and hours lines. Besides the inner yellow line that extended each second, I also added yellow flowers/stars that would randomly populate the canvas per second. In the code you can see that when the hour of day is less than 7 (before 7am) or greater than 18 (after 6pm), the background color and the different parts (sun and cloud) will change into its night version (moon and star). Since there were now two elements measuring seconds, I had the cloud and star appear every other second for a bit of variety.

Paper sketch of clock

LO 6: Random Access Music

by Nam Jun Paik

The 1963 installation “Random Access Music” by Nam Jun Paik consists of many strips of audiotape, containing found sounds, randomly arranged on a wall. In front of the wall is an open reel audio deck with the playback head detached so that the viewer can play the tape on the wall by moving the playback head along the strips of audiotape. Thus the viewer becomes the composer, changing the sound being played by how and where they move the playback head. The only explicitly random thing here is the arrangement of the audiotape, but the element of interactivity here takes the final product out of the control of the artist in much the same way that randomness does. The viewer doesn’t know what is on the tape so they have no way of making an informed decision on how to move the playback head, so the resulting sound that is played approaches randomness. I think this piece is a really cool early example of interactive artwork, and a creative use or mis-use of technology.

https://www.guggenheim.org/artwork/9536

“Random Access Music” by Nam Jun Paik, seen here in 2000 at the Guggenheim Museum

Project 06: Abstract Clock

For my abstract clock I chose to use a database of song lyrics that mention specific times of day. The clock breaks up the day into 886 equal units of time, the number of song lyrics in the data set, and displays each lyric one after another. The background color also changes with the time of day being referenced in the song. As a result the time measured by this clock is not the actual time of day, but rather the time of day represented within our popular musical cannon mapped to a real 24 hour day. Hours that are referenced more often last longer on this clock and those only mentioned a few times pass by quickly.

sketch

//Tim Nelson-Pyne
//tnelsonp@andrew.cmu.edu
//Section C
//Project-06-Abstract Clock


function preload() {
  //loads a .txt file that contains a large sampling of song lyrics 
  //that refer to specific times of day
  timeLyrics = loadStrings('https://courses.ideate.cmu.edu/15-104/f2021/wp-content/uploads/2021/10/timeLyrics.txt')
}

function setup() {
  createCanvas(400, 400);
  background(0);
  
}

function draw() {

  //gets the total amount of seconds that have ellapsed that day
  var s = second();
  var m = minute();
  var h = hour();
  m = m * 60
  h = h * 3600
  var totalS = m + h + s;
  

  var i = map(totalS, 0, 86400, 0, 886);
  i = round(i);
  
  //changes background color based on the time that the song lyrics are refering to
  if (i < 421 || i > 780) {
    //its nightime
    fill(0);
  }
  if (i >= 421 & i < 481) {
    //its 5am
    fill(10, 0, 50);
  }
  if (i >= 481 & i < 538) {
    //its 6am
    fill(141, 163, 152);
  }
  if (i >= 538 & i < 562) {
    //its 7 am
    fill(217, 133, 69);
  }
  if (i >= 562 & i < 595) {
    //its 8 am
    fill(249, 192, 107);

  }
  if (i >= 595 & i < 628) {
    //its 9 am
    fill(255, 230, 190);
  }
  if (i >= 628 & i < 631){
    //its 10 am
    fill(255, 255, 200);

  }
  if (i >= 631 & i < 722) {
    //its day
    fill(255);
  }
  if (i >= 722 & i < 747) {
    //its 5pm
    fill(255, 230, 190);
  }
  if (i >= 747 & i < 761) {
    //its 6pm
    fill(238, 108, 32);

  }
  if (i >= 761 & i <= 780) {
    //its 7pm
    fill(100, 15, 36);
  }
  
  textSize(15);
  noStroke();
  //redraws the background
  rect(0, 0, width, height);

  //changes the type color based on what the background color is
  if (i < 421 || i > 780) {
    fill(255);
  }
  else {
    fill(100);
  }

  //displays a song lyric
  //each lyric gets the same amount of time on screen
  //the lyrics repeat each day
  textAlign(CENTER);
  text(timeLyrics[i], 0, 10, width, height);


}

Project 06 – Abstract Clock

I remember learning about the Korean water clock that was invented in the Chosun dynasty in elementary school, which inspired me to create a simplified version of it through p5.js.

엄마표 과학] 만공한국사, 자격루 만들기 - 물시계의 원리 : 네이버 블로그
reference image
sketch
var angle = 180;
function setup() {
    createCanvas(420, 400);
    // rectMode(CENTER);
}

function draw() {
    background(0);
    fill(255);
    textAlign(CENTER);
    textSize(30);
    text('The water clock', width/2, 50);
    textSize(10);
    textAlign(LEFT);

    let hr = hour();
    let mn = minute();
    let sc = second();

   
    fill(255);
    text(hr + ':' + mn + ':' + sc, 10, 150);
    text('24:00:00', width-65, 150);
    rect(100, 140, 30, 5);
    rect(200, 140, 30, 10);
    
    //hour
    push();
    fill(255);
    translate(350, 380);
    rotate(radians(180)); //rotation to make the rectangle grow upwards
    rect(0, 0, 120, 240);
    fill(0, 0, 255);
    translate(5, 0);
    rect(0, 0, 110, hr*10);
    pop();

    //minute
    push();
    fill(255); //red rectangle
    translate(205, 260);
    rotate(radians(180)); //rotation to make the rectangle grow upwards
    rect(0, 0, 80, 120);
    fill(0, 75, 255);
    translate(5, 0);
    rect(0, 0, 70, mn*2);
    if (mn==59) { //when each the mn container is full, water is transferred to the hr contatiner
        translate(-30, 115);
        stroke(0, 100, 255);
        strokeWeight(5);
        line(-8, 0, 30, 0);
        stroke(0, 0, 255);
        line(-8, 0, -8, -115);
    }
    pop();

    //second
    noStroke();
    push();
    fill(255); 
    translate(100, 200);
    rotate(radians(angle)); //rotation to make the rectangle grow upwards
    rect(0, 0, 40, 60);
    fill(0, 150, 255);
    translate(5, 0);
    rect(0, 0, 30, sc);
    if (sc==59) { //when each the sc container is full, water is transferred to the mn contatiner
        translate(-30, 57.5);
        stroke(0, 150, 255);
        strokeWeight(3);
        line(-8, 0, 30, 0);
        stroke(0, 100, 255);
        line(-8, 0, -8, -115);
    }
    pop();
}


Looking Outwards 06: Randomness

This week’s topic of projects regarding randomness is probably my favorite so far. As randomness in art is open ended and up to the audience’s interpretation, it gives a much more interactive aspect to observing projects. A specific work I want to focus on is Jackson Pollock’s work. He was a major figure in the expressionist movement and widely appreciated for his contemporary art and recently has a memorial exhibition at MoMA. His methods of creating art were largely using the “drip technique” which were random pouring of paints onto the canvas. These methods create randomized artworks where no two pieces would be the same. Another influence onto his paints would be that between 1947 and 1950 was the “drip period” where these techniques were popular. My favorite specific piece from artist Pollock would be “number 1” as it is the first drip technique painting he made, using thinned paint and cans of commercial enamel. It is veru interesting to me how a random method and progress to create a piece would result in something so famous and well known.

Looking Outwards 06: Randomness

Project Title: Arcs04-01

Year of Creation: 2011

Artists: Marius Watz

Arcs04-01 is part of the Random Number Multiples collection that takes computer produced visuals and translates them to prints.

I admire the vibrant colors used in this project and how the shapes of the lines flow such that it looks like the 2D print just stopped the art midway through. I admire this because it feels like the art was in motion and the audience just happened to catch a snapshot of an ongoing thing. The placement of each of the red, blue and yellow lines are random but I like how the colors are kept within these three. The creator didn’t use just any colors and I admire this artistic decision because it brings some overall cohesion to the project. The work uses “pseudo-random compositions” of branching out shapes that are distorted by a 3D surface to mimic a sense of movement while maintaining a central focal point. Watz uses software to produce a computational image and then places in aspects of randomness either through the colors or shapes. The creator connects generative art with “dynamic processes,” so in the final form of the work it gives the impression of never being static. The artist’s logic borrows from biomimicry so his art form seems to be in the process of developing and being undone.