project-09-portrait

For this assignment I chose to use a colorful picture of a high school friend.
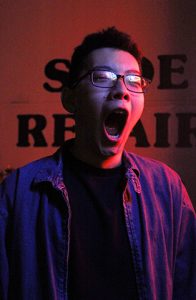
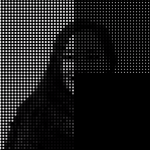
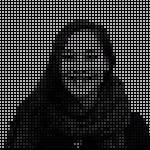
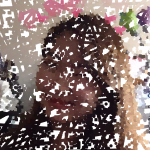
Initially, I wanted the interaction to be like painting on a canvas; as the mouse drags, part of the image appears. However, I felt that given the small size of the squares that appear while “painting”, it would take too long to paint the entire image. Therefore, I added random squares that would simultaneously appear as mouse drags and paints.

At first, I also randomized the size of the squares, however the random larger squares were too large and not detailed enough to create the image.
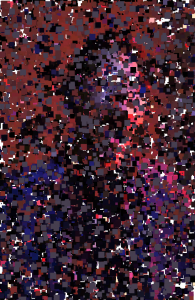
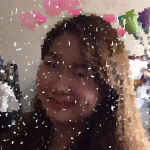
Then, I changed the size of the dots to be consistently small and decided to add two more lines of squares that would appear to the upper right and lower left of the mouse as it dragged. I also sped up the appearance of the random dots.

sketch

var photo;

function preload(){
    var URL = "https://i.imgur.com/wxV6HZw.jpg"; //image URL
    photo = loadImage(URL); //loaded image into variable
}

function setup(){
    createCanvas(314, 480);
    background(255); //black background
    frameRate(500); //sped up the frame rate
}

var rSize = 3;

function draw(){
	noStroke(); //no outline
	fill(photo.get(mouseX, mouseY)); //fill of square is color of background photo
	var locX = random(0, width); //random x coordinate
	var locY = random(0, height); //random y coordinate
	rect(locX, locY, rSize, rSize); //draw square
}

function mousePressed(){
	fill(photo.get(mouseX, mouseY)); //fill of square is color of background photo
	rect(mouseX, mouseY, rSize, rSize); //square drawn when mouse is clicked
	fill(photo.get(mouseX - 50, mouseY + 50, mouseY)); //fill of square is color of background photo
	rect(mouseX - 50, mouseY + 50, rSize, rSize); //square drawn towards upper right 
	fill(photo.get(mouseX + 50, mouseY - 50)); //fill of square is color of background photo
	rect(mouseX + 50, mouseY - 50, rSize, rSize); //square drawn towards lower left
}

function mouseDragged(){
	fill(photo.get(mouseX, mouseY)); //fill of square is color of background photo
	rect(mouseX, mouseY, rSize, rSize); //squares drawn as mouse is dragged
	fill(photo.get(mouseX - 50, mouseY + 50)); //fill of square is color of background photo
	rect(mouseX - 50, mouseY + 50, rSize, rSize); //squares drawn towards upper right
	fill(photo.get(mouseX + 50, mouseY - 50)); //fill of square is color of background photo
	rect(mouseX + 50, mouseY - 50, rSize, rSize); //squares drawn towards lower left
}

rkondrup-Looking-Outwards-09

Upon discovering the work of Beeple, as reviewed by danny noh in Looking Outwards, I was amazed at the idea of the projects which this man undertakes every SINGLE DAY, FROM SCRATCH. Honestly the things he draws would take me months, yet somehow the man produces amazing AMAZING graphic work at an incredible pace and without falling into stylistic ruts or creative dead-ends. I only wish danny noh had better stressed how unbelievably intricate and beautiful and amazing this work is, considering the production rate of one EVERY SINGLE DAY wowza. For 3308 consecutive days !
The idea of this project as a continuous daily task is one which I am a big fan of because building up a library of work which is a visual, tangible reminder of one’s progress in a task like graphic design is something which produces a concrete sense of accomplishment and meaning. Personally, I would like to pursue a similar sort of project initiative in order to further my own design skills and build a portfolio of completed work.


afukuda-Project09

sketch

/* 
 * Name | Ai Fukuda 
 * Course Section | C 
 * Email | afukuda@andrew.cmu.edu
 * Project | 09
 */ 

var underlyingImage; 

function preload() {  // load image 
    var myImageURL = "https://i.imgur.com/HE5yzx9m.jpg";
    underlyingImage = loadImage(myImageURL);
}

function setup() {
    createCanvas(300, 300);
    background(0);
    underlyingImage.loadPixels(); // load pixel data of image 
    frameRate(15);
}

function makeCorner(x, y) {  // x-coordinate & y-coordinate 
    noStroke();
        for (var i=0; i<width; i+=6) {                      // horizontal lines of dots 
            var colorLocationH = underlyingImage.get(i, y); // gets color value of image at (i,y)

            noStroke();
            fill(colorLocationH);                           // fills circles with color of image at (i,y)
            ellipse(i, y, 2, 2);

                                                            // vertical lines of dots 
            var colorLocationV = underlyingImage.get(x, i); // gets color value of image at (x,i)

            noStroke();
            fill(colorLocationV);                           // fills circles with color of image at (x,i)
            ellipse(x, i, 4, 4);
        }
}

var timer = 0;

function draw() {             // draw at a defined time (0, 6, 12, etc.)
   makeCorner(timer, timer);
   timer += 6;
}


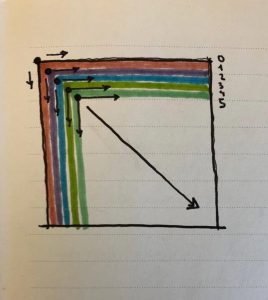
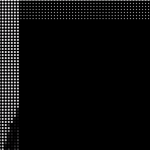
Using the sample code given for this project as a starting point, I wanted to create more directionality & structure in how the points aggregated to create the underlying portrait. Starting at the top-left corner of the canvas, I wanted the pixels to aggregate horizontally until the edge of the canvas, then vertically (see sketch). I ended up writing a code which does all the horizontal and vertical pixels in each row simultaneously, however, through the variance in point sizes I was able to make the aggregate of the pixels more engaging and interesting and am overall content with the result.


cduong-Looking Outward 09

Ryu’s Looking Outward : https://courses.ideate.cmu.edu/15-104/f2017/2017/09/02/rkondrup-looking-outwards-01/

Link: https://hackaday.com/2017/08/08/a-hypnotizing-interactive-art-piece-for-visualizing-color-theory/


The video shows the colors being put in each cylinder and shows how it changes the drawing on the screen.

This project is to better understand the RGB theory and make it more tangible by using physical paint mixing. They used three water-filled containers (one red, green, and blue) to adjust the colors on the screen in a drawing.

I agree with Ryu’s thoughts about the project when he talks about how this is an effective method for communicating the abstract idea of RGB color. They make it very clear what is happening in the painting by adding one color at a time in the cylinders and seeing the colors change gradually on screen. Something that he didn’t mention that I feel is that this gives people a better understanding of how each color, RGB, can affect how a person is feeling when looking at a painting. In the GIF you can see that it starts out as blue and then ends with having red too, which changes a cool feeling to a warm feeling and really allows the viewer to understand how much color can affect how they feel when looking at something.

karinac-Project-09

karinac-Project-09

//Karina Chiu
//Section C
//karinac@andrew.cmu.edu
//Project-09

var portrait;
var x = 230;
var y = 0;


function preload() {
    var portraitURL = "https://s1.postimg.org/1qix3ahu5r/IMG_6211.jpg";
    portrait = loadImage(portraitURL);
}

function setup() {
    createCanvas(230, 300);
    background(229,203,170);
    portrait.loadPixels();
    frameRate(60);

}

function draw() {
    //finding color
    var px = x;
    var py = y;
    var ix = constrain(floor(px), 0, width);
    var iy = constrain(floor(py), 0, height);
    var colorOfPoint = portrait.get(ix, iy);

    //generates waterfall effect
    push();
    y += 2.5;
    noStroke();
    fill(colorOfPoint);
    rect(x, y, 2, 2);
    pop();

    if (y > height) {
        x -= 2.5;
        y = 0;
    }
}

This is a portrait of my friend, Amara. At first, I really wanted to code a waterfall effect into the picture, but I was unsuccessful. Still, I spent a lot of time of this project and learned a lot, and I am pleased with the results.

rgroves – Looking Outwards 09

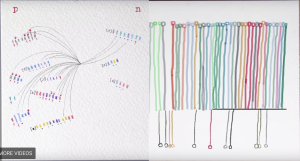
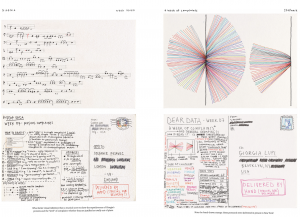
For this Looking Outwards I read Isadora Krsek’s post about Giorgia Lupi and Stephanie Posavec’s eyeo talk, which focused on their year long project Dear Data. She did a great job going into detail about the two artist’s backgrounds and careers, which helped explain why the two would be so attracted to collaborating with each other. They are both extremely successful and knowledgable in the fields of design and data representation, and all that combined experience allowed this project to become something really beautiful. The only thing I would change from Isadora’s post would be to include some pictures of the postcards, which are incredibly beautiful, intricate, and painstaking. It’s also fascinating how the two of them come up with methods of representing the same kinds of data. Sometimes they come up with very similar methods, like in drawing that represents times they loved their SOs versus times they were annoyed by them:

Other times, like in these drawings which track all the times the two artists complained, it’s impossible to tell that the two drawings represent the same kind of data.

Considering they made 52 postcards, this project is an absolute goldmine of inspiration for anyone interested in data or data art.

I should also mention that I love the double meaning of the title, which both references the medium of postcards and the love the artists have for data itself.

https://courses.ideate.cmu.edu/15-104/f2017/author/ikrsekandrew-cmu-edu/

ziningy1 – section c – project 09

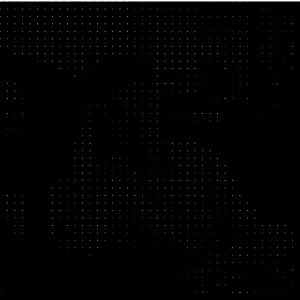
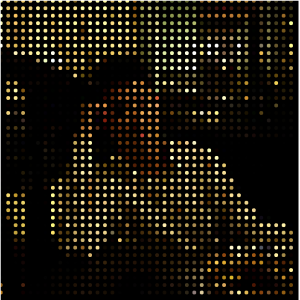
After being inspired by Professor Golan’s work, I decided to approach this project by laying a grid of circles on the picture. The grid using the nested for loop will create a sense of geometric order of the display. I also find it interesting that I can play with the visibility of the content by adjusting the size of the circles. So I added the Mouse Pressed so that when pressed the circle will become larger, which will gradually shows a clearer version of the picture.

*Please load my project in Safari browser, the chrome browser does not really load, thanks.

First look

After few clicks

After more clicks

sketch 

//Zining Ye 
//15104 lecture 1 recitation C
//ziningy1@andrew.cmu.edu 
//Project-08

var backimage;

var size1=1; 

function preload() { //preload the image 
    var ImageURL = "https://i.imgur.com/JuT5ojz.jpg"
    backimage = loadImage(ImageURL);
}

function setup() {
    createCanvas(400, 400);
    background(0);
    
    backimage.loadPixels(); //load the pixel of the images 


}

function draw() {

    var space1=10; //spacing of the balls 

    //creating a for loop the circle grids 
    for(var i=0;i < 50; i++){ 

        for(var j=0; j < 50; j++ ){

            
            var ex=i*space1;
            var ey=j*space1; 
            var space=10;
            var brightness = backimage.get(ex,ey) // gets the color from the back image 
            fill(brightness); //fill the color 
            noStroke(); 
            ellipse(ex,ey,size1,size1); // draw the circles 
            
        }
    }
    
}

function mousePressed(){

    size1+= 2 // when mouse pressed the circles become larger so that the image become clearer


}


danakim-LookingOutwards-09

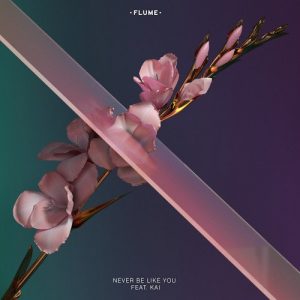
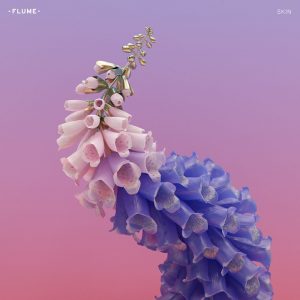
Claire’s Looking Outward post on Flume’s “Skin” album cover caught my eye as I was scrolling through her page. In my opinion, Zawada did an excellent job in successfully representing this relationship between the music and the album cover art for “Skins”. The contrast between organic and synthetic is directly shown through Zawada’s use of soft and hard textures alongside the soft and vibrant colors that emphasize these textures. I agree with Claire when she says that Zawada’s use of mathematical programming to create organic objects is ironic. I feel that Zawada was able to show the potential and complexity of computer programming by recreating a natural object that looks so realistic.

“Skin”; Jonathan Zawada


“Skin”; Jonathan Zawada

Claire Koh’s Looking Outward 09

Behind Cover The Art Flume’s Grammy Winning Album


kyungak-project-09-portrait

sketch

//Kyunga Ko
//15104B
//kyungak@andrew.cmu.edu
//Project 09

var selfportrait; //self portrait image
var x = []; //x position array
var y = []; //y position array
var dx = []; //x velocity array
var dy = []; //y velocity array

function preload() {
    var imageURL = "https://i.imgur.com/pvmAYGW.jpg"
    selfportrait = loadImage(imageURL); // preloads the image
}

function setup() {
  createCanvas(480, 480);
  noStroke();

  //for loop for assigning random values for x,y,dx,dy
  for (var i=0; i<150; i++) {
        x.push(random(width));
        y.push(random(height));
        dx.push(random(-10,10));
        dy.push(random(-10,10));
  }
}

function draw() {
  //image(selfportrait,-250,-50);

  //for loop for 
  for (var j=0; j<x.length; j++) {
    //pixel colors from image is stored into x and y array
    var color = selfportrait.get((x[j]+250), y[j]+50);
        //canvas is filled with image color
        fill(color);
        //ellipse fills the canvas + random movements with dx,dy
        ellipse(x[j],y[j],10,10);
        x[j]+=dx[j];
        y[j]+=dy[j];
    }

    //xpos and ypos is determined by mousex and mousey
    var xpos = floor(mouseX);
    var ypos = floor(mouseY);
    //color is assigned to mousex and mousey
    var color = selfportrait.get((xpos+250), ypos+50);

    fill(color,25);
    noStroke();
    //according to mouse position canvas is colored
    rect(xpos,ypos,10,10);

}


1                               2                              3

  1. A loop of 150 ellipses initially color the canvas
  2. MouseX and MouseY function is used to fill in the blanks
  3. Final portrait is done

For this project, I was able to reuse functions and skills that I previously learned from this class. I set up a series of position and velocity arrays to form a loop of circles that randomly moved across the canvas with the image colors. After most of the image was colored, you can also custom color the blanks with the mousex and mousey function. I thought this project was really interesting, and I am pretty satisfied with the result.

alchan-Project 09-portrait

portrait

var portraitImg;
var rotateAngle;

function preload() {
    var portraitLink = "https://i.imgur.com/pn2LErg.jpg";
    portraitImg = loadImage(portraitLink);
}

function setup() {
    createCanvas(480,480);
    portraitImg.loadPixels();
}

function draw() {
    background(0);
    for(var y = 0; y <= height; y+=15) {
      for(var x = 0; x <= width; x+=15) {
        var pixelColor = 10 + brightness(portraitImg.get(x, y));
        var mouseDist = dist(mouseX, mouseY, x, y);
        strokeWeight(map(mouseDist, 0, 679, 0.5, 8));
        stroke(pixelColor);
        push();
        translate(x, y);
        rotate(map(mouseDist, 0, 679, 0, 360));
        line(0-3, 0, 0+3, 0);
        pop();
        line(x, y-3, x, y+3);
      }
    }
}

For my portrait, I knew I wanted to have the entire picture rendered at first, and user interaction to change the portrait somehow. I decided to go with a somewhat abstract grid of crosses to represent the picture at first, using the source image’s brightness values instead of colors to create a more cohesive image. (The source image is an extremely cropped view of a face from the eyes up, in case you couldn’t make it out.) The crosses change thickness (and the horizontal bar rotates) depending on how far away the mouse is, obscuring areas of the image the mouse is closest to. Unfortunately the program runs a little slow for me, so it’s not quite the experience I had planned, but it’s as close as I could get.