enwandu-Looking Outwards-06-Randomness

Victor Adan, Jeff Synder and Daniel Iglesia – The Draftsmasters

A still of the pen plotter and 3D computation

The Draftmasters is a very interesting project. It is a video/ geek/ music collaboration between Victor Adan, and Jeff Synder on the performance side, and Daniel Iglesia on the visuals side. The way it worked was, Victor and Jeff made physical gestures, which directed the hacked pen-plotter printers. The printers were equipped with pickups, which make the sound. Then, Daniel analyzes the visuals and creates 3D graphics in real time.

The combination of motion and sound, being captured by the hacked pen plotters is an intriguing one. It simultaneously allows for control, and unrestricted randomness. The combination of the two undoubtable results in some very dynamic forms. You could control your movements, or have them be completely random, but the pen plotter will interpret these how it wants too. Same could be said for the sound involved. Watching the video, the 3D form generate by the moving pen plotter really shows the dynamism, and randomness of the project.

I really admire the project because of the intersection of computation and music. I’m truly fascinated by this area and would love to learn more. Projects like this are truly inspiring. Each of the members of the group seemed to have a specialty with Synder and Adan being musicians, and Iglesia being the visual person. The projects seems to embody a synthesized ideal that could have come from all three.

heeseoc-LookingOutwards-06

I found this website by a computational mathematician Andrej Bauer, that generates a random artwork when you put in the title of your artwork. The name of the picture generates a number that is used to construct a mathematical formula. The formula then determines the color of each pixel in the picture. Therefore, it is not that this website gives you any kind of picture whenever you press the button, but the same name generates the same picture, which proves that it is being operated under some type of algorithm. I thought this was interesting because it is interactive, fun to look at, and I personally admired how different each pictures came out. They had completely different tones, textures, and overall vibes, which did not always reflect the title, but the part that I am the one who interprets the picture was another part that was fun about this website.

http://www.random-art.org/online/


hannajan-LookingOutwards06

For this Looking Outward Post, I found an artist who made beautiful quilts based on randomness. Susan of SKquiltlabs made the particular quilt (pictured above named “Random Vector”) from a layout that is based on a random number generator for pattern orientation.

A lot is not said on the site I found Susan’s works, about the algorithms used for randomness. However, it does mention a random number generator is involved in some way.

The creator’s artistic sensibilities are manifest in the final form through the way the randomly generated pieces fall together so effortlessly. There are no signs of messiness or lack of care, although that sometimes may be assumed when “randomness” is involved. There is a natural pattern in her art through the randomness.

This reminds me that although future assignments in this class may require some level of randomness generating, the artist has a certain level of control over how the final art piece turns out. It is ultimately up to the artist in how much control they choose to exert.  

LookingOutwards-06-sjahania

I asked my friends if they knew of any randomly generated art projects, and someone brought a 15-112 project to my attention. Lingdong Huang (a student at Carnegie Mellon) created a procedurally generated world for a side scroll game called Hermit. He created beautiful three-dimensional landscapes that interact with one another and have some sort of depth.

If I am understanding it correctly, the artist coded a few shapes, and then randomly generated the rest of the pictures. So there are millions of different random combinations of shapes to create the tree, the ground, and the things the character and his horse can do.


This is the video that Lingdong Huang posted for his project. It is very dramatic.

Project-06-Abstract-Clock-sjahania

sketch

function setup() {
    createCanvas(400, 450);
}

function draw() {
    background(255, 239, 213);
    noStroke();
    
    // Fetch the current time
    var H = hour();
    var M = minute();
    var S = second();

    //Glass streaks
    stroke(0);
    line(100, 150, 115, 135);
    line(100, 155, 120, 135);
    line(105, 155, 120, 140);

    line(220, 150, 235, 135);
    line(220, 155, 240, 135);
    line(225, 155, 240, 140);

    line(340, 150, 355, 135);
    line(340, 155, 360, 135);
    line(345, 155, 360, 140);
    
    // Compute the widths of the rectangles
    var mappedH = map(H, 0,23, 0, 300);
    var mappedM = map(M, 0,59, 0, 300);
    var mappedS = map(S, 0,59, 0, 300);

    //Display glasses
    noFill();
    stroke(0);
    rect(30, 100, 100, 300);
    rect(150, 100, 100, 300);
    rect(270, 100, 100, 300);
    
    // Display the rectangles. 
    fill(47, 184, 255);
    quad(30, 400 - mappedH, 130, 400 - mappedH, 130, 400, 30, 400);
    fill(47, 132, 255);
    quad(150, 400 - mappedM, 250, 400 - mappedM, 250, 400, 150, 400);
    fill(47, 46, 255);
    quad(270, 400 - mappedS, 370, 400 - mappedS, 370, 400, 270, 400);

    //Glass bases
    fill(0);
    rect(30, 390, 100, 10);
    rect(150, 390, 100, 10);
    rect(270, 390, 100, 10);

    //Water drops
    fill(47, 184, 255);
    ellipse(80, 50, 50, 50);

    fill(47, 132, 255);
    ellipse(200, 50, 50, 50);

    fill(47, 46, 255);
    ellipse(320, 50, 50, 50);

    // Display numbers to indicate the time
    fill(255);
    textAlign(CENTER);
    textSize(15);
    text(H, 80, 50);
    text(M, 200, 50);
    text(S, 320, 50);


}

I really like the glass half-empty and glass half-full idea, and how it gets harder to see things as glass half-full as time runs out. So I flipped it, and made it so the glasses fill with water as time goes on. It took me a while to figure out how map() works, but I eventually got it.

LookingOutwards06-jooheek

Marius Watz: Random Numbers

Link: https://creators.vice.com/en_us/article/vvzxkb/random-numbers-screen-printed-generative-art-nyc-event

Marius Watz “Arcs04-01” from the series Random Numbers Multiples

In the project, Random Numbers, Marius Wats, a generative artist, collaborates with Jer Thorp to create a series of visualizations that demonstrates data of random numbers. They described that their project is about “pseudo-random compositions of radial shapes, subtly distorted by a 3D surface that lends the image a strong focal point and sense of movement.”

Marius Watz “Arc04-00” from the series Random Numbers Multiples

I think that the randomness of this artwork really adds to the aesthetic of the piece. The artist combines two factors that are usually not juxtaposed together: randomness and data. Data is something that is really not random but by adding randomness to it, the artist demonstrates an aesthetic for the visualization.

jooheek-Project06-AbstractClock

Blender making peach and lemon smoothie

sketch

//JooHee Kim
//jooheek@andrew.cmu.edu
//Section E
//Project06

function setup() {
    createCanvas(480, 480);
    angleMode(DEGREES);
	ellipseMode(CENTER);
    rectMode(CENTER);
}

function draw() {
	//variables for each seconds, minutes, and hours
	var S = second();
    var M = minute();
    var H = hour();

	background(245, 245, 220);

	//start of graphics for blender background
	//blender handle
	fill(200, 200, 200);
	noStroke();
	rect(20, height/2, 40, 40);

	//whole blender
	fill(240, 240, 240, 140);
	stroke(200, 200, 200);
	strokeWeight(10);
	rect(width/2, height/2, 400, 400, 100);

	//blender base
	fill(220, 220, 220);
	noStroke();
	rect(width/2, height/2, 150, 150, 50);

	//blender center circle piece
	fill(200, 200, 200);
	stroke(180, 180, 180);
	strokeWeight(5);
	ellipse(width/2, height/2, 50, 50)

	//blender knife star
	beginShape();
	vertex (width/2, height/2 - 30);
	vertex (width/2 + 10, height/2 - 10);
	vertex (width/2 + 30, height/2);
	vertex (width/2 + 10, height/2 + 10);
	vertex (width/2, height/2 + 30);
	vertex (width/2 - 10, height/2 + 10);
	vertex (width/2 - 30, height/2);
	vertex (width/2 - 10, height/2 - 10);
	vertex (width/2, height/2 - 30);
	endShape();

	//measurement marks at side of blender
	noStroke();
	var x = width/2 + 100;
	for (var i = 1; i <= 6; i += 1) {
		rect(x, height/2, 3, 10*i);
		x += 20;
	}
	//center line going through measurement marks
	stroke(200, 200, 200);
	strokeWeight(3);
	line(width/2 + 100, height/2, width/2 + 180, height/2);

	//HOURS
	//changing from 24 hour to 12 hour clock
	var H = hour()%12;
	if (H == 0) {
		H = 12;
	}

	//making pink transparent juice get larger proportionate to the hour
	noStroke();
	fill(255, 180, 160, 125);
	rect(width/2, height/2, 33*H, 33*H, 50 + H);

	//SECONDS
	//rotates 4 peaches in the middle by seconds
	push();
	translate(width/2, height/2);
	rotate(6*S);
		for (peachY = -40; peachY <= 40; peachY += 80) {
			for (peachX = -40; peachX <= 40; peachX += 80) {
				fill(245, 142, 80);
				ellipse(peachX + 10, peachY, 70, 70);

				fill(245, 162, 100);
				ellipse(peachX, peachY, 70, 70);

				fill(64, 183, 75);
				ellipse(peachX + 10, peachY - 35, 10, 5);

				fill(245, 182, 120);
				ellipse(peachX + 15, peachY - 15, 15, 15);
			}
		}
	pop();

	//MINUTES
	//rotates 2 lemons by minutes
	var Mmap = map(M, 0, 60, 0, 360);

	push();
	translate(width/2, height/2);
	rotate(Mmap);
	for (lemonX = -125; lemonX <= 125; lemonX += 250) {
			fill(240, 229, 90);
			ellipse(lemonX + 55, 0, 20, 15);

			fill(240, 229, 90);
			ellipse(lemonX - 55, 0, 20, 15);

			fill(250, 239, 100);
			ellipse(lemonX, 0, 110, 90);

			fill(255, 249, 120);
			ellipse(lemonX + 20, - 20, 30, 20);
	}
	pop();

}

I got inspiration from my previous project and decided that I wanted to do something fruit related again. To show time, I wanted to have things rotate according to the hours, minutes, and seconds. When thinking of fruits and rotation, I thought of fruits in a blender. Therefore, I chose the peach and lemon and made the peach go according to the seconds and the lemon according to the minutes. After thinking about what to do for the hour, I figured out I could make the juice that the peach and lemon make rise according to the hours.

heeseoc-Project-06-AbstractClock

sketch

//Steph Chun
//15-104 section #A
//heeseoc@andrew.cmu.edu
//Project-06

function setup() {
    createCanvas(400, 400);

}

function draw() {
	background(19,43,90);
	noStroke();
	angleMode(DEGREES);
	textAlign(CENTER);

	var hr = hour();
    var mn = minute();
    var sc = second();

    fill(235,226,211);
	text("happy birthday!", width/2, 40);

	//cake//
	var hrAngle = map(hr, 0, 12, 0, 360);
	fill(235,226,211);
	rect(40,height/2+75,320,150);
	fill(255,248,235);
	ellipse(width/2,height/2+75,320,100);

	//making the clock based on 12 hour//
	if (hr == 0) { 
        hr = 12; 
	    } else if (hr > 12 & hr < 24) { 
	        hr -= 12; 
	    } else { 
	        hr = hour(); 
	    }

    var maphr = map(hr, 0, 12, 0, 300);

    //making the candles appaear each hour//
	for (var i = 1; i <= maphr; i += 25) {

		var canw = 5;
	    var canh = 150;

	    var mappedmn = map(mn, 59,0, 0,canh);

				//flickers every other second//
				if(second() % 2 == 0){ 
					fill(random(100,255), random(100,255), random(200,255), 60);
					ellipse(i+62.5, height/2-100+canh-mappedmn, 75, 75);
				} else {
					fill(random(100,255), random(100,255), random(200,255), 20);
					ellipse(i+62.5, height/2-100+canh-mappedmn, 75, 75);
				}

			//candle body//
			fill(154, 188, 255);
			rect(i-canw/2+62.5, height/2+canh/2, canw, -mappedmn);
			ellipse(i+62.5, 275, canw, canw/3);
			fill(126, 162, 233);
			ellipse(i+62.5, 275-mappedmn, canw, canw/3);

			//fire//
			fill(random(100,255), random(100,255), random(200,255));
			ellipse(i+62.5, height/2-95+canh-mappedmn, 15, 30);

			fill(255,250,200);
			ellipse(i+62.5, height/2-90+canh-mappedmn+2.5, 5, 15);

}

}


When I read the term “day-long animation” in the instructions, I immediately thought of birthday, and started to wonder a way to visualize a birthday as a clock. Then, I got an idea of a candle, which I thought was a perfect way to show the passing time because the size actually shrinks, and for this project, since I needed different variables that represent different units of time (such as seconds, minutes, and hours), I thought that I would be able to manipulate the number of the candles and the flickering fire to represent those different variables. The candles flicker every other second, shrink as a minute passes, and adds as an hour passes.

svitoora – 06 – Relative Time

sketch

// 
// Supawat Vitoorapakorn
// Svitoora@andrew.cmu.edu
// Section E
// 
// Relative Time
//
// This program is a spin-off from
// p5.js program for a very simple "abstract clock"
// Golan Levin, for 15-104 & 60-212

var w = 400;
var h = 400;

var H;
var M;
var S;
var mappedH;
var mappedM;
var mappedS;
var curSec;

var STATS = [];
var prev_stat;
var cur_stat;


// Statistics as objects:
// Internet
var stat_0 = {
		event: 8,
		mod_sec: 1,
		event_per_sec: null,
		cycle_time: null,
		text: "new people have joined the internet."
	}
	//Rape
var stat_1 = {
	event: 1,
	mod_sec: 90,
	event_per_sec: null,
	cycle_time: null,
	text: "women have been raped in the US."
}

// Tree
var stat_2 = {
		event: 150,
		mod_sec: 60,
		event_per_sec: null,
		cycle_time: null,
		text: "football fields of tree is lost."
	}
	// Cool Math Games
var stat_3 = {
		event: 3350000,
		mod_sec: 30 * 24 * 60 * 60,
		event_per_sec: null,
		cycle_time: null,
		text: "internet searches have been for cool math games."
	}
	// Donut
var stat_4 = {
		event: 10000000000,
		mod_sec: 365 * 24 * 60 * 60,
		event_per_sec: null,
		cycle_time: null,
		text: "doughnuts have been made."
	}
	// Drop Out
var stat_5 = {
	event: 7000,
	mod_sec: 60 * 60,
	event_per_sec: null,
	cycle_time: null,
	text: "highschool students have dropped out."
}

// Death
var stat_6 = {
	event: 6316,
	mod_sec: 60 * 60,
	event_per_sec: null,
	cycle_time: null,
	text: "people have died."
}

// Array of all Statistics
STATS = [stat_0, stat_1, stat_2, stat_3, stat_4, stat_5, stat_6];

// Converts event_per_sec to number of x happening in 1 second
function process_STATS() {
	for (i in STATS) {
		STATS[i].event_per_sec = STATS[i].event / STATS[i].mod_sec
			// Time it takes to complete 1 cycle in milliseconds
		STATS[i].cycle_time = (STATS[i].mod_sec / STATS[i].event) * 1000
	}
}


//--------------------------
function setup() {
	createCanvas(500, 500);
	process_STATS();
	cur_stat = STATS[1];
	prev_stat = cur_stat;
}


// Gives total time in second since midnight.
function total_seconds() {
	curSec = (hour() * 60 ** 2) + (minute() * 60) + second();
}

// Draws the clock based on the input statistic.
function draw_clock(stat) {
	noStroke();
	// Fetch the current time
	var S = second();
	var M = millis();
	var delta = .05; // for easing

	// Compute Clock hand with easing
	if (abs(prev_stat.cycle_time - cur_stat.cycle_time) > 40) {
        // if statement above helps removes jitter from easing
		var DELTA = abs(prev_stat.cycle_time - cur_stat.cycle_time);
		if (prev_stat.cycle_time <= cur_stat.cycle_time) {
			prev_stat.cycle_time += DELTA * delta
		} else {
			prev_stat.cycle_time -= DELTA * delta
		}
		mappedS = map(M, 0, prev_stat.cycle_time, 0, 1);
	} else {
		mappedS = map(M, 0, cur_stat.cycle_time, 0, 1);
	}

	// My clock
	angleMode(DEGREES);
	ellipse(w / 2, h / 2, w / 2, w / 2);
	// Draw second hands
	stroke(0);
	strokeWeight(1);
	line(w / 2, h / 2,
		(w / 2) + cos((mappedS * 360) - 90) * (w / 4) * .95,
		(w / 2) + sin((mappedS * 360) - 90) * (w / 4) * .95);

	// Create Text
	fill(255, 255, 255, 255 * .75);
	noStroke();
	textAlign(CENTER);
	textSize(11.25);
    text("Since midnight, " + nfc(floor(stat.event_per_sec * curSec)) +
		" " + stat.text,
		w / 2, h * .85)
    text("Please click for different statistic.",
        w / 2, h * .9)
}

// Randomly select a statistic that isn't the current one.
function mousePressed() {
	prev_stat = cur_stat;
	do {
		cur_stat = random(STATS)
	}
	while (cur_stat == prev_stat);
	process_STATS();
}


//--------------------------

function draw() {
	background(200, 200, 200);
	noStroke();
	draw_clock(cur_stat);
	total_seconds();
}

Relative Time

Statistics of absurd scales are often hard to wrap your mind around. As a designer, I’m interested in ways to help people understand information in the most intuitive way possible so that they can make the best decision. This Relative Time clock is an abstract clock that re-maps itself to a randomly selected statistic that I found on the internet. Some statistics are plain depressing, and some are just for laughs. I hope that this temporal data visualization can all help us better understand our world.

Quick sketch on a receipt.

enwandu-Project-06-Abstract Clock

sketch

// Emmanuel Nwandu
// enwandu@andrew.cmu.edu
// Section
// Project-06- Abstract Clock

var bgColmin = (0, 255, 255);
var bgColmax = (92, 26, 102);

// X and Y positions of the lights controlled by the minutes
var xarray = [62, 73, 98, 86, 150, 170, 175, 102, 95, 62, 293, 298, 287, 367, 31, 70, 177, 203, 265, 278, 82, 55, 85, 94, 142, 151, 176, 83, 59, 60, 147, 177,
     93, 80, 68, 64, 373, 320, 296, 270, 315, 309, 267, 200, 98, 84, 40, 98, 108, 293, 301, 377, 354, 257, 197, 169, 205, 292, 232, 173];
var yarray = [47, 78, 116, 50, 202, 217, 191, 104, 88, 280, 195, 252, 155, 253, 320,303, 235, 270, 296, 312, 132, 110, 75, 97, 289, 251, 319, 149, 150, 176, 230, 261,
    172, 192, 248, 194, 230, 261, 324, 310, 174, 184, 217, 216, 235, 211, 312, 287, 293, 324, 292, 280, 298, 317,267, 260, 283, 290, 313, 329, 318];

function setup() {
    createCanvas(400, 400);
}

function draw() {
var milli = map(millis(), 0, 999, -35, width + 35);
var sec = map(second(), 0, 59, -35, width + 35);
var min = map(minute(), 0, 58, 0, 255);
var hrND = map(hour(), 0, 11, bgColmax, bgColmin);
var hrDN = map(hour(), 12, 23, bgColmin, bgColmax);
// var hrMoon = map(hour(), 0, 11, 250, Sun);
// var hrSun = map(hour(), 12, 23, Sun, 250);


var timeND = {r:min, g:sec, b:hrND};
var timeDN = {r:min, g:sec, b:hrDN};
// var timeSun = {r:min, g:sec, b:hrSun};
// var timeMoon = {r:min, g:sec, b:hrMoon};

var hrNDColor = color(0, 0, timeND.b);
var hrDNColor = color(0, 0, timeDN.b);
// var hrSunColor = color(timeSun.b, timeSun.b, 0);
// var hrMoonColor = color(timeMoon.b, timeMoon.b, 0);

var gray = color(240);

// Maps the sky/background color to the hours of the day
// Simulating dark to light, and light to dark depending on the time of day
for(var c = 0; c <= height; c+=5){
    var amt = map(c, 0, height, 0, 1);
    var background = lerpColor(hrNDColor, gray, amt);
    fill(background);
    rect(0, c, width, 5);
    if(int(hour()) >= 12){
        hrNDColor = hrDNColor;
    }
}
// Draws Sun/Moon
    fill(200, 170, 0);
    ellipse(width, 0, 175, 175);

// Calls blimp function; Blimp movement contolled by seconds
    blimp(sec, height/10);

// Draws Skyline
    fill(0);
    noStroke();
    strokeJoin(MITER);
    beginShape();
    vertex(0, 400); vertex(0, 306); vertex(4, 306);
    vertex(4, 292); vertex(31, 292); vertex(31, 282);
    vertex(50, 282); vertex(50, 30); vertex(60, 30);
    vertex(60, 20); vertex(103, 20); vertex(103, 30);
    vertex(116, 30); vertex(116, 282); vertex(128, 282);
    vertex(128, 304); vertex(132, 304); vertex(132, 268);
    vertex(140, 268); vertex(140, 190); vertex(169, 190);
    vertex(169, 185); vertex(189, 185); vertex(189, 226);
    vertex(202, 226); vertex(206, 185); vertex(208, 226);
    vertex(216, 226); vertex(216, 216); vertex(226, 216);
    vertex(226, 226); vertex(232, 226); vertex(232, 306);
    vertex(244, 306); vertex(244, 199); vertex(252, 199);
    vertex(252, 139); vertex(260, 139); vertex(260, 127);
    vertex(295, 127); vertex(295, 139); vertex(305, 139);
    vertex(305, 170); vertex(330, 170); vertex(330, 306);
    vertex(365, 306); vertex(365, 250); vertex(390, 250);
    vertex(390, 306); vertex(400, 306); vertex(400, 400);
    endShape();

// Draw a new light every minute
    for(var i = 0; i < int(minute()); i++){
        fill(200, 200, 0);
        rect(xarray[i], yarray[i], 7, 7);
    }
}

// Draws Blimp
function blimp(x, y){
    fill(200, 75, 175);
    quad(x - 20, y, x + 15, y, x + 7, y + 23, x -17, y + 23);
    fill(75)
    ellipse(x, y, 70, 35);
    triangle(x - 45, y -15, x - 25, y, x - 45, y + 15);
    fill(200, 75, 175);
    ellipse(x, y, 68, 15);
}

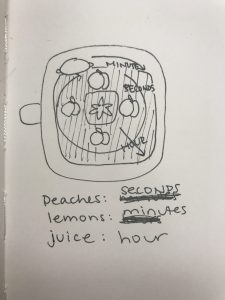
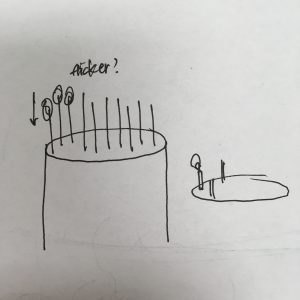
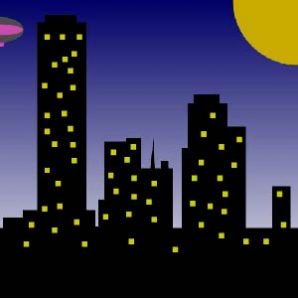
For this project I was aiming for something seemingly realistic. The background/sky color is controlled by the hours, moving from dark to light and vice versa as you move throughout the day. Every minute a light switches on in the building, and a blimp moves across the screen a certain distance every second.

It was somewhat challenging, but I learnt a lot from the experience.

// Emmanuel Nwandu
// enwandu@andrew.cmu.edu
// Section
// Project-06- Abstract Clock

var bgColmin = (0, 255, 255);
var bgColmax = (92, 26, 102);

var xarray = [55, 70, 100, 150, 175, 190, 207, 228, 262, 305, 55, 70, 100, 150, 175, 190, 207, 228, 262, 305, 55, 70, 100, 150, 175, 190, 207, 228, 262, 305, 55, 70,
    100, 150, 175, 190, 207, 228, 262, 305, 55, 70, 100, 150, 175, 190, 207, 228, 262, 305, 55, 70, 100, 150, 175, 190, 207, 228, 262, 305];
var yarray = [306, 306, 306, 285, 285, 285, 285, 285, 270, 270, 285, 285, 285, 270, 265, 275, 250, 250, 250, 270, 190, 190, 190, 200, 200, 215, 235, 235, 180, 180, 50, 50,
    50, 265, 300, 290, 255, 285, 175, 175, 100, 100, 110, 255, 235, 240, 295, 260, 160, 160, 145, 132, 149, 240, 272, 300, 306, 210, 150, 150];

function setup() {
    createCanvas(400, 400);
}

function draw() {
var milli = map(millis(), 0, 999, -35, width + 35);
var sec = map(second(), 0, 59, -35, width + 35);
var min = map(minute(), 0, 58, 0, 255);
var hrND = map(hour(), 0, 11, bgColmax, bgColmin);
var hrDN = map(hour(), 12, 23, bgColmin, bgColmax);
// var hrMoon = map(hour(), 0, 11, 250, Sun);
// var hrSun = map(hour(), 12, 23, Sun, 250);


var timeND = {r:min, g:sec, b:hrND};
var timeDN = {r:min, g:sec, b:hrDN};
// var timeSun = {r:min, g:sec, b:hrSun};
// var timeMoon = {r:min, g:sec, b:hrMoon};

var hrNDColor = color(0, 0, timeND.b);
var hrDNColor = color(0, 0, timeDN.b);
// var hrSunColor = color(timeSun.b, timeSun.b, 0);
// var hrMoonColor = color(timeMoon.b, timeMoon.b, 0);

var gray = color(240);

// Maps the sky/background color to the hours of the day
// Simulating dark to light, and light to dark depending on the time of day
for(var c = 0; c <= height; c+=5){
    var amt = map(c, 0, height, 0, 1);
    var background = lerpColor(hrNDColor, gray, amt);
    fill(background);
    rect(0, c, width, 5);
    if(int(hour()) >= 12){
        hrNDColor = hrDNColor;
    }
}
// Draws Sun/Moon
    fill(200, 170, 0);
    ellipse(width, 0, 175, 175);

// Calls blimp function; Blimp movement contolled by seconds
    blimp(sec, height/10);

// Draws Skyline
    fill(0);
    noStroke();
    strokeJoin(MITER);
    beginShape();
    vertex(0, 400); vertex(0, 306); vertex(4, 306);
    vertex(4, 292); vertex(31, 292); vertex(31, 282);
    vertex(50, 282); vertex(50, 30); vertex(60, 30);
    vertex(60, 20); vertex(103, 20); vertex(103, 30);
    vertex(116, 30); vertex(116, 282); vertex(128, 282);
    vertex(128, 304); vertex(132, 304); vertex(132, 268);
    vertex(140, 268); vertex(140, 190); vertex(169, 190);
    vertex(169, 185); vertex(189, 185); vertex(189, 226);
    vertex(202, 226); vertex(206, 185); vertex(208, 226);
    vertex(216, 226); vertex(216, 216); vertex(226, 216);
    vertex(226, 226); vertex(232, 226); vertex(232, 306);
    vertex(244, 306); vertex(244, 199); vertex(252, 199);
    vertex(252, 139); vertex(260, 139); vertex(260, 127);
    vertex(295, 127); vertex(295, 139); vertex(305, 139);
    vertex(305, 170); vertex(330, 170); vertex(330, 306);
    vertex(365, 306); vertex(365, 250); vertex(390, 250);
    vertex(390, 306); vertex(400, 306); vertex(400, 400);
    endShape();

    for(var i = 0; i < int(minute()); i++){
        fill(200, 200, 0);
        rect(xarray[i], yarray[i], 7, 7);
    }
}

// Draws Blimp
function blimp(x, y){
    fill(200, 75, 175);
    quad(x - 20, y, x + 15, y, x + 7, y + 23, x -17, y + 23);
    fill(75)
    ellipse(x, y, 70, 35);
    triangle(x - 45, y -15, x - 25, y, x - 45, y + 15);
    fill(200, 75, 175);
    ellipse(x, y, 68, 15);
}