![[OLD FALL 2017] 15-104 • Introduction to Computing for Creative Practice](../../../../wp-content/uploads/2020/08/stop-banner.png)
// Alvin Luk
// akluk@andrew.cmu.edu
// Section A
// Project 9
// variable to store the image
var img;
var cur_x;
var cur_y;
var rand_x;
var rand_y;
var rand_t;
var type_shape;
var pix;
var siz;
function preload(){
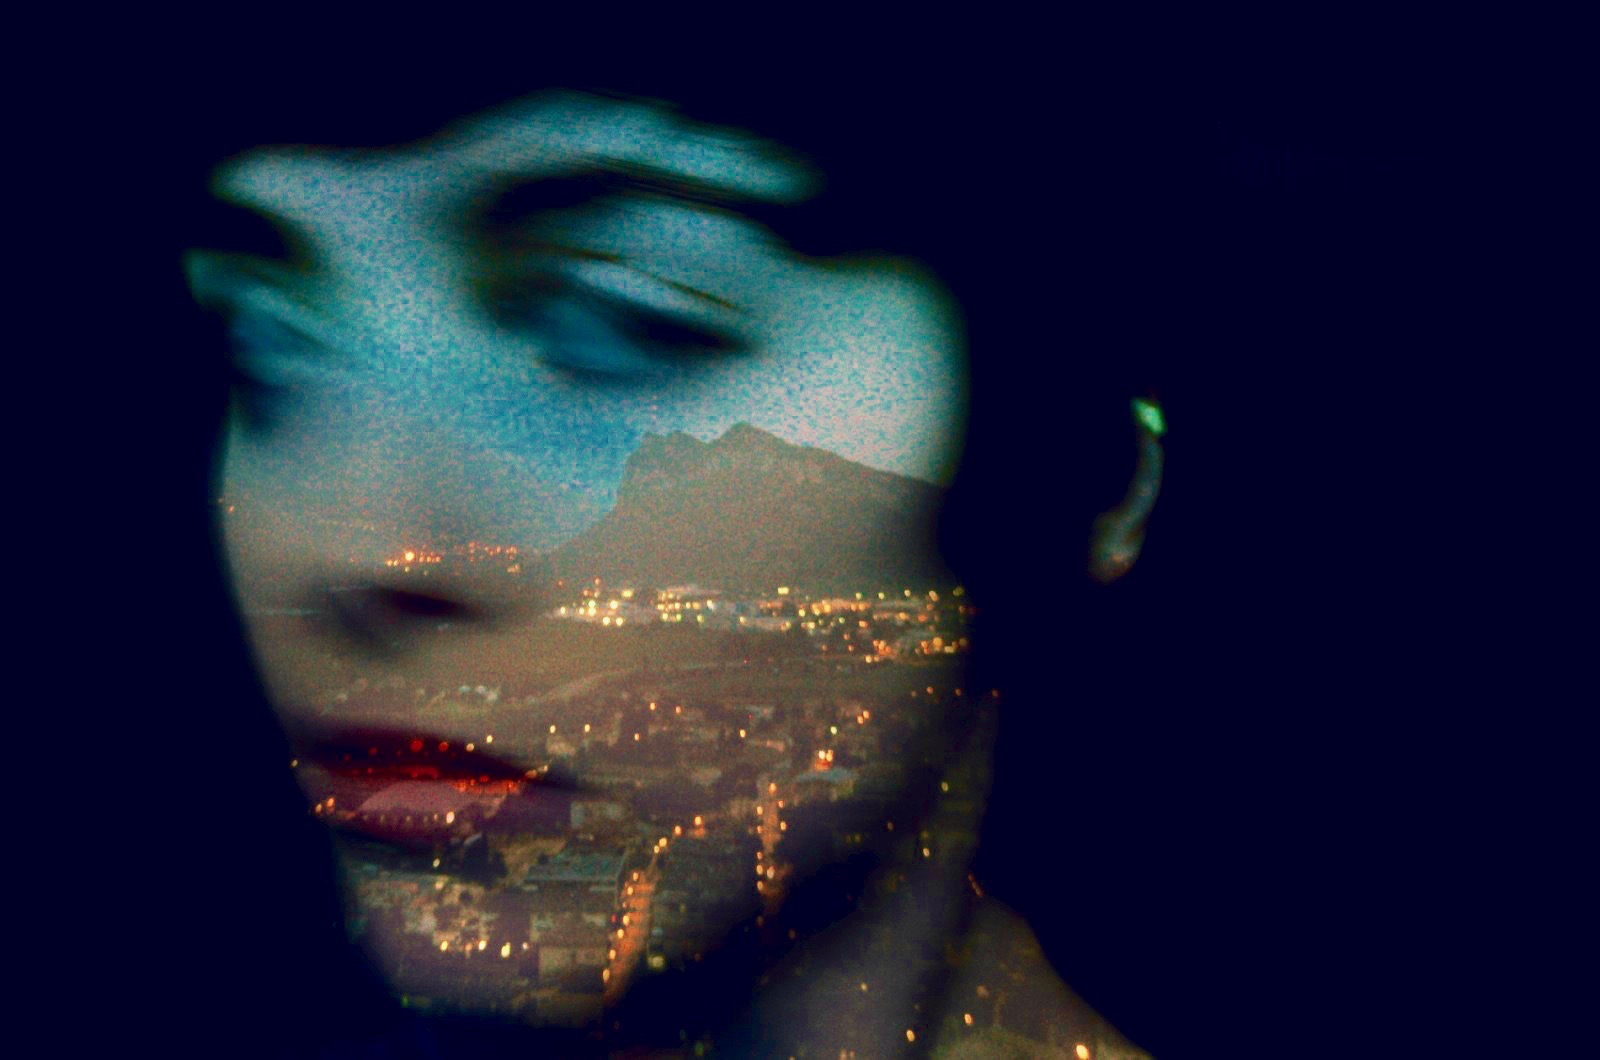
img = loadImage("https://i.imgur.com/z1yTE1v.jpg");
img.loadPixels();
}
function setup(){
createCanvas (477,478);
background(255);
noStroke();
//set ellispe mode to center
ellipseMode(CENTER);
frameRate(10000);
}
function draw(){
//Select random point on canvas to draw
rand_x = random(img.width);
rand_y = random(img.height);
cur_x = floor(rand_x);
cur_y = floor(rand_y);
//get the value at the position of the image
pix = img.get(cur_x, cur_y);
//generate a random size of the shape
siz = random(3,6);
//randomize which shape to draw
type_shape = random([0,1,2]);
fill(pix);
//depending on the random value of type shape: choose triangle circle or square
if (type_shape == 0){
triangle(cur_x, cur_y-(2/3)*siz, cur_x-(1/2)*siz, cur_y+(1/3)*siz, cur_x+(1/2)*siz, cur_y+(1/3)*siz);
}
else if (type_shape == 1){
ellipse(cur_x, cur_y,siz,siz);
}
else {
rect(cur_x-siz/2,cur_y-siz/2,siz,siz);
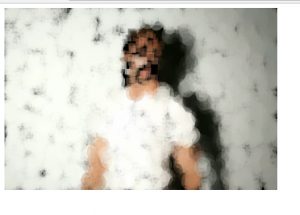
}
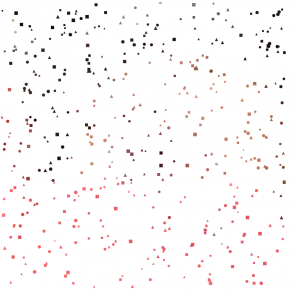
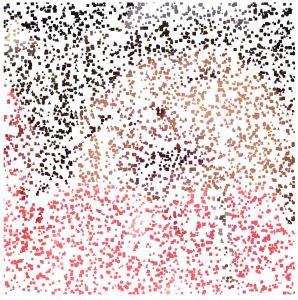
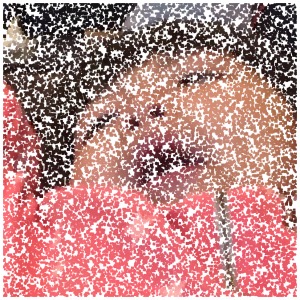
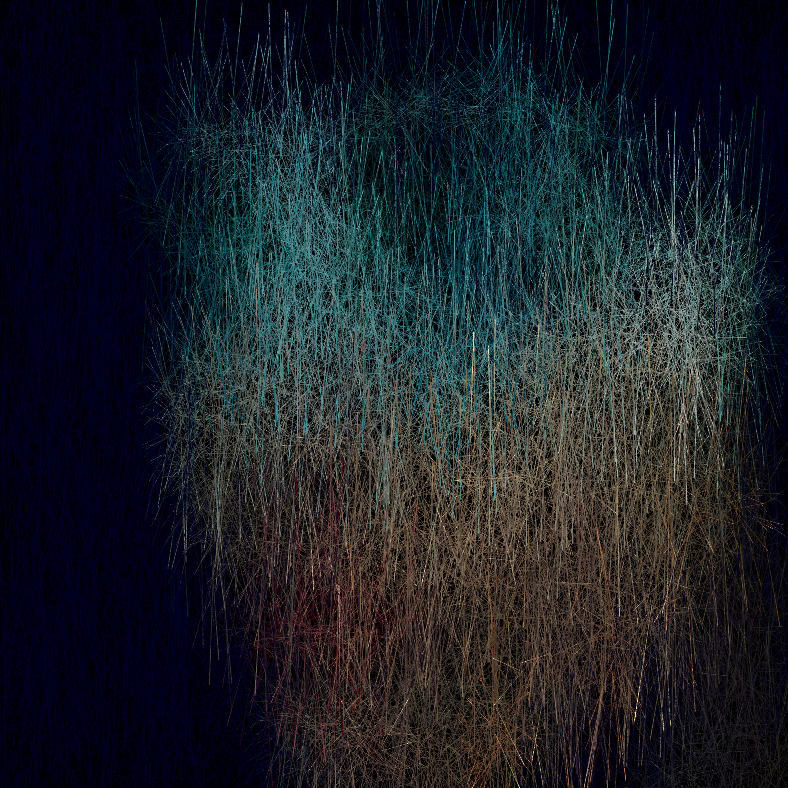
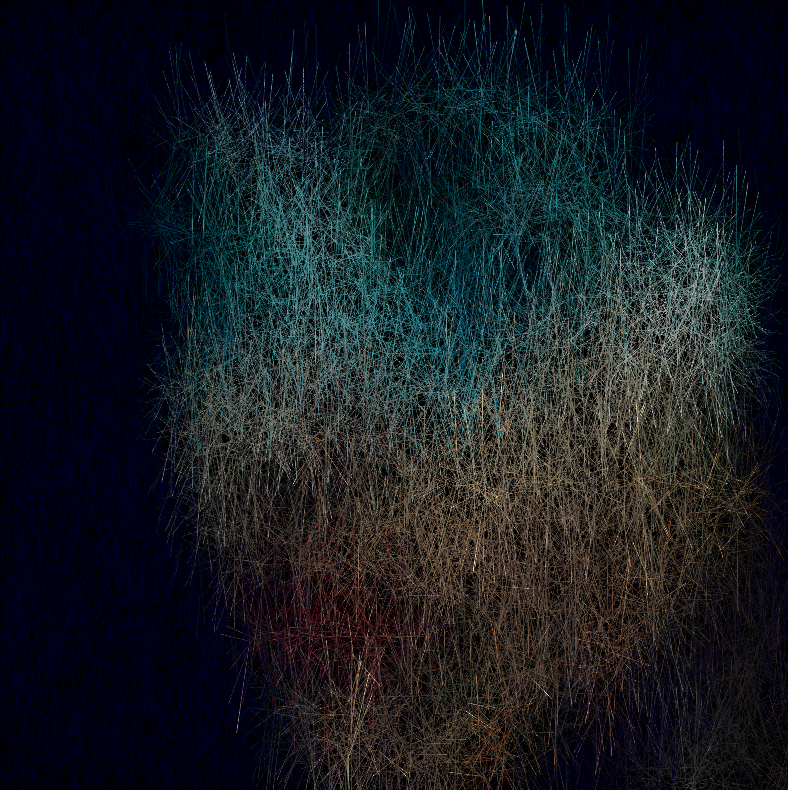
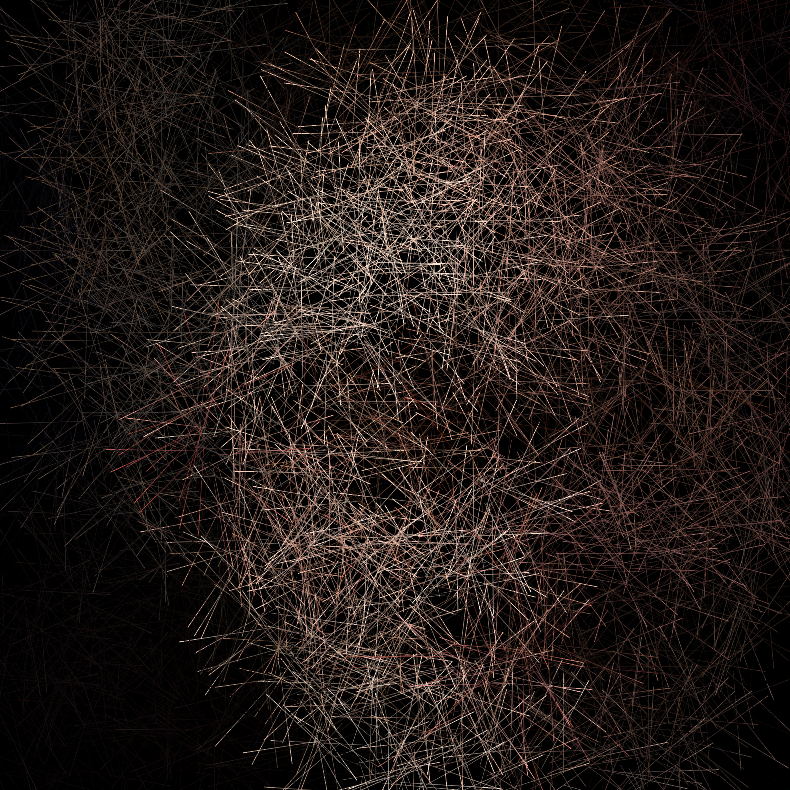
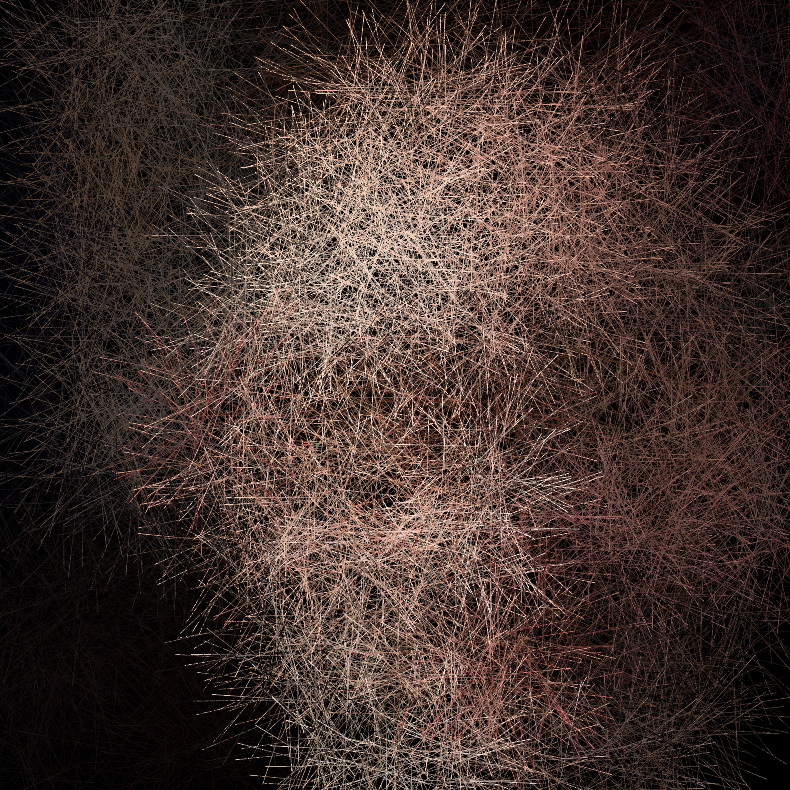
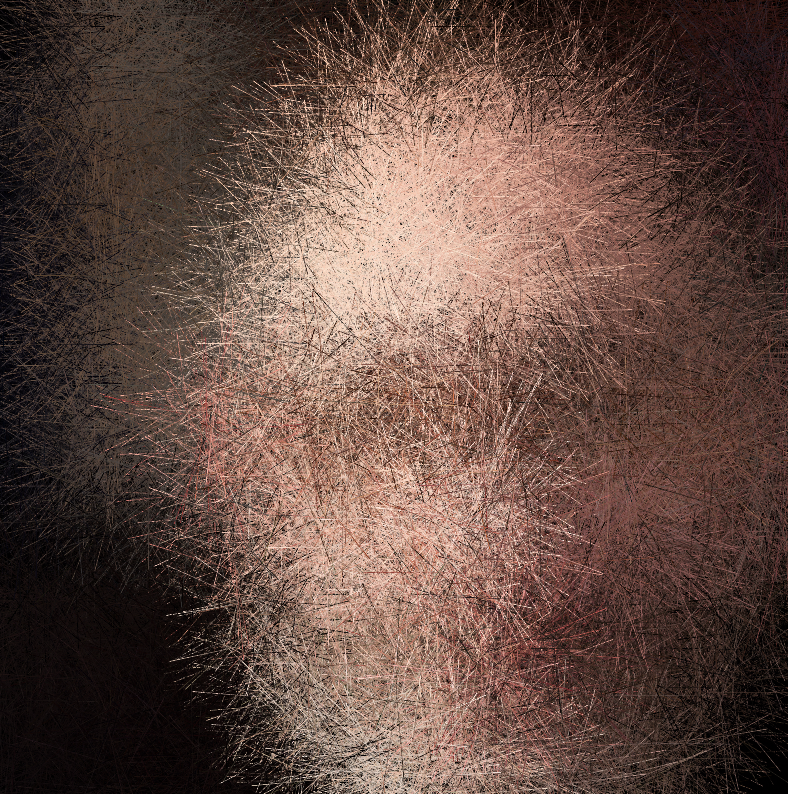
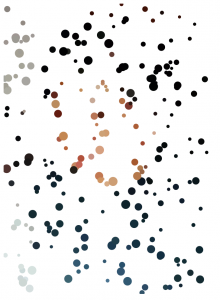
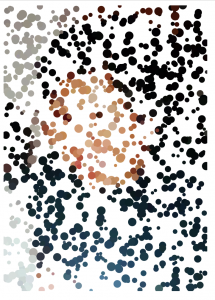
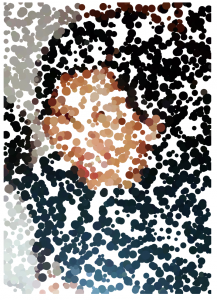
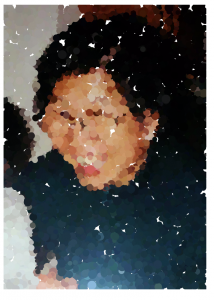
}For this portrait, I asked if my sister if I could use one of her older photos. For the project, I just played around with what variables I could randomize to make it more interesting. I decided to incorporate the three elementary shapes, a square, a triangle, and a circle to reconstruct my image. I also varied the size of the shapes that were used to reconstruct the image. Below are just some screen shots of the program, at it’s initial, intermediate, and “final” reconstruction of the image.