elizabew – Looking Outwards – 07 – sectionE

Inequaligram, a project worked on by Lev Manovich and Agustin Indaco, is a project that focused on analyzing public Instagram images in Manhattan over a period of five months. The point of the project was to measure and correlate the economic equality with how much people share between different parts of the city.

I really look up to this project since it tackles a new modern day social issue relating to inequality that many people are affected by in one way or another. The result was interesting in that after analyzing over 7 million photos, they found that the inequality of these images were actually higher than inequalities between different standards of living of the locals; and that the inequality of visitors’ images is even larger than extreme income inequality. Poor areas show much less while rich areas have become “social media rich”.

data-visualization between photos taken by locals/visitors

In order to generate the dataset for this research, Lev Manovich and Agustin Indaco used Instagram images with location information to collect their data while using the standard measure of inequality (Gini index) to measure the social inequality. In order to visualize all this data, they plotted locations of 200,000 random images from their dataset.

Click here for more information on the project

elizabew – Project – 07 – Composition with Curves

sketch

//Elizabeth Wang
//Section E
//elizabew@andrew.cmu.edu
//Project 07: Composition with Curves

var nPoints;
var angle;

function setup() {
  createCanvas(480, 480);
  angleMode(DEGREES);
  frameRate(15);
}

function draw() {
  background(102,106,134);

  angle = map(mouseX, 0, mouseY, 0, 360);

  translate(width/2, height/2); //keeps shape centered

  push();
  rotate(angle);
  drawAstroidCurve(); //calls to function drawShape
  pop();
}


function drawAstroidCurve(){

  var a = map(mouseX, 20, mouseY, 20, 30);
  nPoints = map(mouseX, 0, mouseY, 0, 20);

  beginShape(); //prevents object from adding on top of itself
  for (i = 0; i < nPoints; i++){
  var xr;
  var yr;
  var qx;
  var qy;
  var t = map(i, 0, nPoints, 0, 360);
  //http://mathworld.wolfram.com/Astroid.html
  var x = a*pow(cos(t), 3); //astroid curve's parametric equations
  var y = a*pow(sin(t), 3);
  //http://mathworld.wolfram.com/AstroidRadialCurve.html
  xr = x + 12*a*cos(t)*pow(sin(t), 2); //quadrifolium of astroid curve
  yr = y + 12*a*pow(cos(t), 2)*sin(t);

  noFill();
  strokeWeight(1);
  vertex(xr + (-10, 5), yr + random(-10, 5)); //keeps the shape "shaking"
  stroke(255,180,162);
  ellipse(xr + (-10, 5), yr + random(-10, 5), 3,3); //shaking ellipses
  stroke(223,243,227);

  if ((i % 2 == 0) & (i > 1)) { //dotted line
            stroke(232,197,71);
            line(qx, qy, xr, yr);
        }
        qx = xr;
        qy = yr;

  }
   endShape(CLOSE);
}

Still images:

Reflection

For my curve, I ended up choosing the quadrifolium of the astroid radial curve. When I started, I had a lot of trouble with radians and ended up accidentally translating my entire shape to move around a circle. Finally when I figured out what I did wrong and changed radians to angle, I wanted to make my shape not only “shake”, but to make it more dynamic; so I added a “backdrop” of dotted lines to give my shape more depth while also adding shaking dots. Overall I’m really happy with how it turned out and it reminds me of installations that demonstrate the vibrations of sound and/or music.

elizabew – looking outwards – 06 – SectionE

Swarm Light was an installation created by Random International, a collaborative studio founded by Hannes Koch and Florian Ortkrass. This installation explores artificial intelligence in motion using self-organising systems. These systems do have an “order” to them, but what I really admire about this project is how the randomness within the lights in this piece creates a swarm effect as a reaction to movement and surroundings that immerses observers to feel as though the installation is alive. The project itself is made from “LEDs, polished brass rods, custom circuit boards, custom driver software and hard ware, behavioral algorithm, sound / motion sensors, computer & interface”. What really comes through the piece is the inspiration that the creators got to create it, which was the efficiency of flocks of birds and how they react to their surroundings.

Click here for more information on this project

elizabew-Project-06- Abstract-Clock

sketch

//Elizabeth Wang
//Section E
//elizabew@andrew.cmu.edu
//Project 6: Abstract clock

function setup() {
  createCanvas(400, 400);
}

function draw() {

  var h = hour(); //hour
  var m = minute(); //minute
  var s = second(); //second

  background(0,167,225);

  fill(255);
  noStroke();
  ellipse (150, 120, 50, 100); //left ear
  ellipse (250, 120, 50, 100); //right ear
  ellipse (200, 200, 200, 200); //head

  fill(255,200,87);
  ellipse (175, 210, 20, 10); //nose

  stroke(0);
  strokeWeight(2);
  fill(255);
  ellipse (140, 180, 50, 50); //right eye
  ellipse (220, 180, 50, 50); //left eye

  var thetaSecond = ((3*PI)/2) + (PI/30) * s; //increments of 60 for seconds
  var xls = 140 + 10*cos(thetaSecond); //x left eye position
  var yls = 180 + 10*sin(thetaSecond); //y left eye position
  var xrs = 220 + 10*cos(thetaSecond); //x right eye position
  var yrs = 180 + 10*sin(thetaSecond); //y right eye position
  fill(0);
  noStroke();
  ellipse (xls, yls, 30, 30); //left eye moving
  ellipse (xrs, yrs, 30, 30); //right eye moving


  //mouth
  noStroke();
  fill(52,52,52);
  rect(158, 225, 40, 2*m, 20, 20, 10, 10); //mouth gets bigger every minute
  if (m>30){ //when mouth gets big, also a mark for when it is past 30 minutes

    var xt = 100 + 80*cos(thetaSecond); //x right eye position
    var yt = 200 + 80*sin(thetaSecond); //y right eye position
    textSize(20);
    text("it's been 30 minutes, I'M LATE!", xt, yt);
    fill(189,217,191);

  }


  //cheek blush

  if (h == 0){ //changing from 24 to 12 hour time
    h = 12;
  }
  if (h > 12){
    h = h - 12;
  }

  for(var x = 0; x < h ; x++){ //every hour there is a new blush line
    stroke(237,106,90);
    var spacing = x * 15;
    line(spacing + 130, 200, spacing + 90, 220);

  }

}

Reflection

This project was difficult for me in the sense that it was hard for me to distance myself from what actual clocks generally looks like. At first I tested out trying to make a flower grow out of a cactus and eventually die as the day went on, but it ended up being too complicated, so I simplified it to a face instead. I’m happy with how the final looks, but I still feel as though if I had more time, I would add more graphic elements. The face itself rolls its eyes every second, and every minute that passes, the mouth gets longer. Once 30 minutes passes, text pops up that informs the user that it has been over 30 minutes. For the hour, I added “blush” lines, and each line represents one hour.

elizabew – looking outwards – 05 – SectionE

“The Race Day” is a 2D image using 3D computer graphics made by Peter Nowacki that was based off of the concept art “Old Back Street” by Gary Tonge. The image was created using software such as Maya, Photoshop, 3ds Max, V-Ray, and After Effects. According to the artist, “First I used Maya, then I exported the whole scene to 3ds Max and used V-Ray. Textures were done in Photoshop and final composition and post – work in After Effects”.

What I really love about it is not only how realistic the image looks, but how visually interesting it is. The shadows that cascade over a multitude of objects while the light shines through where the canopy doesn’t cover almost creates a story. The attention to detail is inspiring. It was almost hard to believe it wasn’t a photo. The artist themselves talked about how they enjoyed adding details to the image day by day and how they were inspired by the the world and music around them. 

For more information about this project and to see more of his work — click here to visit his behance page. 

elizabew-Project-05- Wallpaper

sketch

// Elizabeth Wang
// elizabew
// Section E
//Project 5: Wallpaper


function setup() {
  createCanvas(450, 450);
  background(214,239,255); //blue
  noLoop();

}


function draw() {
  drawLine(); //vertical lines
  drawDiaganal(); //diaganal lines
  drawDots(); //dots
  drawLeaf(); //ellipses
}

function drawLine() { //vertical lines
  for (var xv = 0; xv < width; xv += 5) { //vertical lines
    var xvPos = xv * 10;
    strokeWeight(2);
    stroke(177,226,174); //green
    line(xvPos, 0, xvPos, height);
  }

}

function drawDiaganal(){ //diagnal lines

  for (var y = 0; y < height; y += 100){ //diaganal lines from left to right
      strokeWeight(1);
      stroke(243,207,194); //pink
      line(y, 0, width, height - y);
      yPos = -400 + y;
      line(yPos, 0, width, height - yPos);
  }
  for (var y = 0; y < height; y += 100){ //diaganal lines from right to left
      strokeWeight(1);
      stroke(243,207,194); //pink
      line(50, height + y, width + 50, y );
      yPos = y - 400;
      line(0, height + yPos - 50 , width, yPos - 50);
  }

}


function drawDots() { //hexigonal grid of dots

  for( var ly = 0; ly < height; ly += 5){

    if (ly%2 == 0){ // every other row
      for (var lx = 0; lx < width; lx += 10) {
        var lxPos = (lx * 20) ; //x position of dot
        var lyPos = ly * 20; // y position of dot
        noStroke();
        fill(237,240,218); //yellow
        ellipse(lxPos/2, lyPos/2, 10, 10);
      }
    }
    else {
      for (var lx = 0; lx < width; lx += 10) {
        var lxPos = (lx * 20) + 100; //x position of dot
        var lyPos = (ly * 20) ; // y position of dot
        noStroke();
        fill(237,240,218); //yellow
        ellipse(lxPos/2, lyPos/2, 10, 10);
      }
    }
  }
}


function drawLeaf(){

  for( var ly = 0; ly < height; ly += 5){

    if (ly%2 == 0){ //creates a hexogonal grid
      for (var lx = 0; lx < width; lx += 10) {
        var lxPosRight = (lx * 20) + 21 ; //position of right leaf x
        var lxPosLeft = (lx * 20) - 19 ; //position of left leaf x
        var lyPos = (ly * 20) - 100; // y position of leaves
        fill(177,226,174);
        noStroke();
        ellipse(lxPosRight/2, lyPos/2, 20, 10); //right side of leaf
        ellipse(lxPosLeft/2, lyPos/2, 20, 10); //left side of leaf
      }
    }
    else {
      for (var lx = 0; lx < width; lx += 10) {
        var lxPosRight = (lx * 20) + 121; //position of right leaf x
        var lxPosLeft = (lx * 20) - 119;//position of left leaf x
        var lyPos = (ly * 20) + 100 ;// y position of leaves
        fill(177,226,174);
        noStroke();
        ellipse(lxPosRight/2, lyPos/2, 20, 10); //right side of leaf
        ellipse(lxPosLeft/2, lyPos/2, 20, 10); //left side of leaf
      }
    }
  }

}

Initial Sketches

Reflection

What I think was really helpful for me during this process was the fact that we had an assignment that had to do with a hexagonal grid — which I used for pretty much every aspect of my wallpaper. Overall it was a huge learning experience and I’m very pleased with the results — I think the overall colors that I’ve chosen and the pattern I’ve made really suits who I am. However, the process was a bit difficult for me since I am still not used to for() looping lines and the large amount of code was a bit overwhelming (making my own functions was incredibly helpful for this).

elizabew – looking outwards – 04 – SectionE

Sugarcube: MIDI and MaxMSP Controller


What I really like about this project is how satisfying it looks to play with and touch and listen too. The tilt sensors as you tilt the entire machine makes the sound go up or down, almost as if you were holding a bowl and rolling around a ball in it. It really creates a bridge between physically doing something and technology. I also really like the satisfying buttons and the shape of the whole box — it looks like something I could keep on the side of my desk to just push the buttons for fun.

According to the maker, the project is a MIDI controller — generates Musical Instrument Digital Interface (MIDI) data to MIDI-enabled devices.

The artist was inspired by monome — a similar interactive instrument. However, he wanted to make something cheaper while also not relying on the computer to process everything into MIDI.

Click Here for Further Information on the Project

elizabew-Project-04- String Art

sketch

//Elizabeth Wang
//elizabew
//Section E
//Project-04: String Art


// for (var VARNAME = STARTINGVALUE; VARNAME < LIMIT; VARNAME += INCREMENT) {
//     WHAT_TO_DO;
// }


function setup() {
  createCanvas(400,300);
  background(0);

}

function draw() {

  for (var x = 0; x <= 300; x += 10){ //looping lines with a spacing of 10 each time
    stroke(255);
    strokeWeight(.01);

    line(0, height - x, x * 1.5, 0); //upperleft

    line(width, x * 1.5, height - x, height); //lowerright

    line(0, x * 1.5, height/4 + x, height); //left side of eye

    line(height, height/20 + x, x * 1.5, 0); //right side of eye

    noStroke();
    fill(255);
    ellipse(180, 160, 80, 80);

  }


}

Reflection

At the beginning of the project, instead of coming up with an idea of what to make with lines, I wanted to practice getting used to using the for() function and seeing how it affects the shape and look of the lines. After a while, I felt that what I was beginning to form looked like an eye, and so I decided to work towards that as the goal of my project.

elizabew – looking outwards – 03 – SectionE

Video of the GLASS II Installation Demonstration 

GLASS II from Mediated Matter Group on Vimeo.

GLASS II is a 2017 3D printed glass installation demonstrated in Milan Design week and was made by The Mediated Matter Group. The installation is made out of a series of glass columns made from a computational framework that created each column’s unique form.

What I find incredibly cool about this project is how it pushes the boundaries of glass, a material used in everyday life. While the light aspect isn’t groundbreaking — light and glass has been used as art for a long time — the way they installed a moving light that creates kaleidoscopic images surrounds the columns makes for a further beautiful piece.

The algorithms used to generate these glass columns are, according to the group’s website, “a unique network of radial arrays made of arcs” and the forms are all “directly influenced by the constraints of the manufacturing platform and structural system.” This means that the higher the load on the column, the larger the column gets.

Click here further information on this project

elizabew-Project-03-Dynamic-Drawing

Reflection

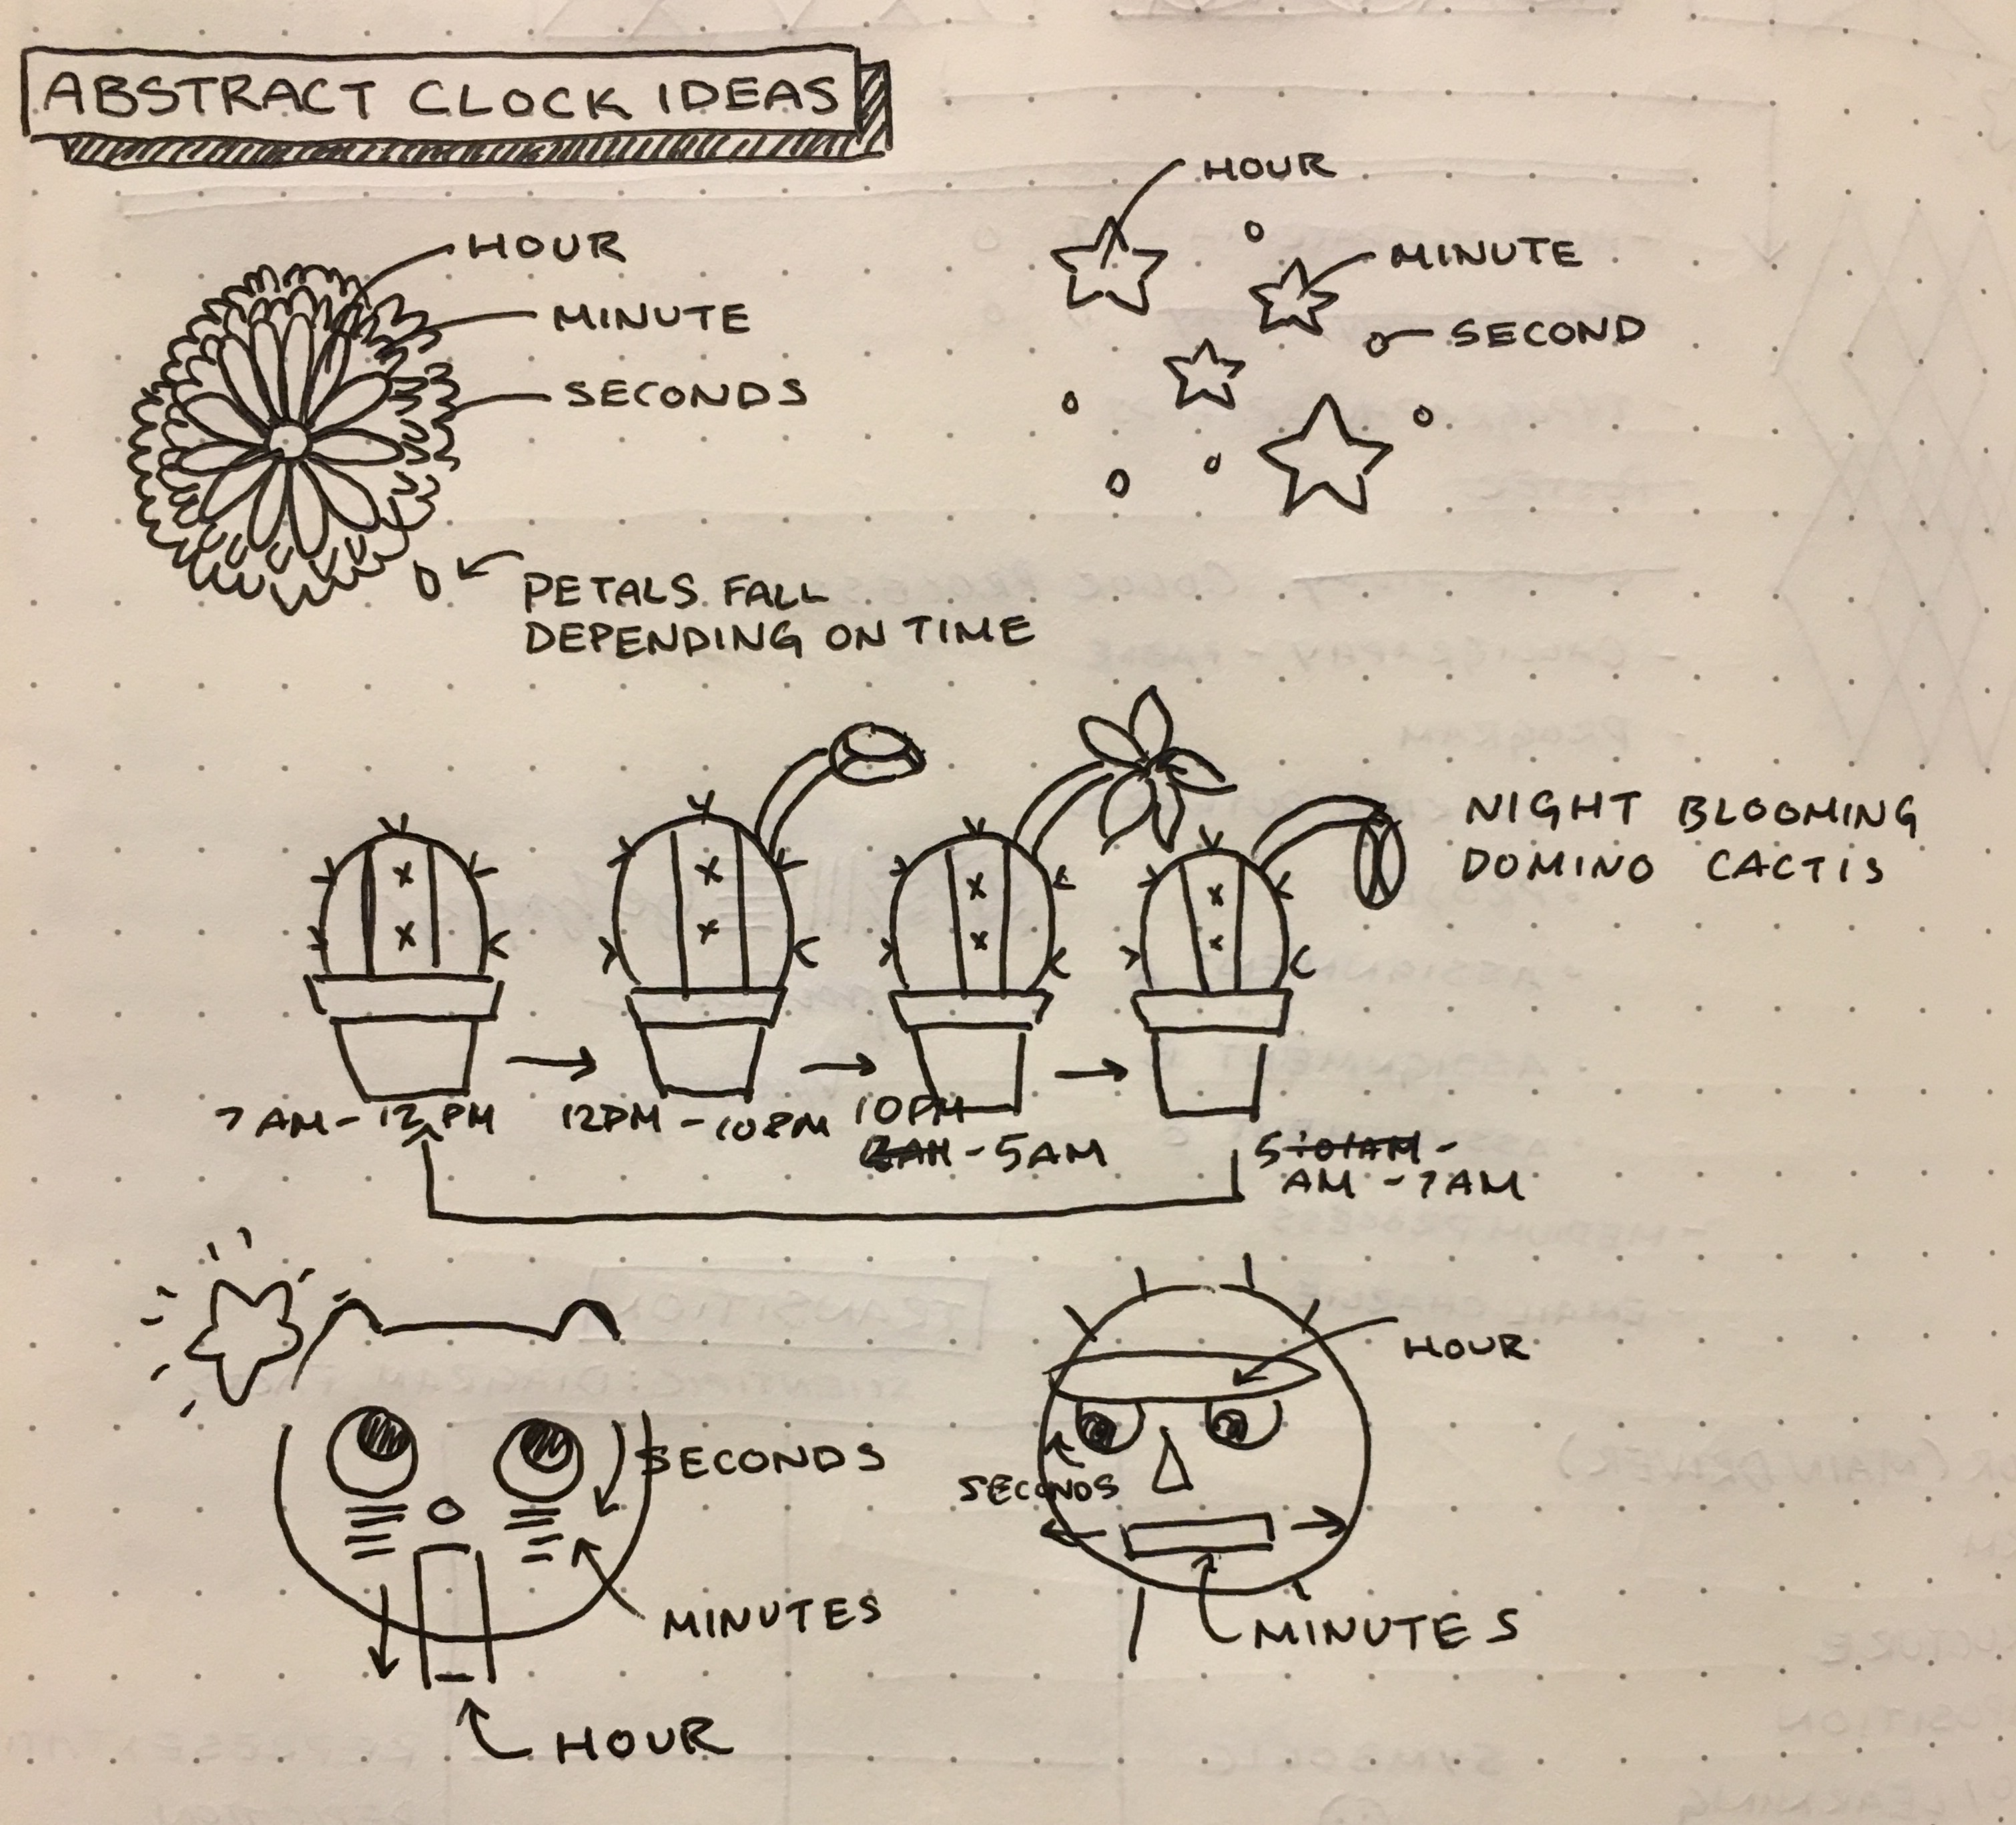
Admittedly, I actually did have a more solid idea before coming up with this program — I was planning on creating a sun going up and down, while make a face squint when the sun was all the way up; however I ended up having too much fun playing around with the patterns and the rotation action that I ended up distancing myself from that initial idea. I found it so exciting to see the patterns that would form depending on how fast it is going and where the mouse was on the image. Overall, the final product reminds me of strobe lights or fireworks — and even though it isn’t as obvious as my initial idea, I still think it looks pretty cool.

sketch

//Elizabeth Wang
//Section E
//elizabew@andrew.cmu.edu
//Project-03: Dynamic Drawing


var angleSecond = 0;
var angleMiddle = 0;
var angleThird = 0;
var angletriangle = 0;
var colorA = 250;
var colorB = 50;

function setup() {
  createCanvas(480, 640);
  rectMode(CENTER);
  angleMode(DEGREES);
}

function draw() {
background(80, 100, 200);

colorA = mouseX;
colorB = mouseY;

noStroke();

//second from middle
fill(200, 100, colorA); // all colors are random, constantly
push();//rotate
translate(mouseX, mouseY); //moves with mouse
rotate(angleSecond);
translate(0, -140); //location
rect(0, 0, 130, 12);
pop();//rotate
angleSecond += max(min(mouseY/10, 1), mouseX/10); //gets faster as you move right

//middle
fill(50, 100, colorB);
push();//rotate
translate(mouseX, mouseY); //moves with mouse
rotate(angleMiddle);
rect(0, 0, 200, 25);
pop();//rotate
angleMiddle += max(min(mouseY/10, 1), mouseX/10); //gets faster as you move down

//third
fill(230, 60, colorA);
push();
translate(width/2, height/2); //doesn't move with the mouse, constant background
rotate(angleThird);
translate(0, 200);
scale (mouseX/100, mouseY/100); // changed size as it moves
rect(0, 0, 220, 35);
pop();
angleThird += max(min(mouseY/10, 1), mouseX/10);

//third but the other direction
fill(200, 200, colorB);
push();
translate(width/2, height/2);
rotate(-angleThird);
translate(0, 200);
scale (mouseX/100, mouseY/100); // changed size as it moves
rect(0, 0, 220, 35);
pop();
angleThird += max(min(mouseY/10, 1), mouseX/10);

//triangle
fill(250, 150, colorA);
push();
translate(mouseX, mouseY);
rotate(-angletriangle);
translate(0, 20);
triangle(-20, 60, 0, 20, 20, 60);
pop();
angletriangle += max(min(mouseY/10, 1), mouseX/10);

//rotating while also going around
fill(150, 200, colorB);
push();
translate(mouseX, mouseY);
rotate(angleSecond);
translate(0, 200);
rect(0, 0, 300, 40);
pop();
angleSecond += max(min(mouseY/10, 1), mouseX/10);


}