![[OLD FALL 2017] 15-104 • Introduction to Computing for Creative Practice](../../../../wp-content/uploads/2020/08/stop-banner.png)
//scarlet Tong
//sntong@andrew.cmu.edu
//Section A
//Project-04-String-Art
//variables for y compment of guiding lines
var aLineX1 = 200;
var aLineX2 = 400;
var aLineY = 0;
// variable for x component of guiding lines
var bLineX = 100;
var bLineY1 = 0;
var bLineY2 = 350;
//color variables
var R = 255;
var G = 200;
var B =200;
function setup() {
createCanvas(400, 300);
background(0);
}
function draw() {
//create invisible guiding lines that determines where the points are generated
//each guiding line creatres 20 points
for (var i = 0; i <= 1; i+= .05) {
//guiding line 1
var x1 = lerp(bLineY1,bLineX,i);
var y1 = lerp(bLineY1,bLineY2,i);
//guiding line 2
var x2 = lerp(aLineX1,aLineX2,i);
var y2 = lerp(aLineX1,aLineY,i+.01);
//guiding line 3
var x3 = lerp(bLineY2,bLineY1,i);
var y3 = lerp(aLineX2,bLineY2,i);
//first web has the color pink
stroke(R,G,B);
strokeWeight(.85);
line(x1,y1,x2,y2);
//second web is colored white
stroke(B,R,G);
strokeWeight(.5);
line(x2,y2,x3,y3);
}
//add changing colors with respect for mouse location for fun
if (mouseX < width) {
R = mouseX;
G = mouseY;
B = R-G;
}
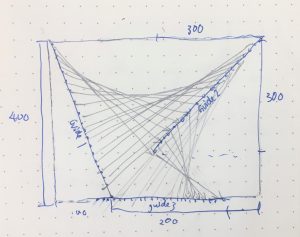
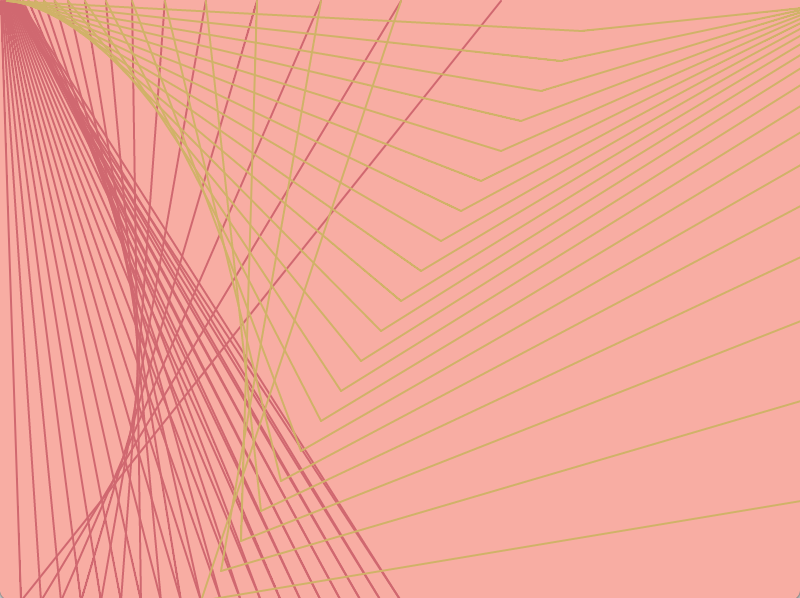
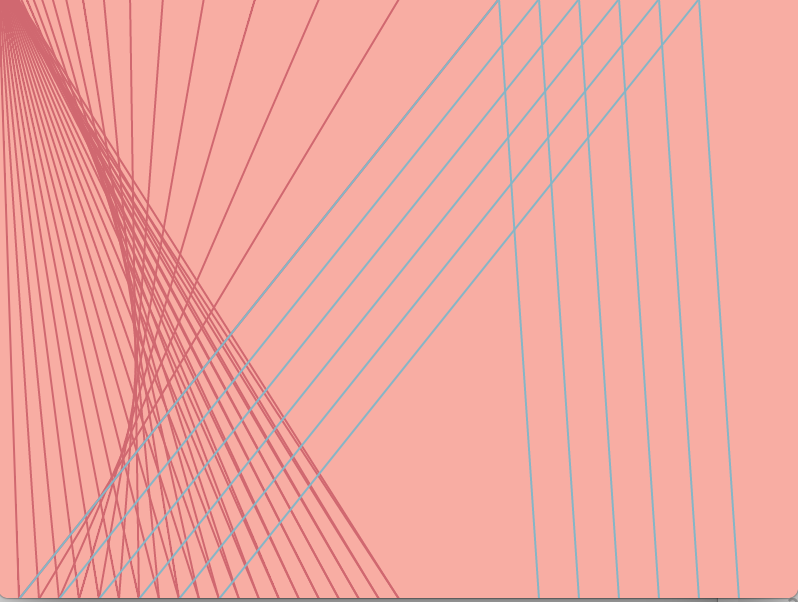
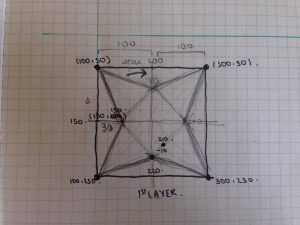
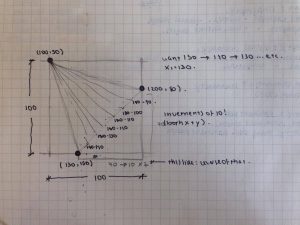
}I explored using the lerp() function to help me generate “guiding” lines that will govern the shape of resulting “web”. Using for loop, I was able to generate 2 webs with 3 guiding lines for this composition. The color of the lines relate to the location of the mouse on the canvas (so the drawing appears and disappears as you interact with it with the mouse), and I struggled working out the location of the guiding lines and using variables to sort out the sequences of points when working on this project