sntong-Project-04-String-Art

sketch

//scarlet Tong
//sntong@andrew.cmu.edu
//Section A
//Project-04-String-Art


//variables for y compment of guiding lines
var aLineX1 = 200;
var aLineX2 = 400;
var aLineY = 0;
// variable for x component of guiding lines
var bLineX = 100;
var bLineY1 = 0;
var bLineY2 = 350;

//color variables
var R = 255;
var G = 200;
var B =200;

function setup() {
    createCanvas(400, 300);
    background(0);

}

function draw() {
  //create invisible guiding lines that determines where the points are generated
  //each guiding line creatres 20 points
  for (var i = 0; i <= 1; i+= .05) {
    //guiding line 1
    var x1 = lerp(bLineY1,bLineX,i);
    var y1 = lerp(bLineY1,bLineY2,i);
    //guiding line 2
    var x2 = lerp(aLineX1,aLineX2,i);
    var y2 = lerp(aLineX1,aLineY,i+.01);
    //guiding line 3
    var x3 = lerp(bLineY2,bLineY1,i);
    var y3 = lerp(aLineX2,bLineY2,i);
    //first web has the color pink
    stroke(R,G,B);
    strokeWeight(.85);
    line(x1,y1,x2,y2);
    //second web is colored white
    stroke(B,R,G);
    strokeWeight(.5);
    line(x2,y2,x3,y3);
    }

    //add changing colors with respect for mouse location for fun 
    if (mouseX < width) {
      R = mouseX;
      G = mouseY;
      B = R-G;
    }
}

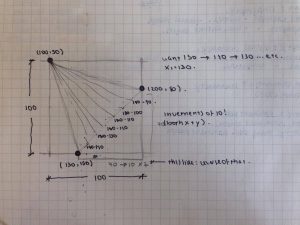
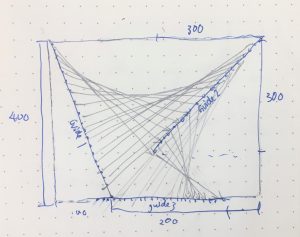
I explored using the lerp() function to help me generate “guiding” lines that will govern the shape of resulting “web”. Using for loop, I was able to generate 2 webs with 3 guiding lines for this composition. The color of the lines relate to the location of the mouse on the canvas (so the drawing appears and disappears as you interact with it with the mouse), and I struggled working out the location of the guiding lines and using variables to sort out the sequences of points when working on this project
rfarn-Project-04-StringArt

My string art design is fairly simple. Once understanding the concept of a for loop, I was able to quickly apply it to the creation of this string art. There were only a few small problems I faced, such as having to reverse the direction of the increments by subtracting them from the height. Besides little technical/syntax troubles, the overall project was quick and straight forward.

sketch

var yincrement = 15; //increments along y-axis
var xincrement = 20; //increments along x-axis
var x1position = 1; //points constantly flush left
var y1position = 299; //points constantly flush bottom
var x2position = 399; //points constantly flush right
var y2position = 1; //points constantly flush top

function setup(){
    createCanvas(400, 300);
    background(0);
}

function draw() {
	for(var i = 0; i < 21; i += 1) {
		strokeWeight(0.5);
		stroke(255); //white
		line(x1position, yincrement * i, xincrement * i, y1position); //lines between left and bottom
		stroke(255, 0, 0); //red
		line(x2position, yincrement * i, xincrement * i, y2position); //lines between right and top
		stroke(0, 255, 0); //green
		line(xincrement * i, y1position, x2position, height - yincrement * i); //lines between bottom and right
		stroke(0, 0, 255); //blue
		line(x1position, height - yincrement * i, xincrement * i, y2position); //lines between top and left
	}
}

Bettina-Project04-SectionC

sketch

// yuchienc@andrew.cmu.edu
// Section C
// project 4--stringart

function setup() {
  createCanvas(400,300);
}

var bgColor='#f8ada3'
var fuschia='#d06870'
var lightBlue='#86b5c6'
var ochre='#d0b268'

function draw() {
  background(bgColor);
  fuschiaCurve(mouseX);
  lightBlueCurve(mouseX);
  ochreCurve(mouseX);
}

function fuschiaCurve(mouseX) {
  var x1=mouseX;
  var y1=0;
  var x2=10;
  var y2=300;
  var x3=250;
  var y3=0;
  var cmx=constrain(mouseX,75,500);
  for (i=0;i<400;i+=20) {
    stroke(fuschia);
    line(x1,y1,x2,y2);
    line(x2,y2,x3,y3);
    x1+=.5;
    x2+=10;
    x3*=.8;
  }
}

function lightBlueCurve(mouseX) {
  var x1=10;
  var y1=300;
  var x2=250;
  var y2=0;
  var x3=x2+20;
  var y3=300;
  var cmx=constrain(mouseX,100,500);
  for (i=0;i<300;i+=50) {
    stroke(lightBlue);
    line(x1,y1,x2,y2);
    line(x2,y2,x3,y3);
    x1+=20;
    x2+=cmx/25;
    x3=x2+20;
  }
}

function ochreCurve(mouseX) {
  var x1=150;
  var y1=300;
  var x2=300;
  var y2=0;
  var cmx=constrain(mouseX,100,500);
  for (i=0;i<260;i+=20) {
    stroke(ochre);
    line(x1,y1,x2,y2);
    x1+=cmx*.05;
    x2+=cmx*.05;
  }
}

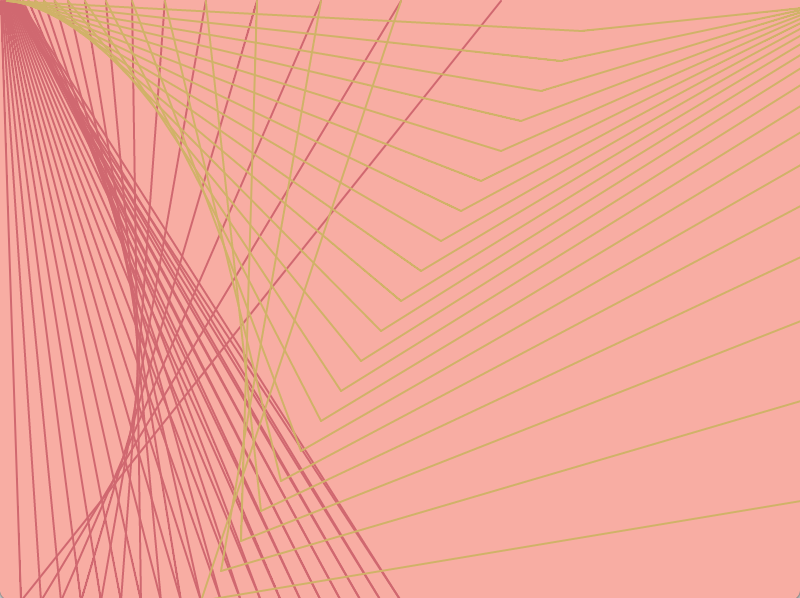
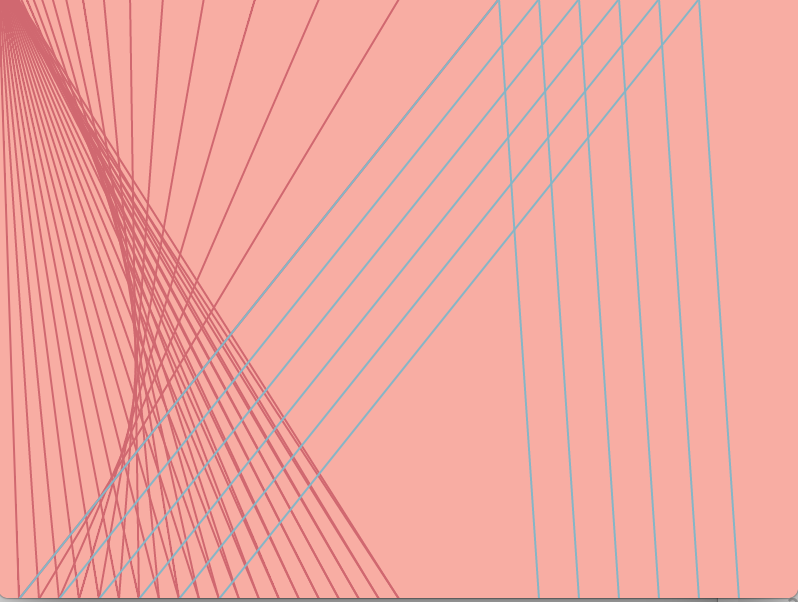
My previous projects, I had sketched a clear visual and then figured out the code to execute it. This time, I wanted to embrace the nature of code and draw something directly in p5 without sketching ideas prior. I’d used the print statement to find the values for x and y at certain points in the loop so I could use those values for other curve functions. I spent the most time adjusting the increments to x and y so the composition outcome was balanced. Some process pictures are below.


I also added an interactive portion, building off of last week’s assignment, so the positions of certain coordinates varied with mouseX.

Project 04-String Art

Dave String

//Yoonseo(Dave) Choi
//Section B
//yoonseo1@andrew.cmu.edu
//Project-04
//String Art
var slider; //slider variable
var n; // output variable for sequence
var spix; //x coordinate variable for spiral sequence 
var spiy; //y coordinate variable for spiral sequence
var nn; //simple sequence variable to connect with spiral
var Svalue;  //variable for slider value
function setup() {
    createCanvas(400, 300); // set canvas size to 400,300
    slider = createSlider(0,170,0); // slider that value goes from 0,170 and start value with 0
}
function draw() {
    Svalue = slider.value(); //return slider value to Svalue
    background(0); //set background color to black
    //sequence();
    
    stroke(255,255,255,70);//set color to be white and Alpha value of 100
    strokeWeight(1) // stroke weight to be 1 pix. 
    sequence(); //execute simple sequence function. 
    Bloom(); // execute Bloom function
}


function sequence(){ //simple arithmatic sequence
    for (var i =0; i <=Svalue; i+=5){ // increment of i in 5s if smaller than slider
        n = 2*i+1; //out put equation

        line(0,height/2+n,n*3,height); // sequence and inverse connected on left bottom corner 
        line(width,height/2+n,width-n*3,height); //Same on right bottom corner
        line(0,height/2-n,n*3,0); //same on left top corner
        line(width,height/2-n,width-n*3,0); //same on right top corner. 
    }
}
function Bloom(){
    for (var j = 0; j <=Svalue/100; j+= 0.1){// slider value divided by 100 to fit trigonomatric values. 
        //based on r(t) = exp(t) in polar equation
        spix = exp(j)*cos(j); //x coordinate based on cos with exponaential value
        spiy = exp(j)*sin(j); //y coordeinate based on sine with exponential value
        //top and bottom of flower
        line(width/2+spix*20,height/2+spiy*20,width/2-spix*20,height/2+spiy); //connecting lines to each points generated
        line(width/2-spix*20,height/2-spiy*20,width/2+spix*20,height/2-spiy);
        line(width/2-spix*20,height/2+spiy*20,width/2+spix*20,height/2-spiy);
        line(width/2+spix*20,height/2-spiy*20,width/2-spix*20,height/2+spiy);
        //left and right of flower
        line(width/2+spiy*20,height/2+spix*20,width/2-spiy*20,height/2+spix);
        line(width/2-spiy*20,height/2-spix*20,width/2+spiy*20,height/2-spix);
        line(width/2-spiy*20,height/2+spix*20,width/2+spiy*20,height/2-spix);
        line(width/2+spiy*20,height/2-spix*20,width/2-spiy*20,height/2+spix);
        for (var w = 0; w <=Svalue;w+=60){ //connecting the polar equation with linear sequence
            nn = 2*w+1; //same sequence as above
            line(width/2+spiy*20,height/2+spix*20,width,height/2+nn); // connecting sequence with points on same quadrant
            line(width/2-spiy*20,height/2+spix*20,0,height/2+nn);   //left borrom corner
            line(width/2+spiy*20,height/2-spix*20,0,height/2-nn);   // left top corner
            line(width/2-spiy*20,height/2-spix*20,width,height/2-nn); // right top corner
        }
    }
}

For this project, I wanted to look into other equations rather than simple arithmetic equations. I tried to incorporate the polar equation (spiral,r(t) = exp(t))to generate interesting shape and line movements. I added the slider so user can interact with the shape and see the process of generating.

Jihee Kim_SectionD_Project-04 (String Art)

jiheek1_project4

//Jihee Kim
//15-104 MWF 9:30
//jiheek1@andrew.cmu.edu
//project4 string art
//section D

var backgroundRed; // Red value of background
var backgroundGreen = 4; // Green value of background
var backgroundBlue = 51; // Blue value of backgound
var lineR = 187; // Red value of lines
var lineG; // Green value of lines
var lineB = 239; // Blue value of lines

function setup() {
    createCanvas(400, 300);
}


function draw() {
    // background changes from navy blue to dark purple as mouse moves in x direction
    background(backgroundRed, backgroundGreen, backgroundBlue);
    backgroundRed = map(mouseY, 0, height, 5, 37); // only R value changes

    //color of lines change as mouse moves in X direction
    lineG = map(mouseX, 0, width, 208, 187); // only G value changes

    // draw layers of folds that reveal a diamond at the end
    // basic logic: thickest strokeweight = closest to front
    // basic logic: i is greatest in the very back to draw less attention
    var x = 0; // position of x coordinate
    var y = 0; // position of y coordinate

    // form curves that are closest and create the almond shape
    for (var i = 0; i <= 400; i += 18) { //set the start, limit, spacing
        stroke(lineR, lineG, lineB);
        strokeWeight(1.6); // thickest lineweight for the element in very front
        line(x + i, height, width, height - i); // bottom right corner

        strokeWeight(1.2); // second thickest lineweight
        line(x + i, y, x, height - i); // top left corner

        strokeWeight(0.8); // third thickest lineweight = 3rd closest to front
        line(width/2 + i, 0, width, i); // top right quadrant
        line(width/2 - i, height, x, height - i); // bottom left quadrant

        strokeWeight(0.4); // fourth thickness = exists in the back
        line(x + i, y, width, i); // top right corner
        line(width - i, height, x, height - i); // bottom left corner
    }

    // draw the diamond
    for (var i = 0; i <= 400; i += 25) {
        strokeWeight(0.25); // second to furthest element
        // top left quadrant
        line(width/2 - i, height/2, width/2, i);
        // bottom left quadrant
        line(width/2 - i, height/2, width/2, height - i);
        // top right quadrant
        line(width/2 + i, height/2, width/2, i);
        // bottom right quadrant
        line(width/2 + i, height/2, width/2, height - i);
    }

   // overlay another diamond that moves
   //spacing between loops varies with mouseY
   spacing = map(mouseY, 0, height, 0, 2);
   for (var i = 0; i <= 400; i += 25) {
       strokeWeight(0.15); // furthest element
       // top left quadrant
       line(width/2 - i, height/2 * spacing, width/2, i * spacing);
       // bottom left quadrant
       line(width/2 - i, height/2 * spacing, width/2, height - i * spacing);
        // top right quadrant
       line(width/2 + i, height/2 * spacing, width/2, i * spacing);
       // bottom right quadrant
       line(width/2 + i, height/2 * spacing, width/2, height - i * spacing);
  }
}

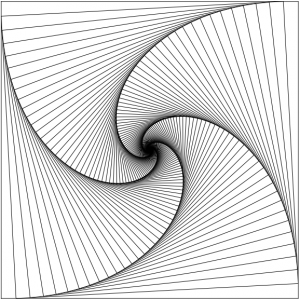
For this project, I have created a drawing with multiple layers of folds and a diamond-like element by forming curves with lines.
My inspiration for the project came from the pattern below.

inspiration

As the pattern above does, I wanted my project to show depth and I achieved that goal through varying the distance between loops and the stroke weight, creating a hierarchy that conveys a sense of depth. I wanted the viewer to clearly sense what is in front and what is in the back.
I also made the drawing more dynamic by controlling some motion of elements and color with the position of the mouse.

afukuda-Project04

afukuda-project-04

/* 
 * Name | Ai Fukuda 
 * Course Section | C 
 * Email | afukuda@andrew.cmu.edu
 * Assignment | 04-b
 */ 

function setup() {
    createCanvas(400, 300);
}

function draw() {
    background(206, 236, 236);

    var x1;                     // x-coordinate of vertices 
    var y1 = 160;               // initial y-coordinate of vertices 

// PURPLE LINES (THICK)
    strokeWeight(1.5);                           
    stroke(204, 178, 213);

    for (var x1 = 130; x1 < 201; x1+=10) {      // top-left lines    
        line(100, 50, x1, 120+(y1-x1));
    }

    for (var x1 = 200; x1 < 271; x1+=10) {      // top-right lines 
        line(300, 50, x1, x1-120); 
    }

    for (var x1 = 130; x1 < 201; x1+=10) {      // bottom-left lines     
        line(100, 250, x1, x1+20);
    }

    for (var x1 = 200; x1 < 271; x1+=10) {      // bottom-right lines 
        line(300, 250, x1, 420-x1);          
    }

// PURPLE LINES (THIN)
    strokeWeight(1);
     for (var x1 = 130; x1 < 201; x1+=10) {     // top-left lines     
        line(200, 150, x1, 120+(y1-x1));
    }

    for (var x1 = 200; x1 < 271; x1+=10) {      // top-right lines 
        line(200, 150, x1, x1-120); 
    }

    for (var x1 = 130; x1 < 201; x1+=10) {      // bottom-left lines     
        line(200, 150, x1, x1+20);
    }

    for (var x1 = 200; x1 < 271; x1+=10) {      // bottom-right lines 
        line(200, 150, x1, y1+260-x1);          
    }


// ORANGE LINES 
    strokeWeight(1);           
    stroke(253, 205, 167);     

    // top set of lines 
    for (var x1 = 130; x1 < 201; x1+=10) {       // top-left lines     
        line(200, 20, x1, 120+(y1-x1));
    }

    for (var x1 = 200; x1 < 271; x1+=10) {      // top-right lines 
        line(200, 20, x1, x1-120); 
    }

    // left set of lines 
    for (var x1 = 130; x1 < 201; x1+=10) {       // left-top lines     
        line(70, 150, x1, 120+(y1-x1));
    }

    for (var x1 = 130; x1 < 201; x1+=10) {       // left-bottom lines   
        line(70, 150, x1, x1+20);
    }

    // bottom set of lines 
    for (var x1 = 130; x1 < 201; x1+=10) {       // bottom-left lines     
        line(200, 280, x1, x1+20);
    }

     for (var x1 = 200; x1 < 271; x1+=10) {      // bottom-right lines 
        line(200, 280, x1, y1+260-x1);         
    }

    // right set of lines 
     for (var x1 = 200; x1 < 271; x1+=10) {     // top-right lines 
        line(330, 150, x1, x1-120); 
    }

    for (var x1 = 200; x1 < 271; x1+=10) {      // bottom-right lines 
        line(330, 150, x1, y1+260-x1);         
    }

// BLUE LINES 
    strokeWeight(1);           
    stroke(140, 164, 212); 

    line(130, 150, 200, 80);
    line(200, 80, 270, 150);
    line(130, 150, 200, 220);
    line(200, 220, 270, 150);

// BLUE VERTICES 
/*
    strokeWeight(3);                            
    fill(140, 164, 212);

    point(100, 50);                     // primary geometry vertices (purple)
    point(300, 50);
    point(100, 250); 
    point(300, 250);

    point(200, 20);                    // secondary geometry vertices (orange)
    point(70, 150);
    point(200, 280);
    point(330, 150);

    point(200, 150);                   // center of geometry 
*/
    
}


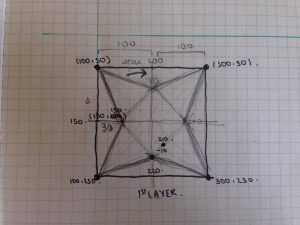
I was able to generate this string art by simply declaring two variables: one for the initial x-coordinate and another for the y-coordinate. I began with the top-left set of purple curves, and translated those appropriately to create the geometry. Things that I could improve are: using rotation to make the code much simpler, and to use variables so the geometry becomes dynamic.

Process work:

cduong-project 04-string art

cduong-project-04

//Name: Colleen Duong
//Section: D
//Andrew ID: cduong@andrew.cmu.edu
//Project-04: String Art

function setup() {
    createCanvas(400, 300);
}

function draw() {
  background(244, 174, 163);

  //Variables
  var x; //x-coordinate
  var y = 100;

//I wanted the lines to be close together so I made the range pretty small


//The Head of a Flamingo
  for(var x = 0; x < 20; x+=2){ //Range: 0 to 20
    stroke(255);

    curve(100, 200, 200, 100, 200, x+20, 73, 61);   //Same y2, y3,and x3 values to make sure that the emerging lines connect at the same point to make a coherent bird head shape
    curve(200, 400, 100, 100, 200, x+20, 73, 10);
  }


//Flamingo Wing1
  for(var x = 0; x < 60; x+=2){ //Range: 0 to 60
    noFill();
    stroke(255);

    curve(0, 0, 200, 100, 400, x+20, 73, 61); //Same x2, y2, and y3 as the head of the flamingo to make sure that the wings connected in the same place as the neck
  }

//Flamingo Wing2
  for(var x = 0; x < 30; x+=2){ //Range: 0 to 30 (I wanted this wing to be shorter than the one that's closer)
    noFill();
    stroke(255);

    curve(200, 0, 200, 100, 350, x+20, 73, 61); //Same x2, y2, and y3 as the head of the flamingo to make sure that the wings connected in the same place as the neck
  }

//Flamingo Body
  for(var x = 0; x < 100; x+=2){ //Range: 0 to 100 (Bigger range because the body is bigger)
    noFill();
    stroke(255);

    curve(400, 0, 200, 100, 300, x+120, 400, 0); //Same x2 and y2 as the head of the flamingo to make sure that the wings connected in the same place as the neck
    curve(400, 0, 500, 180, 300, x+120, 200, 400);
}

//BowTie
  for(var x = 0; x < 10; x+=2){ //Range: 0 to 10
    noFill();
    stroke(0);

    line(199, 100, x+180, x+y);
    line(199, 100, x+215, x+y);
  }

//Orange Water
      for(var x = 0; x < 400; x+=4){ //Range: 0 to 400 (I wanted the river to be gigantic and I made the value in between each x to be larger to spread out the lines more so they wouldn't merge into a solid shape)
        noFill();
        stroke(243, 204, 143);

        curve(400, 400, 20, 200, 390, x+300, 400, 400);
      }

//Blue Water
  for(var x = 0; x < 400; x+=6){ //Range 0 to 400 (To make the water look somewhat multi colored I put blue on top and put a different x+= value so it wouldn't completely overlap)
    noFill();
    stroke(183, 221, 239);

    curve(400, 400, 20, 200, 390, x+300, 400, 400);
  }


}

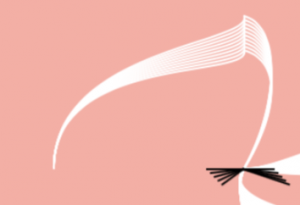
I wasn’t really sure what I wanted to draw at first so I started to play around with the for loop and curves until I made a really interesting shape, which is the beak/head/neck of the swan that I drew and from there I just continued to draw a swan.  

It was really fun to play around with the curves to try and make an abstract drawing. Hopefully you see what I was trying to draw, which is a swan (who is wearing a bowtie) flying over a river.