![[OLD FALL 2017] 15-104 • Introduction to Computing for Creative Practice](../../../../wp-content/uploads/2020/08/stop-banner.png)
//Yugyeong Lee
//Section B
//yugyeonl@andrew.cmu.edu
//Project-07
var nPointsA= 600;
var nPointsB= 200;
var nPointsC= 800;
var x;
var y;
var constrainX;
function setup() {
createCanvas(480, 480);
}
function draw() {
//ghosted background changing color based on mouseX
var constrainX = constrain(mouseX, 0, width); //constraining mouseX in the page
var r = map(constrainX, 0, width, 100, 39);
var g = map(constrainX, 0, width, 43, 15);
var b = map(constrainX, 0, width, 107, 54);
background(r, g, b, 40);
//Hypotrochoid & Ellipse
push();
translate(width/2, height/2);
drawHypotrochoid();
drawEllipse();
pop();
//Ranunculoid (only appears if mouseX is on left three quarter of page)
if (constrainX < 3*width/4) {
push();
translate(width/2, height/2);
//mapping the angle of rotation based on mouseX
var angle = map(constrainX, 0, width, 0, 4 * TWO_PI);
rotate(angle);
drawRanunculoid();
pop();
}
}
function drawHypotrochoid() {
constrainX = constrain(mouseX, 0, width); //constraining mouseX in the page
var n = map(constrainX, 0, width, 0, .5);
var a = 225;
var b = n*a;
var h = constrain(mouseY/2, 0, b);
noFill();
//change strokeWeight based on mouseX
var s = map(constrainX, 0, width, .1, 2);
//change stroke color based on mouseX
var c = map(constrainX, 0, width, 255, 100);
stroke(c)
strokeWeight(s);
beginShape()
for (var i = 0; i < nPointsA; i++) {
var t = map(i, 0, nPointsA, 0, 6*TWO_PI);
x = (a - b)*cos(t) + h*cos((a - b)/b*t);
y = (a-b)*sin(t) + h*sin((a-b)/b*t);
vertex(x, y);
}
endShape(CLOSE);
}
function drawRanunculoid() {
constrainX = constrain(mouseX, 0, width); //constraining mouseX in the page
var a = 30;
noStroke();
//change fill oppacity based on mouseX
var opacity = map(constrainX, 0, width, 10, 50);
fill(255, 255, 255, opacity);
beginShape()
for (var i = 0; i < nPointsB; i++) {
var t = map(i, 0, nPointsB, 0, TWO_PI);
x = a*(6*cos(t)-cos(6*t));
y = a*(6*sin(t)-sin(6*t));
ellipse(x, y, 5, 5); //ellipse at each points
}
endShape(CLOSE);
}
function drawEllipse() {
constrainX = constrain(mouseX, 0, width); //constraining mouseX in the page
var a = 270;
var b = 270;
noFill();
beginShape()
for (var i = 0; i < nPointsC; i++) {
var t = map(i, 0, nPointsC, 0, 6*TWO_PI);
x = a*cos(t);
y = b*sin(t);
//ellipse at random position x and y range
ellipse(x+random(-50, 50), y+random(-50, 50), 3, 3);
}
endShape(CLOSE);
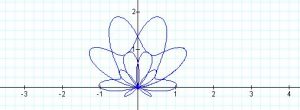
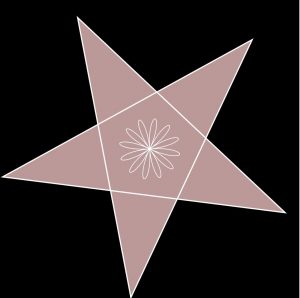
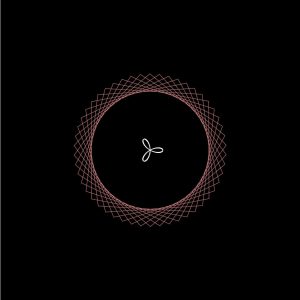
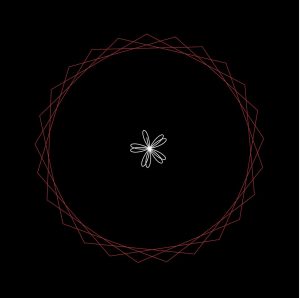
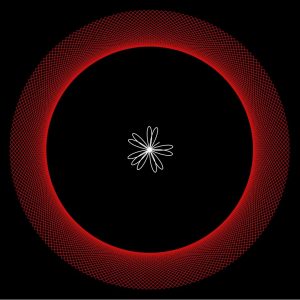
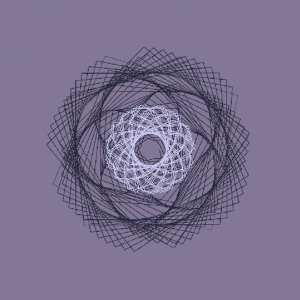
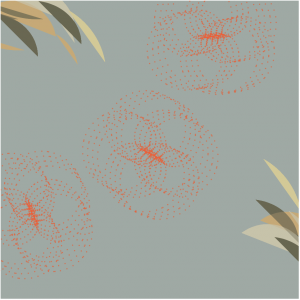
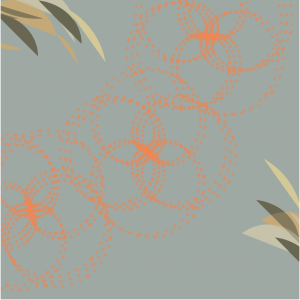
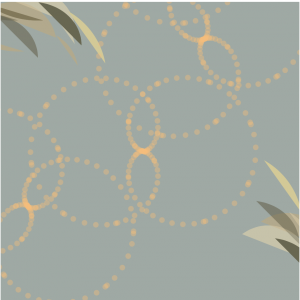
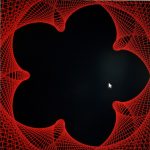
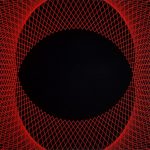
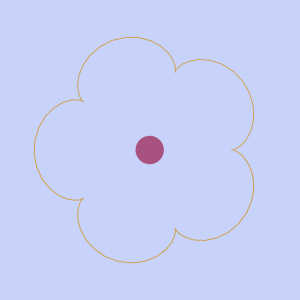
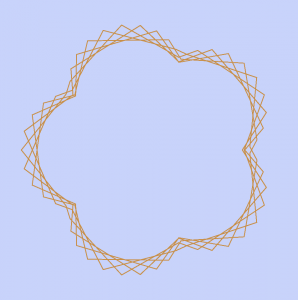
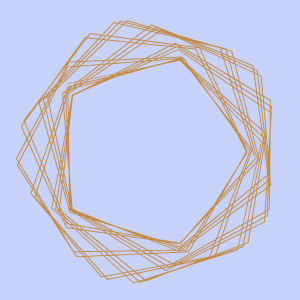
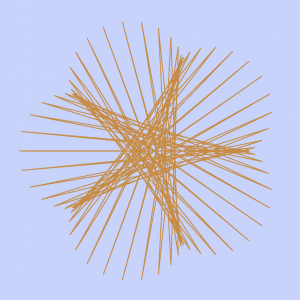
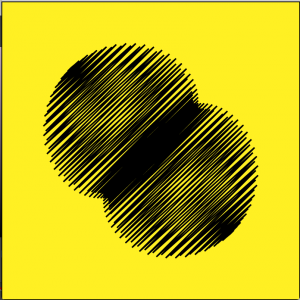
}I used three different curves for this interactive design: hypotrochoid, ranunculoid, and ellipse. The final product is interactive in that not only does the design react to position Y of the mouse location, the curves, the angle it rotates, stroke weight, stroke color, stroke opacity and background color all react to position X of the mouse location. Because of the circular movement of the other two curves, I wanted to create a “night-sky-with-blinking-stars” effect through creating an ellipse in which points are randomly positioned within a limited range with white blinking circles. The color palette was also chose to reflect the night sky atmosphere.
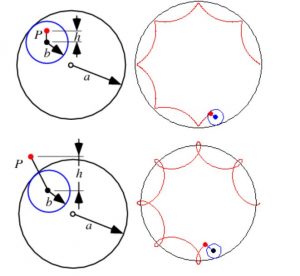
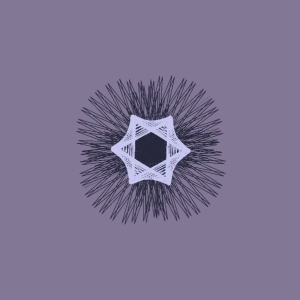
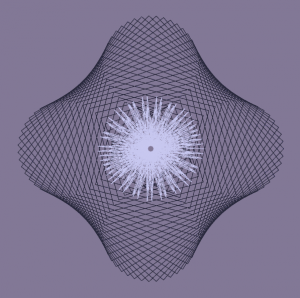
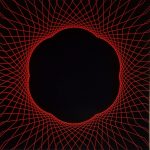
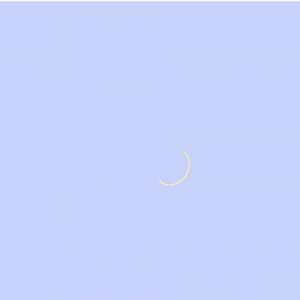
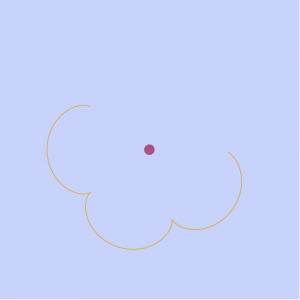
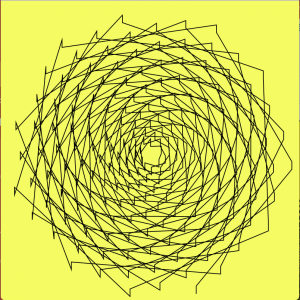
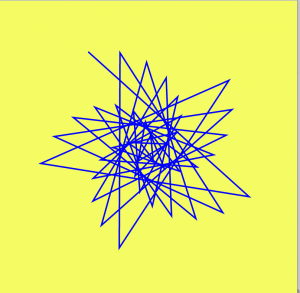
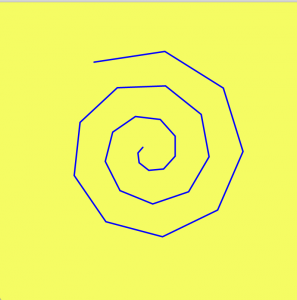
how Hypotrochoid & Ranunculoid works