mjnewman Project-07, Section A

circles

function setup() {
    createCanvas(480, 480);
}

function draw() {
    //mapping for colors lines and background
    var r = map(mouseX, 0, width, 0, 200);
    var g = map(mouseY, 0, height, 0, 255);
    var b = map(mouseX, 0, width, 0, 155);
    background(209, g, 100);
    stroke(r, 150, b);
    strokeWeight(3);

    //moving to middle of the canvas
    translate(width / 2, height / 2);
    noFill();
    drawHypotrochoid();
}

function drawHypotrochoid(){
    //variables to be used in the equation
    var x;
    var y;
    var h = width/2;
    var a = map(mouseX, 0, width, 0, PI);
    var b = map(mouseY, 0, height, 0, 1);

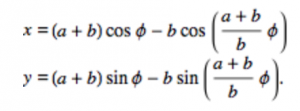
    //HYPOTROCHOID EQUATION
    // x = (a-b)*cos(angle) + h*cos(((a-b)/b) angle)
    // y = (a-b)*sin(angle) - h*sin(((a-b)/b) angle)

    beginShape();
        for(var i = 0; i < width; i+= 5){
            var angle = map(i, 0, width, 0, 360);
            x = (a - b) * cos(angle) + h * cos(((a-b)/b)*angle);
            y = (a - b) * sin(angle) - h * sin(((a-b)/b)*angle);
            vertex(x,y);
        }
    endShape();
}

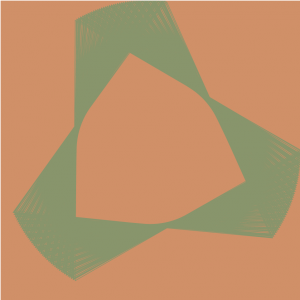
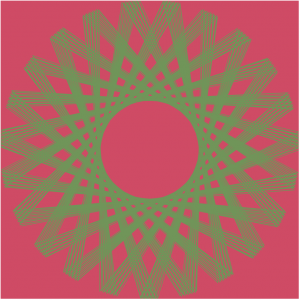
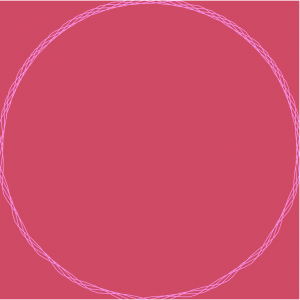
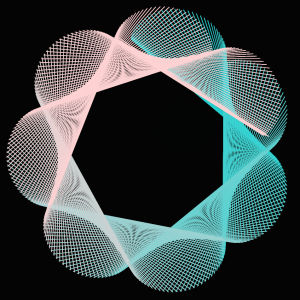
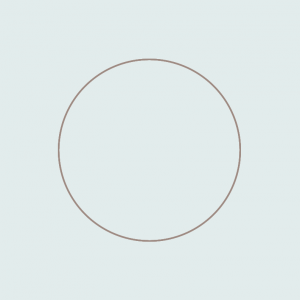
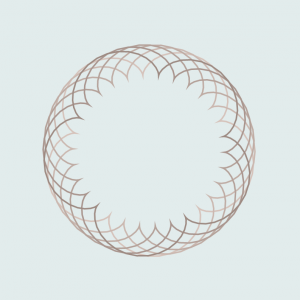
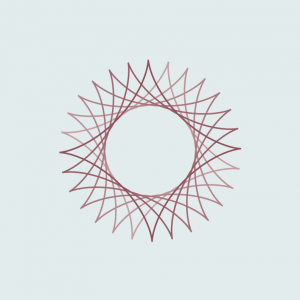
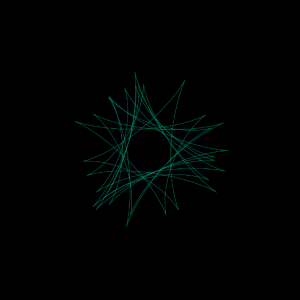
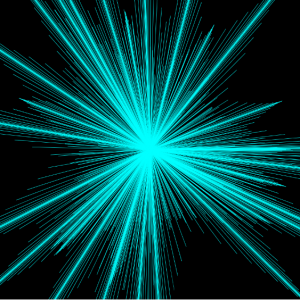
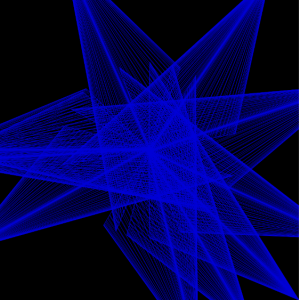
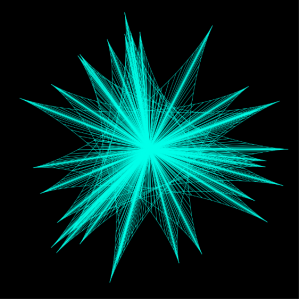
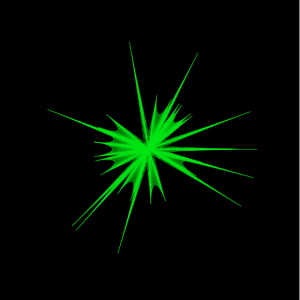
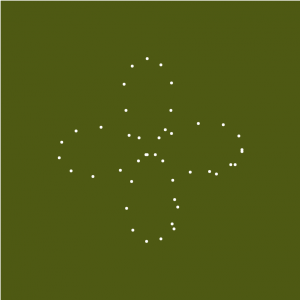
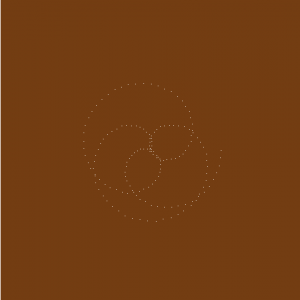
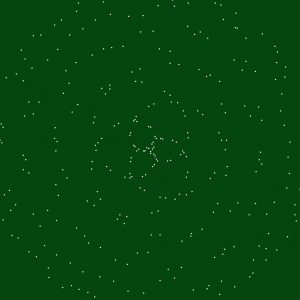
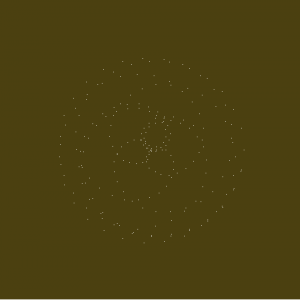
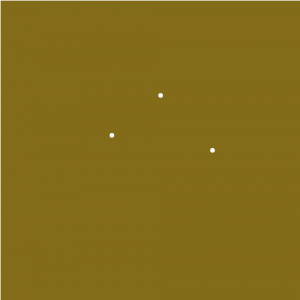
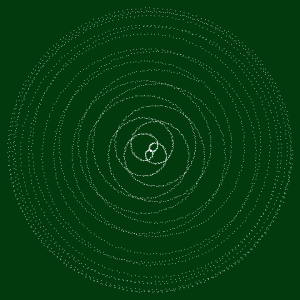
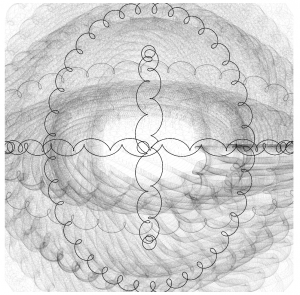
In order to fully understand the curves process, I tried to keep this project as simple as possible. This meant choosing a basic equation to start off with, which is how I ended up choosing the hypotrochoid curve. It took a little while to get used to how the rather long equation to generate the lines would semantically be converted into p5js; I had to add more multiplication stars than I had originally anticipated and had a lot of trouble trying to figure out that because when it wasn’t correct, nothing would render. I was able to play around with the numbers as well as colors by keeping this part of the project relatively simple. However, I am still mesmerized by the dancing lines from such a short amount of code.

Screenshots:

jooheek – Project07 – Curves

sketch

//JooHee Kim
//Section E
//jooheek@andrew.cmu.edu
//Project-07


//This project is based on the epicycloid formula
//http://mathworld.wolfram.com/Epicycloid.html
function setup() {
    createCanvas(480, 480);
    angleMode(DEGREES);
}

function draw() {
	background(0,30);
	
	//moves lines to the middle of canvas
	translate(width/2, height/2);
	
	//draws 5 curve shapes in different sizes
	for (var curveSize = 0; curveSize < 10; curveSize += 2) {
		//draws lines on every angle of the curve in degrees mode
		for (var i=0; i<360; i++) {

			//variable that remaps mouseX from 0 to 12
			//represents "a" in original formula
			var M = map(mouseX, 0, width, 0, 12);

			//represents "b" in original formula
			var b = 5;

			//variables of line coordinates drawn according to the epicycloid curve formula
			//substitutes with M so that the size and number of petals change according to mouseX
			var lineX1 = curveSize*((M+b)*cos(i-100) - b*cos(((M+b)/b)*i-100));
			var lineY1 = curveSize*((M+b)*sin(i-100) - b*sin(((M+b)/b)*i-100));
			var lineX2 = curveSize*((M+b)*cos(i) - b*cos(((M+b)/b)*i));
			var lineY2 = curveSize*((M+b)*sin(i) - b*sin(((M+b)/b)*i));

			//draw line with variables
			stroke(i, 210, 210, curveSize);
			line(lineX1, lineY1, lineX2, lineY2);
		}
	}

}

After looking at the types of curves that were given to us, I decided to choose the epicycloid. It uses a parametric equation:


I first tried to figure out how the graph works in coding, and after trying out many options I liked using lines with graph formula. Although I thought this project was simpler than other projects, I found it fun using curve formulas to represent curves in different ways. I first started out with one curve shape but found that putting it in a for loop that varies in sizes makes it more interesting. I also had fun playing with the opacity in both the background and lines.

Before I put it in a for loop and put opacity in it

*There are more curves when looked on the browser than when looked in this WordPress blog.

yushano_Project 7 – Curves

sketch


function setup() {
    createCanvas(400, 400);
    frameRate(10);
}


function draw() {
    background(226,236,236);
    
    strokeWeight(2);
    noFill();
    
    // draw the curve
    push();
    translate(width / 2, height / 2);

    // the curve inside
    for (var i = 0; i < 8; i++) {
        var r = 207-(207-152)/6*i;
        var g = 171-(171-92)/6*i;
        var b = 177-(177-103)/6*i;
        stroke(r,g,b);
        drawTetracuspidCurve();
        rotate(PI/14);
    }

    // the circle curve outside
    for (var i = 0; i < 6; i++){
        var r = 215-(215-147)/6*i;
        var g = 195-(195-126)/6*i;
        var b = 186-(186-118)/6*i;
        stroke(r,g,b);
        drawRanunculoidCurve();
        rotate(PI/3);
    } 
    pop();


}

function drawRanunculoidCurve() {
    var nPoints = 100;
    var x;
    var y; 
    var a = 100;
    var b = a / 5;   
    var ph = mouseX / 40;
    // control the shape in two opposite sides
    if (mouseY <height/2){
        var h = constrain(mouseY / 8, 0, b);
    } else {
        var h = constrain((height - mouseY) / 8, 0, b);
    }
    
    beginShape();
    for (var i = 0; i < nPoints; i++) {
        // map the points onto angles
        var t = map(i, 0, nPoints, 0, TWO_PI);
        x = (a + b) * cos(t) - h * cos(ph + t * (a + b) / b);
        y = (a + b) * sin(t) - h * sin(ph + t * (a + b) / b);
        vertex(x, y);
    }
    endShape(CLOSE);    
}

function drawTetracuspidCurve(){
    var nPoints = 200;
    var x;
    var y;
    var a = 120;
    var ph = mouseX / 40;

    beginShape();
    for (var i = 0; i < nPoints; i++) {
        var t = map(i, 0, nPoints, 0, TWO_PI);
        x = a / 4 * (3*cos(t) -  cos(ph + 3 * t));
        y = a / 4 * (3*sin(t) +  sin(ph + 3 * t));
        vertex(x, y);
    }
    endShape(CLOSE);    
}


Above are the process of my work. So, I combined two different kinds of curves in my project: Ranuncuidloid and Tetracuspid curves. The first shape is inspired from the form of flowers, and the other is inspired from the shape of a star. These two curves are all rotatable according to the x-coordinates of the mouse. Also, the flower shapes is generated from the y-coordinates of the mouse. The flower shape is more visible if the y-coordinates of your mouse is more towards the center, is like the flower is blooming. This project helps me understand more about the use of translate() and rotate(), which are my weakness. Also, I learned about many control elements in the curve equation, which is also meaningful.

heeseoc-Project-07-Curves

sketch

//Steph Chun
//15-104 section #A
//heeseoc@andrew.cmu.edu
//Project-07

var a = 30;
var b = 10;
var t = 500;
var h = 80;

function setup() {
    createCanvas(400, 400);
    frameRate(10);
}

function draw() {
	background(0);
	stroke(255);

	push();
	translate(width/2, height/2);
	beginShape();

	//lines//
	for (var i = 0; i < 50; i++) {
		var Xcoord = ((a-b)*cos(i))+(h*cos(((a-b)/b)*i));
		var Ycoord = ((a-b)*sin(i))+(h*sin(((a-b)/b)*i));
		var Xcoord2 = ((a-b)*cos(i-t))+(h*cos(((a-b)/b)*(i-t)));
		var Ycoord2 = ((a-b)*sin(i-t))+(h*sin(((a-b)/b)*(i-t)));
		b = mouseX + 650;
		line(Xcoord + random(-3, 3), Ycoord+ random(-3, 3), Xcoord2+ random(-3, 3), Ycoord2+ random(-3, 3));
    	
    	//bubbles//
		push();
		rotate(i);
    	ellipse (i + random(-3, 3), Ycoord, 2, 2);
    	ellipse (i + random(-3, 3), Ycoord2, 4, 4);
    	ellipse (Xcoord, i + random(-3, 3), 2, 2);
    	ellipse (Xcoord2, i + random(-3, 3), 4, 4);
    	pop();
    }
    endShape(CLOSE);
    pop();
    
    //bigger circle//
    push();
    translate(width/2, height/2);
    beginShape();
    for (var i = 0; i < 20; i++) {
    	fill(255, 50);
        var theta = map(i, 0, 20, 0, TWO_PI);
        var x = mouseX * 0.25 + 60;
        var px = x * cos(theta);
        var py = x * sin(theta);
        vertex(px + random(-3, 3), py + random(-3, 3));
    }
    endShape(CLOSE);
    pop();

    //smaller circle//
    push();
    translate(width/2, height/2);
    beginShape();
    for (var i = 0; i < 20; i++) {
    	fill(0);
        var theta = map(i, 0, 20, 0, TWO_PI);
        var x = mouseX * 0.25 + 20;
        var px = x * cos(theta);
        var py = x * sin(theta);
        vertex(px + random(-3, 3), py + random(-3, 3));
    }
    endShape(CLOSE);
    pop();

}

For this project, I started off with browsing mathworld website and finding the curve that we would want to use. I chose hypotrochoid. Then, I tried to generate that curve through coding, and what I found out was at some point, the lines that I made through the equation I chose made an eye-shaped form at some point, so I restricted the mouse movement to have it start from the shape and added wiggly circles in the middle of those lines. I added the wiggly bubbles in the back because it felt like it needed some more elements to it to have some sort of a visual balance. I kept all the colors white, because I did not want it to be way to literal in communicating my “zooming into an eye” idea. Below is the screenshot of the shape I got inspired from.

jamieh-project-07-Curves

sketch

/*
Jamie Ho
jamieh@andrew.cmu.edu
10:30
Project 07
*/

var vals = 100;			//# of points to deltoidCrv
var angles = 360;		//total angle
var maxCrvs = 10;		//# of crvs desired

function setup() {
    createCanvas(450, 450);
}

function draw() {
	background(0);
	translate(width/2, height/2);
	
	for(var i = 0; i < maxCrvs; i++){
		//equal rotation of canvas for each drawDeltoidCrv based on # of crvs
		rotate(angles/i);	
		//stroke colour based on mouse position
		var colourX = map(mouseX, 0, width, 0, 255);
		var colourY = map(mouseY, 0, height, 0, 255);
		stroke(0, colourX, colourY);

		drawDeltoidCrv();
	}
}

function drawDeltoidCrv(){
	noFill();
	angleMode(RADIANS);
	beginShape();
	for(var i = 0; i < vals; i++){
		//mapping i to the circle
		var theta = map(i, 0, vals, 0, TWO_PI);		
		//multiplied factor for crvs
		var t = 60;									
		
		//making mouse positions a percentage to scale crvs
		var mX = map(mouseX, 0, width, 0, 1);		
		var mY = map(mouseY, 0, height, 0, 1);
		
		//defining x and y coordiantes of deltoid crv 
		//size of deltoid crvs are in relationship w/ mouse positions
		var x = (2*t*cos(theta)+t*cos(2*theta))*mX;	
		var y = (2*t*sin(theta)-t*sin(2*theta))*mY;	

		strokeWeight(0.5);
		vertex(x, y);
		line(0, 0, x, y);
	}
	endShape();
}

The curves are based on deltoid curves, which looks similar to a triangle. I experimented with using just the deltoid curve itself as well as representing the multiple curves with lines. Representing with lines look more interesting than just the deltoid curves themselves. I also experimented with where the lines are drawn from, such as from (0, 0) or from (width/2, heigth/2). Drawing lines from (width/2, height/2) makes the lines intersect in more complex ways, but I preferred how the 3 vertex ends of the curves are more dynamic with (0, 0) as starting point.

Just vertexes on deltoid curves
Lines drawn from (0, 0) only

Lines drawn from (width/2, height/2)

Final iteration with lines drawn from (0, 0) and vertexes of deltoid curves
Final iteration with size affected by mouse position

The hardest part of the process was incorporating the mouse position into the curves without messing up the shape, then I realized I could use mouse position by mapping it to make it a scale factor.

cduong-Project-07-Curves

sketch

//Name: Colleen Duong
//Email: cduong@andrew.cmu.edu
//Section: D
//Project-07

function setup() {
    createCanvas(480, 480);
}


function draw() {
    background(244, 174, 163);

    // draw the curve
    push();
    translate(width/2, height/2); //makes it rotate from the center
    drawEpitrochoid();
    pop();
}

//--------------------------------------------------
function drawEpitrochoid() {
    //Epicycloid: http://mathworld.wolfram.com/Epicycloid.html
    var n = 1000; //amount of control points

    var x;
    var y;

    var a = constrain(mouseX, 0, 300) //radius of inner circle
    var b = 20; //radius of outer circle
    var h = constrain(mouseY, 0, 300); //distance from the vertice (x, y)

    stroke(255);
    noFill();
    beginShape();
    for (var i = 0; i < n; i++) {
        var t = map(i, 0, n, 0, 100);

        x = (a + b) * cos(t) - h * cos(((a + b) / b) * t); //equation for epicycloid
        y = (a + b) * sin(t) - h * sin(((a + b) / b) * t); //equation for epicycloid

        vertex(x, y);
    }

    endShape(CLOSE);


}

I spent a really long time looking through mathworld trying to figure out what kind of curve I want to use and found several spiral-like shapes that I wanted to originally use, but they used an x, y, and z coordinate so I wasn’t sure how that would turn out with p5js so I decided to use my second choice, which was epitrochoid. It took me a while to figure out what to put in for each variable value in the math equations because it was so confusing but I finally created something that I enjoyed looking at (especially the part that just looks like a circle growing smaller when you go from left to right)

Source: http://mathworld.wolfram.com/Epitrochoid.html

adev_Project07_Curves

adev_project_07

var iInc;
var colR;
var colG;
var p;
var q; 
var curveSize;
function setup() {
   createCanvas(480, 480);
  
}

function draw() {
    p = map (mouseY, 0, height, 1, 10);
    q = map (mouseX, 0, width, 1, 15);
	colR = map(mouseX, 0, width, 130, 20);
	colG = map(mouseY, 0, height, 60, 110);
	curveSize = map (mouseX, 0, width, 100, 200);

	var k = p/q;
	 background(colR,colG, 10);


iInc = map (mouseY, 0, height, 0.05, 1.5);	

translate (width/2, height/2);

for (var i = 0; i < TWO_PI * q ; i+= iInc*1.2) {
var r = curveSize * cos (k*i);
var x = r * cos(i);
var y = r * sin(i);
fill(255,);
strokeWeight(iInc*5);
point (x+ random (-1, 1), y+random(-1, 1));

} 
    
}

For this project, I really wanted to play around with the jitter. I’m haven’t done any sort of math in a while so it was challenging for me to find my way around the curves. I decided to have more fun with it aesthetically and use dots to represent the curves because I think they’re more delicate and ephemeral.

The patterns and colours make it feel less mathematical and almost cozy like fall or early winter.


mstropka-Project-07-E

sketch

//Max Stropkay
//Section E
//mstropka@andrew.cmu.edu
//Project_07

var nPoints = 1000;
function setup() {
  createCanvas(480, 480);


}
function drawEpicycloid(){
  // x = (R+r)cos theta - r cos((R+r)/r)theta)
  // y = (R + r)sin theta - rsin(((R+r)/r)theta)

  var R = 100 //radius of large circle
  var r = 10 //radius of small circle
  var a = mouseX //take values of mouse x
  var b = mouseY //take values of mouse y

  //draw curve in center of screen
  push();
  translate(240, 240)
  noFill();
  strokeWeight(.01);

  //draw curve
  beginShape();
  for(var i = 0; i < nPoints; i++){

    var t = map(i, 0, nPoints, 0, TWO_PI);

    var x = (a + r)*cos(t) - (r)*cos(((a + b)/r)*(t))
    var y = (b + r)*sin(t) - (r)*sin(((a + b)/r)*(t))

    //points of curve will be drawn at somewhere within 50 pixels of (x,y)
    vertex(x + random(-50, 50),y + random(50, - 50));
  }
  endShape(CLOSE);
  pop();
}

function draw(){
  drawEpicycloid();
}
//redraw background if the mouse is pressed
function mousePressed(){
  background(255);
}

For this assignment, I used the equation for an epicycloid with the mouse’s location driving certain variables to change the shape as the mouse moves. I can’t say I understand the equation for this type of curve that well so I just started substituting the mouseX and mouse Y value for random variables in the equation until I got something that looked cool. I also added a random value to the x and y coordinates of the points that the program draws.

Here is a screenshot from before I added the random values to the x and y coordinates.


hdw – Project 7 – Curves

sketch

//Helen Wu
//Section A
//hdw@andrew.cmu.edu
//Project 7

function setup() {
    createCanvas(480,480);
    background(255, 71, 123)
}


function draw() {
  push();

  //this is to call the centers of which the sextic functions will be called from
  translate(width/2, height/2);
  beginShape();
  for(var i = 0; i < 25; i++){
    //25 sets the direction of which the curves draw
      var t = map(i,0,100,0,360);
      //t = angle
      var a = map(mouseY, 0, 480, -5, 5);
      //a = control the curvature of the loops
      var x = 4*a*(Math.pow(cos((1/3)*t),3))*cos(t);
      var y = 4*a*(Math.pow(cos((1/3)*t),3))*sin(t);
      //centerX and centerY = center of smaller curves
      var centerX = 10*x
      var centerY = 10*y
  }
  endShape(CLOSE);
  pop();


//drawing below sextics on points along above sextic
  cayleysSextic(centerX, centerY);
  }

function cayleysSextic(centerX,centerY) {
  push();
  //placement of sextics along center
  translate(width/2+centerX,height/2+centerY);
  beginShape();
  for(var i = 0; i < 50; i++){
      //t = angle
      var t = map(i,0,100,0,360);
      //a = control the curvature of the loops
      var a = map(mouseX, 0, 400, -10,10);
      var x = 4*a*(Math.pow(cos((1/3)*t),3))*cos(t);
      var y = 4*a*(Math.pow(cos((1/3)*t),3))*sin(t);
      //center of smaller loop's smaller curves
      noStroke()
      fill(255,255,255,30);
      ellipse(x*3,y*3,1,1);
      //drawing ellipses along the curve
  }
  endShape(CLOSE);
  pop();
}

This project was based on Cayley’s Sextic, which coincidentally looks like a butt. 👀👀

I mapped Cayley’s Sextic along another Cayley’s Sextic, just to see how it would look. I kind of like how cute the final product turned out to be. The centers of one are along the next, both mapped to the mouse position on the canvas.

JDBROWN – Project 7 – C U R V E S

Curve

// Joshua Brown
// Jdbrown@andrew.cmu.edu
// Project 7: Curves
// Section C

function setup () {
    createCanvas (480, 480);
    background (0);
}

function mousePressed () {
    background (0);
}


function draw () {

    stroke (255);
    strokeWeight (2.5);

    // defining variables for drawing line-heavy shapes;
    // linking x variables with the mouseX parameter;

    var x1 = mouseX;
    var y1 = 40;
    var x2 = mouseX;
    var y2 = 440;
    var xMid = width / 2;
    var yMid = height / 2;

    // drawing the spikey, Masonic symbol thing;

    stroke (mouseX / 2 + 20, mouseX / 2, mouseY / 3);
    line (x1, yMid, x2, yMid);
    line (xMid, yMid / 4 - 30, xMid, yMid - 40);
    line (xMid, yMid - 40, xMid - 180, yMid + 180);
    line (xMid, yMid - 40, xMid + 180, yMid + 180);
    line (xMid, yMid - 210, xMid + 180, yMid + 180);
    line (xMid, yMid - 210, xMid - 180, yMid + 180);
    line (x1, yMid, xMid, yMid - 150);
    line (x2, yMid, xMid, yMid - 150);
    line (x1, yMid, xMid, yMid - 80);
    line (-x2 + 480, yMid, xMid, yMid - 80);

    // drawing the inverse (upside-down version);

    stroke (mouseY / 2, 0, mouseX / 3);
    line (x1, yMid, x2, yMid);
    line (xMid, yMid / 4 - 30, xMid, yMid + 40);
    line (xMid, yMid + 40, xMid + 180, yMid - 180);
    line (xMid, yMid + 40, xMid - 180, yMid - 180);
    line (xMid, yMid + 210, xMid - 180, yMid - 180);
    line (xMid, yMid + 210, xMid + 180, yMid - 180);
    line (-x1 + 480, yMid, xMid, yMid + 150);
    line (-x2 + 480, yMid, xMid, yMid + 150);
    line (-x1 + 480, yMid, xMid, yMid + 80);
    line (x2, yMid, xMid, yMid + 80);
    fill (255);

    ellipse (width/2, height/2, 30, 30);

    // drawing the circles which comprise the central diamond shape;

    push();

    translate (width/2, height/2);
    rotate (radians (mouseX));

    fill (255, 25);
    ellipse (-240, -240, 600, 600);
    ellipse (-240, height - 240, 600, -600);
    ellipse (width - 240, -240, 600, 600);
    ellipse (width - 240, height - 240, 600, 600);

    pop ();

    // drawing circles on the fringes, to increase dimensionality;

    push ();

    translate (width/2, height/2);
    rotate (radians (mouseY));

    fill (0, 25);
    ellipse (-240, -240, 300, 300);
    ellipse (-240, height - 240, 300, -300);
    ellipse (width - 240, -240, 300, 300);
    ellipse (width - 240, height - 240, 300, 300);

    pop ();

    // drawing smaller fringe circles to increase trippiness;

    push ();

    translate (width/2, height/2);
    rotate (radians (mouseX));

    fill (0, 25);
    ellipse (-240, -240, 150, 150);
    ellipse (-240, height - 240, 150, -150);
    ellipse (width - 240, -240, 150, 150);
    ellipse (width - 240, height - 240, 150, 150);

    pop ();

    // small white circles! Why not!

    push ();

    translate (width/2, height/2);
    rotate (radians (mouseX));

    fill (255);
    ellipse (-240, -240, 80, 80);
    ellipse (-240, height - 240, 80, -80);
    ellipse (width - 240, -240, 80, 80);
    ellipse (width - 240, height - 240, 80, 80);

    pop ();

}


I was interested in the petal-ish curve shapes, since I didn’t quite understand how to translate a lot of the more complicated algebraic maths into code.