NatalieKS-LookingOutwards-08

Eyeo 2015 – Jesse Louis-Rosenburg and Jessica Rosenkrantz from Eyeo Festival // INSTINT on Vimeo.

The duo Jessica Rosenkrantz and Jesse Louis-Rosenberg founded Nervous System in 2007, when the two were still in school. Jessica studied biology and architecture at MIT and Harvard Graduate School of Design, and Jesse studied math and computer science at MIT. The duo are based in Somerville, MA. They describe their philosophy as “digital gardening”; rather than cultivate plants, they cultivate algorithms, and they breed systems with their own innate behaviors which they can manipulate and sculpt. They also focus on three areas of research: science & nature, digital fabrication, and co-creation. During their presentation, they employed a large number of visuals and spoke very clearly, so that everyone would be able to understand their work.

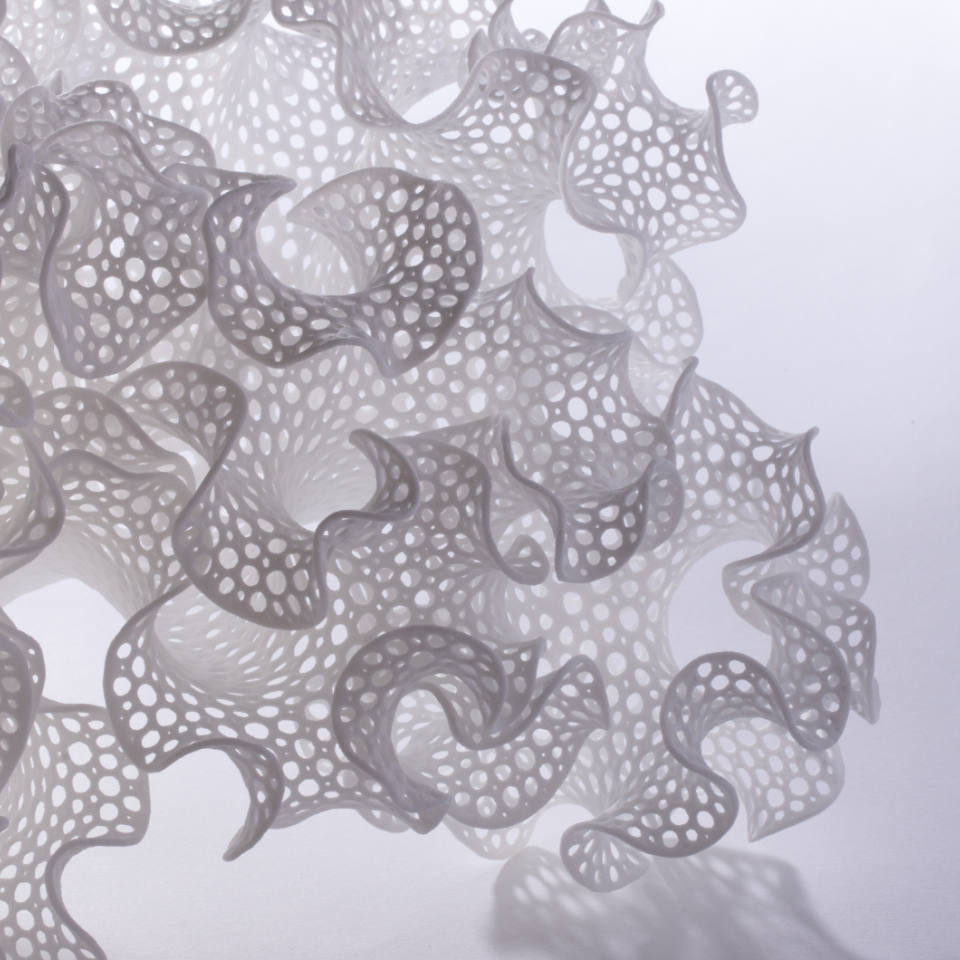
There is a lot of emphasis on studying how patterns and forms emerge in nature, and how new technology in digital fabrication can generate these patterns. They mostly study organic forms and patterns, which I really admire. They try to create these organic forms through innovative digital fabrication, giving rise to new textiles for potential products. It’s really fascinating how they use nature and biology to computationally create unique forms.

One project of theirs I especially love is Floraform, which studies and generates differential growth seen in plants. Patterns in nature are always something I have been interested in, and seeing them generated through computation is especially cool.

florescence ornata 2

Looking Outwards-07-ssontag-Selfiecity

This work by Moritz Stefaner compiled 3200 selfies taken by people from around the world to analyze the selfie phenomenon of our generation. They “Rich media visualizations (imageplots) assemble thousands of photos to reveal interesting patterns.” There are many parts of this project that analyze different aspects of each selfie and how each selfie was taken. Some of these demographics include, place taken, age of the selfie takers, and gender of the selfie takers. They also analyzed each photo to see how the photo was taken. Whether the person is looking up, down, left or right. It also analyzed their emotions, the tilt of their head, how open their mouth was, and whether or not they are wearing glasses. All of this information was then stored and graphically represented beautifully with sheets of infographics.

The Documentation

Here is a video that compiled their work.

danakim-Project-07

sketch

//Dana Kim
//danakim@andrew.cmu.edu
//Section D
//Project-07

var nPoints = 30;

function setup() {
  createCanvas(480, 480);
}

function drawCurve() {
  var cx = constrain(mouseX, 100, 400);
  var cy = constrain(mouseY, 100, 400);

  noFill();
  beginShape();
  for(var i = 0; i < nPoints; i++){
    strokeWeight(random(.5,3.5));
    var t = (i/1.5)*500; //determines the angle of the vertexes
    var a = (cx/.5); //determines the scale of curve
    var px = (1/cos(t)+(a*cos(t)))*cos(t);
    var py = (1/cos(t)+(a*cos(t)))*sin(t);
    stroke(cx, 0, cy);
    ellipse(px, py, 5, 5); //creates ellipses along points of curve
    stroke(0, cx, cy);
    vertex(px*1.5, py*1.5); //creates curves
  }
  endShape(CLOSE);
}

function draw() {
  drawCurve();
}

I used the Conchoid of de Sluze roulette curve for this project. I made two different, yet connected, objects within the drawing with this curve. One of the set of curves was written to be made of ellipses that are placed on points along the curve. The second set just draws the curves as they are. The scale and colors were set to change as the mouseX and mouseY changes.

rkondrup-project-07-Composition-with-Curves

sketch

// ryu kondrup
// rkondrup@andrew.cmu.edu
// section D
// project-07-Composition-with-Curves


// http://mathworld.wolfram.com/DevilsCurve.html
function setup() {
    createCanvas(480, 480);
    frameRate(20);
    //dark grey bg
    background(40);
    stroke(255);
    fill(40);
}

function draw() {
    //to move object to center and rotate
    push();
    translate(width / 2, height / 2);
    rotate(2*PI*mouseX/480)
    drawDevilsCurve();
    pop();
}

function drawDevilsCurve() {
        var bigRange = 100;
        var t = map(i, 0, bigRange, 0, 100);
        var b = map(mouseY, 100, height-100, 0, 50);
        var a = map(mouseX, 100, height-100, 0, 200);

//to draw actual devil's curve
    fill(40);
    beginShape();
    for (var i = 0; i < bigRange; i++) {
        var t = map(i, 0, bigRange, 0, 2*PI);
//x and y for parametric equation
        var x = cos(t)*sqrt((sq(a)*sq(sin(t))) - sq(b)*sq(cos(t))/(sq(sin(t))-sq(cos(t))));
        var y = sin(t)*sqrt((sq(a)*sq(sin(t))) - sq(b)*sq(cos(t))/(sq(sin(t))-sq(cos(t))));
        // change value with mouseposition
        fill(mouseX/2, mouseX/2, mouseX/2);
        // make outline slightly lighter than fill
        stroke(mouseX/2+20, mouseX/2+20, mouseX/2+20)
        //to draw each frame
        vertex(x, y);
    }
    endShape(CLOSE);

}

function mousePressed() {
    //to reset background on click
    background(40);
}

Before starting this project I assumed it would be relatively easy. Upon starting, however, I had an unexpectedly difficult time getting my code to display. After I finally did get it to display, it turned out that the curve I had chosen was not of the highest aesthetic quality, i.e. it looks like a chunky spider. Nevertheless, I decided to work with it, and ended up choosing a monochromatic color scheme as an experiment with changing gradients.

hyt-Project-07: Infinity Curve Composition

hyt-07-project

// helen tsui
// 15-104 section d
// hyt@andrew.cmu.edu
// project-07-composition-waves


function setup() {
    createCanvas(480, 480);
    background(44, 66, 81, 100);
}


function draw() {
    drawcochleoid();

}

function drawcochleoid() {
    // Eight Curve
    map(mouseX, 0, width, 0, 200);
    beginShape();
    //stroke(209, 104, 104); //red
    stroke(100 + mouseX / 2.5);
    strokeWeight(0.5);
    //fill(204 - i * 2, 46, 32);
    fill(0);
    //infinity
    translate(width / 2, height / 2);
    for(var i = 0; i < mouseX / 2; i += 0.5) {
        var a = 1.9 * i; 
        var t = 6 * i;
        var x1 = a * sin(t);
        var y1 = a * sin(t) * cos(t);
        var y2 = a * sin(t);
        var x2 = a * sin(t) * cos(t);
        vertex(x1, y1);
    }
    endShape();

    // vertical shape
    beginShape();
    for(var i = 0; i < mouseX / 2; i += 0.5) {
    var a = 0.9 * i; 
    var t = 12 * i;
    var y2 = a * sin(t);
    var x2 = a * sin(t) * cos(t);
    vertex(x2, y2);
    }
    endShape();
}


For this project, I browsed on the internet in search for parametric equations that could be embedded within the code, and after some search found the “infinite loop” sign that I was able to use. To create some dimensionality, I altered the color values in order to change the greyscale. Also, for the background part I happened to change values and created a similar “noise effect” as the background.

I also experimented with different proportions that led to different results, such as this one. If I had more time I wish to play with the details more to achieve a better landscape-like picture.

NatalieKS-Project-07

This project was pretty difficult for me since I hadn’t worked with trig functions and parametric equations in over a year. Most of the time spent on this was just trying to figure out what the equations actually did when implemented in p5js, and understanding what i needed to change in order to get my desired result. I wanted to draw a little picture, and when I saw the ellipse evolute, it reminded me of the stars from Peter Pan. The star changes size and color as you move the mouse. I would’ve liked to try to create some kind of glow around the stars, and I tried using filter() and blur(), but both functions messed with the frame rate in a way that I didn’t know how to fix, so I abandoned the idea. I tried to reference this image, just because I liked the colors and shape. 

sketch2

//Natalie Schmidt
//nkschmid@andrew.cmu.edu
//Section D
//Project-07

//taken from examplde code
var nPoints = 100;
var R; //for color "r"
var G; //for color "g"
var B; //for color "b"

function setup() {
    createCanvas(300, 480);
    frameRate(20);
}

function draw() {
//draw the two stars
    background(22, 42, 67);
    push();
    translate(width - 70, height-400);
    drawLargeEllipseEvolute();
    pop();
    push();
    translate(width- 120, height - 350);
    drawLargeEllipseEvolute();
    pop();

    fill(255);
    textSize(24);
    text("Second star to the right", 25, 420);
    text("and straight on til morning!", 10, 450);
    //draw small random stars
    //modified code from
    //http://alpha.editor.p5js.org/nanou/sketches/rJ-EMpxa
    fill(255);
    var star = {x : 100, y : 50};
    star.x = random(0, width);
    star.y = random(0, height);
    ellipse(star.x, star.y, 4, 4);
    ellipse(star.x, star.y, 4, 4);
    //draw Peter Pan!
    drawPeter();
}

function drawLargeEllipseEvolute() {
//modified version of the example code
    var x;
    var y;
    var a = constrain(mouseX, 0, width);
    //map the value so it only expands a little
    var a1 = map(a, 0, 300, 0, 15);
    var b = constrain(mouseY, 0, height);
    //map the value so it expands only a little
    var b1 = map(b, 0, 300, 0, 15);
    //change colors with mouse
    R = map(mouseX, 0, width, 138, 255);
    G = map(mouseX, 0, width, 153, 255);
    B = map(mouseX, 0, width, 196, 255);

    fill(R, G, B);
    stroke(61, 80, 112);
    beginShape();
    for (var i = 0; i < nPoints; i++) {
        var t = map(i, 0, nPoints, 0, TWO_PI);

        x = ((sq(a1) - sq(b1))/a1) * pow(cos(t), 3);
        y = ((sq(b1) - sq(a1))/b1) * pow(sin(t), 3);
        vertex(x, y);
    }
    endShape(CLOSE);
}

function drawPeter() {
//draw Peter Pan!
    fill(0);
    //head
    ellipse(125, 225, 20, 20);
    push();
    //body
    translate(113, 252);
    rotate(35);
    ellipse(0, 0, 20, 40);
    pop();
    //left leg
    push();
    translate(98, 270);
    rotate(35);
    ellipse(0, 0, 7, 25);
    pop();
    //right leg
    push();
    translate(110, 275);
    rotate(35);
    ellipse(0, 0, 7, 25);
    pop();
    //left foot
    ellipse(91, 278, 8, 8);
    //right foot
    ellipse(107, 286, 8, 8);
    //left arm
    push();
    translate(102, 236);
    rotate(90);
    ellipse(0, 0, 8, 25);
    pop();
    //right arm
    push();
    translate(130, 250);
    rotate(90);
    ellipse(0, 0, 8, 25);
    pop();
    //peter pan hat!
    triangle(118, 216, 123, 196, 133, 221);
    //feather on hat
    stroke(4);
    line(120, 215, 115, 198);
}

rkondrup-Looking-Outwards-07

visualization of bike rental program in NYC updated in real-time
Nicholas Felton is a graphic artist, designer, and creator of BikeCycle, a data visualization set which plots activity from a bike sharing program in New York City. The information was gathered over the duration of a year and updates in real time to correspond to the same date and time of 2014 when the information was gathered. This sort of delayed but real-time data visualization is effective not only in representing the locations of particular events or paths, but it also allows for a much deeper analysis of data because it is separates information into an accurate timeline, allowing viewers to perceive changes in activity over time. The advantage of utilizing such a means of visualization over more regular representational methods is that rental bike use can be related to time of day, time of year, and other factors, data which would otherwise be lost in the quagmire of conventionally compiled data sets.
I admire this project because it takes something which appears on the surface to be intrinsically two-dimensional and static and turns it into something more that is dynamic and even more informative than the standard model for data mapping. I expect that the points are placed over a static map of New York City and that the points of an array which correspond to certain times of day are called and plotted as the time and date changes.

enwandu-Project-07-Curves

curves

// Emmanuel Nwandu
// enwandu@andrew.cmu.edu
// Section D
// Project-07-Curves

function setup() {
    createCanvas(400, 400);
}

function draw() {
  background(0);
  translate(width/2, height/2);  // Center drawing on canvas
  drawEpitrochoid(); // Calls the function drawEpitrochoid
}

// Creates the geometry of the Epitrochoid curve
function drawEpitrochoid() {
    noFill();
    stroke(200, 0, 0);

    var points = 750;
    var x;
    var y;
    var h = constrain(mouseX, 0, 250)
    var a = 375;
    var b = a/constrain(mouseY, 0 , 250) //Constrains the width of geometry created
    // by the curves between the top and bottom edge of the canvas

    beginShape();
        for (var i=0; i < points; i++) {
            var t =map(i, 0, points, 0, TWO_PI);
            // Equation of epitrochoid applied to the x and y variables
            x = (a-b)*cos(t) + h*cos(((a-b)/b)*t)
            y = (a-b)*sin(t) + h*sin(((a-b)/b)*t)
            vertex(x, y);
        }
    endShape();
}

I ended up going for an Epitrochoid curve, but I bounced between that and the logarithmic spiral as an option. I played around with both, but ended up going for the Epitrochoid curve. I was initially confused about what parameters of the drawing would be controlled by what variables, but I played around with it for a while until I understood how my manipulation of the code influenced my drawing. I would suggest moving slowly across the canvas, in both x and y directions to see the full breadth of geometry generated by the code.

Source: http://mathworld.wolfram.com/Epitrochoid.html

enwandu-Looking Outwards-07

Cyclotone III | Fulldome Audiovisual Projection | 2015

Paul Prudence

This is an excerpt, Prudence associates with his Cyclotone project.

“By gyro-static action, The Machine is transparent to successive intervals of time. It does not endure or ‘continue to be’, but rather conserves its contents outside of time, sheltered from all phenomena. The Machine’s immobility in Time is directly proportional to the rate of rotation of its gyro stats in space.”

–From How to Construct a Time Machine, Alfred Jarry.

Paul Prudence is a live-cinema artist, well versed in the area of time-based geometric narratives, and audiovisuals. Many of his projects, including ‘Cyclotone’ explore very abstract avenues to combine sound, space, and form in an interesting fashion. He is inspired heavily by constructivist minded artists, particle accelerators, and four-dimensional place. His project embodies his artistic sensibility, and a clear connection can be seen between what inspires him, and his artwork.

I really admire the project, because of the intersection between sound and space in the project. It is quite compelling, despite being a 2D representation on a screen. Much of my admiration comes from be being in awe what he could create, it is extremely satisfying to watch. Even the still images successfully suggest motion. Prudence produces a mesmerizing, floor-to-ceiling sensation by cross-wiring electroacoustic sound design and conceptual video material.

cduong-Project-07-Curves

sketch

//Name: Colleen Duong
//Email: cduong@andrew.cmu.edu
//Section: D
//Project-07

function setup() {
    createCanvas(480, 480);
}


function draw() {
    background(244, 174, 163);

    // draw the curve
    push();
    translate(width/2, height/2); //makes it rotate from the center
    drawEpitrochoid();
    pop();
}

//--------------------------------------------------
function drawEpitrochoid() {
    //Epicycloid: http://mathworld.wolfram.com/Epicycloid.html
    var n = 1000; //amount of control points

    var x;
    var y;

    var a = constrain(mouseX, 0, 300) //radius of inner circle
    var b = 20; //radius of outer circle
    var h = constrain(mouseY, 0, 300); //distance from the vertice (x, y)

    stroke(255);
    noFill();
    beginShape();
    for (var i = 0; i < n; i++) {
        var t = map(i, 0, n, 0, 100);

        x = (a + b) * cos(t) - h * cos(((a + b) / b) * t); //equation for epicycloid
        y = (a + b) * sin(t) - h * sin(((a + b) / b) * t); //equation for epicycloid

        vertex(x, y);
    }

    endShape(CLOSE);


}

I spent a really long time looking through mathworld trying to figure out what kind of curve I want to use and found several spiral-like shapes that I wanted to originally use, but they used an x, y, and z coordinate so I wasn’t sure how that would turn out with p5js so I decided to use my second choice, which was epitrochoid. It took me a while to figure out what to put in for each variable value in the math equations because it was so confusing but I finally created something that I enjoyed looking at (especially the part that just looks like a circle growing smaller when you go from left to right)

Source: http://mathworld.wolfram.com/Epitrochoid.html