dayoungl Project 04

sketch

//Sharon Lee
//dayoungl@andrew.cmu.edu
//Section E
//Project 4
var ychange = 30;
var xchange = 10; 
var x1 = 1;
var x2 = 150;
var x3 = 100;
var y1 = 200;
var y2 = 1;
var y3 = 55;
var r;
var g;
var b;
function setup(){
	//randomzied colour
	r = random(255);
	g = random(255);
	b = random(255);
	createCanvas(300,400);	
}

function draw() {
	background (255);
	for(var i = 0; i < 100; i +=1){
		strokeWeight(0.5);
		stroke(0);
		line(x2, mouseY, 300 , ychange *i);
		line(x2, mouseY, 0 , ychange *i);
		stroke(r,g,b);
		strokeWeight(1);
		line(mouseX, ychange * i, xchange * i, y2); 
		line(x2, y1, 300, ychange *i);
		line(x2, y1, 0, ychange * i);
	}
}

//when mouse is clicked, string changes colour
function mousePressed (){
	stroke(r,g,b);
	r = random(255);
	g = random(255);
	b = random(255);
}

I wanted to make my string art minimal as possible because I like minimalistic art. I like the fact that this looks like a graphic poster.

Project-04-StringArt-sjahania

sketch

var density; //changes how thick the arcs are

//changes the colors
var col1; 
var col2;


function setup() {
    createCanvas(400, 300);
    background(240);
}

function draw() {
	//redraws a new canvas every time the mouse is pressed
	fill(240);
	rect(0,0,400,300);

	//sets the colors based on the x coordinate of the mouse
	col1 = mouseX/(400/255);
	col2 = mouseX/(400/255);

	for (var a = 0; a < 400; a += density) {
		//draws the top left arc
		stroke(180,255 - col2,180);
		line(a, 0, 0, 400-a);

		//draws bottom left arc
		stroke(255 - col1,180,180);
		line(400 - a, 300, 0, 300 - a);

		//draws bottom right arc
		stroke(180,col2,180);
		line(a, 300, 400, 300 - a);


		//draws top right arc
		stroke(col1,180,180);
		line(a, 0, 400, a);
	}

}
//changes the thickness of the arcs by drawing a different # of lines
function mousePressed() {
	density = random(5,12);
}


Using the for loop took me a while because it is different enough from python to really throw me off. Once I figured it out, I had fun making different shapes, but I settled for something symmetrical because the other shapes I made weren’t very aesthetically pleasing. Then I played with colors.

katieche – project 04

katieche-04

 	var x = 200;
 	var curve = 400;
 	var v = 7;


function setup() {
	createCanvas (400, 300);
}

function draw(){
		background(240);

	for (var i = 0; i<=500; i++) {
		strokeWeight (0.2);
		stroke (180);
		// bottom left
		line(i*v, height, x, height-i*v);
		// bottom right
		line (mouseX, i*v, i*v, mouseY);
		// top right
		line(x, i*v, width-(i*v), 0); 
		// top left
		line(i*v, mouseY, mouseX, i*v);

	}

}

This project was difficult for me as it was hard for me to understand which values to multiply to which variable. It was a lot of guess and check and hard to get the curves to do exactly what I wanted, but I think the end result is pretty fun to play with.

Ziningy1 – SectionC – Project 4 – String art

sketch

//Zining Ye 
//15104 lecture 1 recitation C
//ziningy1@andrew.cmu.edu 
//Project-04

var x=100;
var xstep=3; 

var y=1;
var ystep=3;

function setup() {
    createCanvas(400, 300);
    strokeWeight(1);
}

function draw() {
    background(0);
    angleMode(DEGREES);
    
    //the red twisted string curve 
    stroke(250,200,200);
    for (var i = 0; i < 400; i += 2) {
      
      line(3*i, height-2*i-y, 2*i, 1.5*i+20+y);
     
    }
    
    //the right and left green string curve 
    stroke(200,250,200);
    for (var i = 0; i<200; i += 2){
    
    line(x, 2*i,3*i,height/2+2*i+x);

    line(400-x,2*i,400-3*i,height/2+2*i+x);
    }
    
    //blue rotational string curve
    stroke(200,200,250);
    for (var i = 0; i<300; i += 2){
    line(x+i,300*sin(i),width-x-20-i,100*sin(i))
      
      
    }

    //adding the xstep and ystep will make the string start moving  
    //the conditonal makes the repeat between left and right, 

    y += ystep;
    if(y>300){
    y = -y
    
    }

    x += xstep;
    if(x>600){
    x= -x;
    
    } 


}


It is pretty abstract for me to create a string art image in my mind before coding it. I started by randomly test some of the combination of line positions, then I started to understand more intuitively how i would like to construct my art. I find adding the xstep, ystep very effective in making the string art in motion, which also create some sort of visual illusion that is pleasing to look at.

ljkim looking outward 04

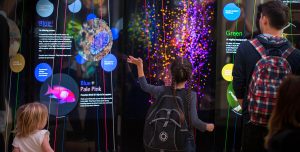
I went to the California academy of sciences this summer in San Francisco. Its a fairly new museum with highly interactive exhibits.

One exhibit in particular was called the Color of Life. It allowed users to pluck a string of color, and a sound would emit. Through this interaction, guests could “hear” color and play a medley based on their mood. I admired this project because it allowed an intangible feeling of sound for color. I thought the interaction was especially memorable because it engages users to think beyond what a color normally is deemed as.

I suppose the algorithms used for it were simple, if a string is plucked, emit this sound.

dchikows – Section C – Project – 04 – String-Art

sketch

// David Chikowski
// Section C
// dchikows@andrew.cmu.edu
// Project-04 


function setup() {
    createCanvas(400,300);
    background(0,0,255);


    //top left line
    x1 = 0;
    y1 = height;
    x2 = 0;
    y2 = 0;
   
   //bottom right line 
    x3 = width
    y3 = height
    x4 = 0
    y4 = height

    //middle left line
    x5 = height
    y5 = width
    x6 = 0
    y6 = 0

    //middle right line
    x7 = height
    y7 = width
    x8 = 0
    y8 = 0

    //for loop for all lines 
    for (loop = 0 ; loop < 20 ; loop += 1) {

        //top left line
        stroke(255,0,0);
        line(x1, y1, x2, y2); 
        y1 -= height/10; 
        x2 += width/10; 

        //bottom right line 
        line(x3, y3, x4, y4);
        y3 -= height/10;
        x4 += width/10;

        //middle left line
        line(x5 -200, y5, x6, y6); //translates curve 200 points 
        y5 -= height/10;
        x6 += width/10;

        //middle right line
        line(x7 - 100, y7 + 150, x8, y8); //translates points 100 left, 150 down
        y7 -= height/10;
        x8 += width/10;


}


    }

I found this to be an interesting project to use for loops on. I believe it will be very useful in the future to use for loops for coding material similar to this since it can save a to of time.

Lrospigl Project 04 line pattern

When I started with this project, I didn’t have a clear idea of what I wanted my image to look like. However, I did know I wanted the to be a play in line quantity that the user was able to have control over. I made it so that if you move your mouse to the top left corner of the canvas, you will see the darkest color possible, as well as the highest concentrations of lines. And if you move your mouse to the bottom right corner, you will see the least amount of lines, and the lightest/ least visible color.

sketch

//Laura Rospigliosi
//Section C
//lrospigl@andrew.cmu.edu
//Project-04-String art

function setup() {
  createCanvas (400, 300);
}

function draw () {
  background (240);

var r = mouseX; 
var g = mouseY;
var x1 = width/2;
var y1 = height/2;
var x2 = width/5;
var y2 = height/5;
var spacing = 5;
strokeWeight (0.5);

//line sequence one
stroke (r, g, 150);
//top left quadrant `
  for (x = width/5; x < width/2 + 10; x += spacing) {
    line (x, y1, x2, y2);
  }
  for (y = height/5; y < height/2; y += spacing) {
    line (x1, y, x2, y2);
  }
  
//top right quadrant
  push ();
  scale (-1, 1);
  translate (-400, 0);
    for (x = width/5; x < width/2 + 10; x += spacing) {
    line (x, y1, x2, y2);
  }
  for (y = height/5; y < height/2; y += spacing) {
    line (x1, y, x2, y2);
  }
  pop();
  
//bottom left quadrant
  push ();
  scale (1, -1);
  translate (0, -300);
    for (x = width/5; x < width/2 + 10; x += spacing) {
    line (x, y1, x2, y2);
  }
  for (y = height/5; y < height/2; y += spacing) {
    line (x1, y, x2, y2);
  }
  pop();
  
//bottom right quadrant
  push ();
  scale (-1, -1);
  translate (-400, -300);
    for (x = width/5; x < width/2 + 10; x += spacing) {
    line (x, y1, x2, y2);
  }
  for (y = height/5; y < height/2; y += spacing) {
    line (x1, y, x2, y2);
  }
  pop();


//line sequence two
//top left quadrant
  for (x = 0; x < width/5; x += spacing) {
    line (x, y1, x2, y2);
  }
  for (y = 0; y < height/5; y += spacing) {
    line (x1, y, x2, y2);
  }
  
//top right quadrant
  push ();
  scale (-1, 1);
  translate (-400, 0);
  for (x = 0; x < width/5; x += spacing) {
    line (x, y1, x2, y2);
  }
  for (y = 0; y < height/5; y += spacing) {
    line (x1, y, x2, y2);
  }
  pop();
  
//bottom left quadrant
  push ();
  scale (1, -1);
  translate (0, -300);
  for (x = 0; x < width/5; x += spacing) {
    line (x, y1, x2, y2);
  }
  for (y = 0; y < height/5; y += spacing) {
    line (x1, y, x2, y2);
  }
  pop();
  
//bottom right quadrant
  push ();
  scale (-1, -1);
  translate (-400, -300);
  for (x = 0; x < width/5; x += spacing) {
    line (x, y1, x2, y2);
  }
  for (y = 0; y < height/5; y += spacing) {
    line (x1, y, x2, y2);
  }
  pop();

//curves
var c2 = height;
var c3 = width;
var c4 = height;
var spacing2 = map(mouseX, 0, width, 5, 15);

//curves
  noFill();
  stroke (0)
  strokeWeight (0.5);

  for (c1 = width/10; c1 < width*(2/3); c1 += spacing2) {
    curve (0, 0 ,0, 0, c1, c2, c3, c4);
    }

  push ();
  scale (1, -1);
  translate (0, -300)
    for (c1 = width/10; c1 < width*(2/3); c1 += spacing2) {
    curve (0, 0 ,0, 0, c1, c2, c3, c4);
    }
  pop();

  push ();
  scale (-1, 1);
  translate (-400, 0);
    for (c1 = width/10; c1 < width*(2/3); c1 += spacing2) {
    curve (0, 0 ,0, 0, c1, c2, c3, c4);
    }
  pop();
  
  push ();
  scale (-1, -1);
  translate (-400, -300);
    for (c1 = width/10; c1 < width*(2/3); c1 += spacing2) {
    curve (0, 0 ,0, 0, c1, c2, c3, c4);
    }
  pop();

}

monicah1_lookingoutward_04

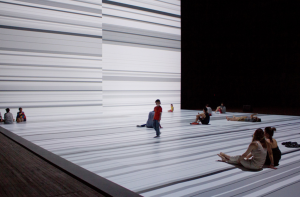
Ryoji Ikeda- The Transfinite

Ryoji Ikeda, japanese artist and electronic composer, installed The Transfinite at the park avenue armory in new york city. The installation is about the concept of infinity, rationality, and the beauty of data. In real time, it presents the analysis of artists’ soundtrack in visual and audio, a combination of music and mathematics. I went to one of his installation in downtown pittsburgh last year. The experience was like nothing else that I had before. It was beautiful to hear the music with no lyrics, moreover, looking at the digital installation matching the music was extraordinary. It was a wonderful experience both physically and digitally. The amazing part is that the digital visual and audio was created by our daily datas. I imagined I might be part of the installation too.

svitoora – 04 Gravity 2.0

Gravity

//
// Supawat Vitoorapakorn
// Svitoora@andrew.cmu.edu
// Section E
//
// Gravity 2.0 is a point mass dynamic drawing inspired
// from physics, nature, and falling off a skateboard.
// f = G (m1*m2)/d^2
// f = G sum(m)/(d from avg)^2


// World Model Setup /////////////////////////////////////
var max_curves = 4; //Limit amount of drawings

var w = 300;
var h = 400;
var t = 1; // time variable
var g = 12; // gravity

var ball;
var balls = []; // Local Objects
var ballz = []; // Global Object
var ball_size = w * .010 // Default object size

var max_count = 35;
var auto_every = 40;
var auto_create = 125;
var max_line = 1000; // Prevents crash


// Control ///////////////////////////////////////////////

// Creates new object in system given (x,y)
function ball_create(x, y) {
	this.x = x;
	this.y = y;
	this.vx = 0;
	this.vy = 0;
	this.r = ball_size;
	this.m = 1;
	this.ALPHA = 255
}

function mousePressed() {
	ballz.push([]);
	// print("Added Yo");
}

// Add new object and delete oldest object
function mouseDragged() {
	if (t % 10) {
		ballz[ballz.length - 1].push(new ball_create(mouseX, mouseY));
	}
	if (ballz[ballz.length - 1].length >= max_count) {
		ballz[ballz.length - 1].splice(0, 1)
	}
}

// World /////////////////////////////////////////////////


// Maintain global mass of system
function sum_mass(balls) {
	sum_m = 0;
	for (i in balls) {
		sum_m += balls[i].m;
	}
	return sum_m;
}

// Determines the system's average position X
function average_posX(balls) {
	if (balls.length == 0) {
		return w / 2;
	};
	var sum_x = 0;
	for (i in balls) {
		sum_x += balls[i].x;
	}
	avg = sum_x / balls.length
	return avg;
}

// Determines the system's average position Y
function average_posY(balls) {
	if (balls.length == 0) {
		return h / 2;
	};
	var sum_y = 0;
	for (i in balls) {
		sum_y += balls[i].y;
	}
	avg = sum_y / balls.length;
	return avg
}

// Apply gravity for all objects in the system
function gravity(balls) {
	var avg_x = average_posX(balls);
	var avg_y = average_posY(balls);
	var speed = .005 //0-1 Multuplier for controlling velocity of attratction
	for (i in balls) {
		d = dist(balls[i].x, balls[i].y, avg_x, avg_y);
		ds = map(d, 0, w / 2, 1, 0); // used to simulate d^2

		// Gravity X
		if (balls[i].x > avg_x) {
			balls[i].x *= 1 - (g * (balls.length * speed));
		} else {
			balls[i].x *= 1 + (g * (balls.length * speed + ds));
		}

		// Gravity Y
		if (balls[i].y > avg_y) {
			balls[i].y *= 1 - (g * (balls.length * speed))
		} else {
			balls[i].y *= 1 + (g * (balls.length * speed + ds));
		}
	}
}

// Add object to system in the middle; // Used at setup()
function add_ball(balls) {
	balls.push(new ball_create(w / 2, h / 2));
}


// Connects all the object in the system via a line
function draw_line(balls) {
	lines = 0
	opacity = 255 * .1

	if (lines < max_line) {
		for (i in balls) {
			var x_1 = balls[i].x;
			var y_1 = balls[i].y;
			for (i in balls) {
				var x_2 = balls[i].x;
				var y_2 = balls[i].y;
				stroke(255, 255, 255, opacity);
				line(x_1, y_1, x_2, y_2);
				lines += 1;
			}
		}
	}
}

// SETUP
function setup() {
	createCanvas(w, h);
	g = .0025;
	background(50);
	balls.length = 0; // Kill all objects in system
}

// Refreshes the systems with new objects
// Removes old objects and add new objects
function auto_refresh(balls, t) {
	// Starts refreshing system at 5 objects
	// every auto_every interval.
	if (t % auto_every == 0 & balls.length > 5) {
		balls.splice(0, 1);
	}
	X = constrain(mouseX, 1, w);
	Y = constrain(mouseY, 1, h)
	if (t % auto_every == 0) {
		balls.push(new ball_create(X, Y));
	}

	// Resets the system to 8 objects once every 500 ms
	// This prevents overload; Array starts at [0]
	if (t % 500 == 0 & balls.length > 8) {
		balls.length = 7;
	}
}

// Draw ////////////////////////////////////////////////////

// Draw all objects in systems mapped by distance from avg
function draw_balls(BALLS) {
	// print("BALLS.length" + BALLS.length)
	for (i in BALLS) {

		var avg_x = average_posX(BALLS);
		var avg_y = average_posY(BALLS);

		var d = dist(BALLS[i].x, BALLS[i].y, avg_x, avg_y);
		var SIZE = map(d, 0, w / 2, -2, 3) //max to min
		print(i + " : " + SIZE)

		noStroke();
		fill(255, 255, 255, 255 * .5);
		ellipse(BALLS[i].x, BALLS[i].y,
			BALLS[i].r * (2 * SIZE),
			BALLS[i].r * (2 * SIZE));
	}
}

function local_gravity(ballz) {
	for (i in ballz) {
		if (ballz[i].length > 1) {
			gravity(ballz[i]);
		}
	}
}

function DIE(BALLS) {
	BALLS.splice(0, 1);
}

function death_ballz(ballz) {
	var populated = 0;
	for (i in ballz) {
		if (ballz[i].length != 0) {
			populated++;
		}
	}
	if (populated > max_curves) {
		DIE(ballz[0]);
	}
}


function refresh_ballz(ballz) {
	if (ballz.length > 4) {
		for (i in ballz) {
			if (ballz[i].length == 0) {
				ballz.splice(i, i + 1);
				ballz.push([]);

			}
		}
	}
}


function draw_ballz(ballz) {
	for (i in ballz) {
		draw_balls(ballz[i]);
	}
}

function draw_lines(balls) {
	for (i in ballz) {
		draw_line(ballz[i]);

	}
}

// Creates Trail
function guider1() {
	stroke(255, 255, 255, 255 * .75)
	line(mouseX, mouseY, pmouseX, pmouseY)
}

// Prompt user to drag via random generation
function guider2() {
	ran1 = random(4, 12);
	if (t % auto_create == 0) {
		ballz.push([])
		ballz[ballz.length - 1].push(new ball_create(mouseX, mouseY));
		ballz[ballz.length - 1].push(new ball_create(pmouseX, pmouseY));
		for (var i = 0; i < ran1; i++) {
			ballz[ballz.length - 1].push(new ball_create(mouseX * random(.75,
				1.25), mouseY * random(.75, 1.25)));
		}
	}
}

// Execute /////////////////////////////////////////////////
function draw() {
	background(50);
	noStroke();
	// Update World
	t = t + 1;
	local_gravity(ballz);
	death_ballz(ballz);
	refresh_ballz(ballz);
	// LOL();

	// // Draw World
	draw_lines(ballz);
	guider1();
	guider2();
	// draw_ballz(ballz);	// For Some reason this doesn't work
	// Maybe it ran out of memory allocation


}

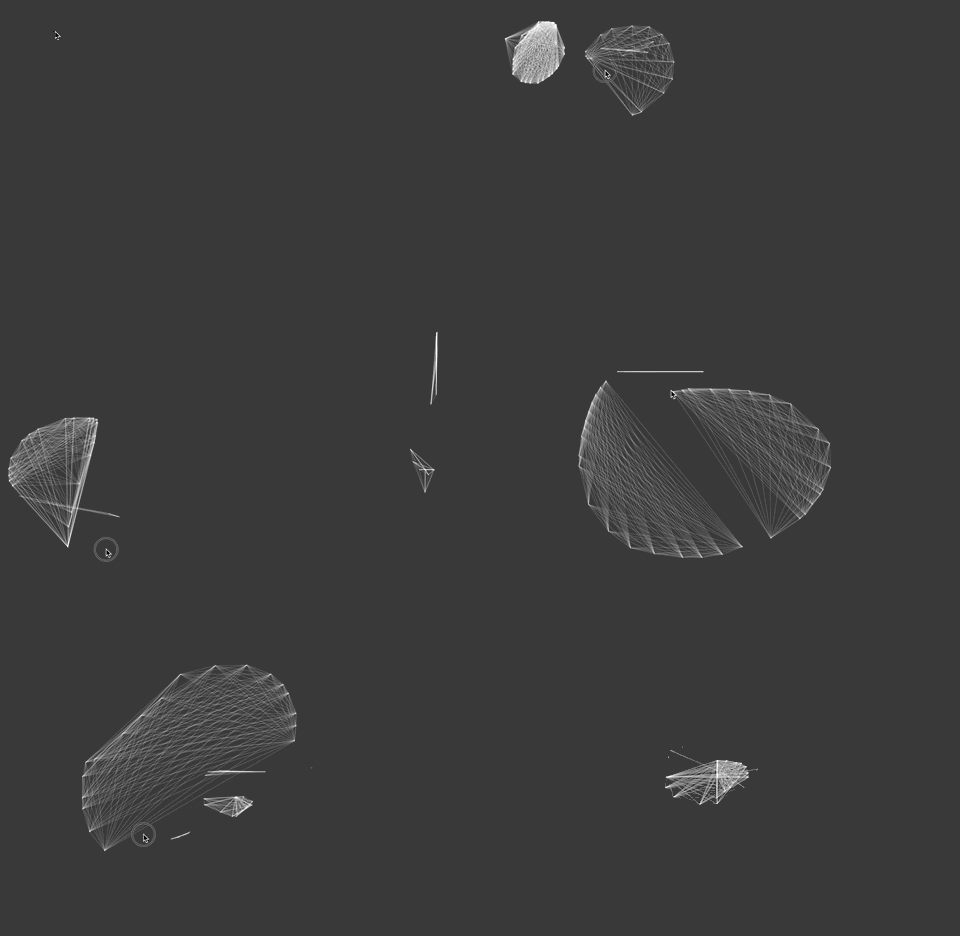
Click and drag to draw shapes. Try writing your name. I struggle with array in arrays. Eventually figured I figured it out.

jwchou-project04-stringart

sketch 285

var ellipseX = 0
var ellipseY = -10


function setup() {
    createCanvas(400, 300);
    background(255, 173, 158);
    strokeWeight(0.5);
}


function draw() {
	createCanvas(400, 300);
	background(255, 173, 158);

	stroke(196, 154, 108);
	for (var i = 5; i < 100; i+=20) {
	line(50, 0, 380, i*0.1+20);
	stroke(27, 117, 188);		
	line(380, i*0.1+20, 0, i*0.2+70);
	stroke(43, 182, 115);
	line(0, i*0.25+70, 350, 0.4*i+150);
	stroke(241, 90, 41);
	line(350, 0.4*i+150, 0, i*1.5+200)

	ellipseX = ellipseX += 3;
    ellipseY = ellipseY += 0.2;
	ellipse(ellipseX, ellipseY, 15, 15);

    if(ellipseX > width) {
    	ellipseX -= 3;
    	ellipseY += 0;
    }


	}

//stroke(150);
//	strokeWeight(0.5);
//	for (var i = 0; i < 30; i++) {
//		line(0, height, 130 + (i*15), 70 - (i));
//	}
//
//	for (var i = 0; i< 500; i++) {
//		fill(255, 255, 0);
//		ellipse(0, height + i * 40, 40, 40);
//	}

}

Here is my… project… I wanted to lines to have some perspective, and I also wanted some kind of physical animation. I think I need to go back and review these concepts later because I don’t have a firm grasp on them yet (and I’m on a severe time crunch).