rkondrup-project-05-wallpaper

sketch

//ryu kondrup
//rkondrup@andrew.cmu.edu
//section d
//project-05-wallpaper

//rectangle width is 120 pixels
var rectHalf = 60;

function setup() {
    createCanvas(480, 480);
    background(155, 213, 198);
}
function draw() {

    //horizontal odd-numbered rows
    for (x = 0; x < 10; x ++ ) {
        for (y = 0; y < 10; y ++) {
            shrimp(x*2*rectHalf, y*4*rectHalf);
        }

    }
    //horizontal even-numbered rows
    for (x = 0; x < 10; x ++ ) {
        for (y = 0; y < 10; y ++) {
            shrimp(x*2*rectHalf-rectHalf, y*4*rectHalf+2*rectHalf);
        }
    }
noLoop();
}

function shrimp(x, y) {
    push();
    translate(x, y);
    darkestRed = color(200, 64, 62);
    darkRed = color(251, 104, 102);
    medRed = color(251, 134, 132);
    white = color(255, 252, 215);
    lightBlue = color(213, 233, 198);
    blue = color(155, 213, 198);

/*    //temporary box
    fill(blue);
    rect(0, 0, 2*rectHalf, 2*rectHalf);
    */

    //background water blue
    strokeWeight(4);
    fill(blue);
    noStroke();
    //left arc
    fill(medRed);
    stroke(white);
    arc(rectHalf, rectHalf,
        2*rectHalf, 2*rectHalf,
        PI/2, 3*PI/2);
    //triangle head
    fill(darkRed)
    triangle(rectHalf, 0,
             2*rectHalf, 0,
             rectHalf, rectHalf);
    //small arc inside
    fill(blue);
    arc(rectHalf, rectHalf+20,
        40, 40,
        PI/2, 3*PI/2);
    //eye
stroke(white);
    fill(darkestRed);
    ellipse(23 + rectHalf, 15, 15);
    //tail polygon
    stroke(white)
    fill(darkRed);
    beginShape();
        vertex(rectHalf, rectHalf + 40);
        vertex(2*rectHalf, rectHalf);
        vertex(2*rectHalf, 2*rectHalf);
        vertex(rectHalf, 2*rectHalf);
    endShape(CLOSE); //still broken
    pop();
}

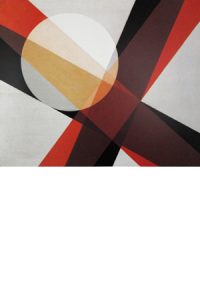
For this design I wanted to create something simple with mellow colors. In making this, I created a single tile and repeated it in staggered rows. I considered overlapping the tiles but visually the overlaps did not seem comfortable so I left them in a snug edge-to-edge arrangement.
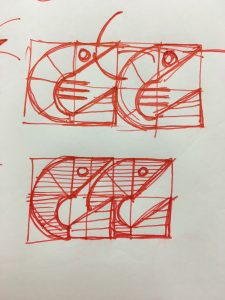
dayoungl: Project -05

sketch

//Sharon Lee
//Section E
//dayoungl@andrew.cmu.edu
//Project 05
function setup() {
    createCanvas(400, 400);
    background(156,255,228);
    var tw = 60;
    var th = 40;
    var oy = 30;
    var ox = 30;
    var z = 10;
    var d = 30;
    //rows
    for (var y = 0; y < 8; y += 1) {
        //columns
        for (var x = 0; x < z; x += 1) {
            //
            var py = oy + y * th;
            var px = ox + x * tw;
            if (y % 2) {
              z = 9;
              stroke(0);
              strokeWeight(5);
              fill(229,223,73);
              stroke(255);
              line(px-30, py, width-20, py);
              rectMode(CENTER);
              rect(px + 30, py, d, d);
              
            } else { 
              z = 10;
              noStroke();
              fill(255,70,138);
              // ellipse(px ,py , d, d);
            }
        }
    }
    noLoop();
}


I worked with simple geometric shapes to create this wallpaper. I was inspired by some of the art-nouveau wallpapers which focused on shape of the plants. The yellow square is an abstract representation of leaves.

rgroves – Wallpaper – section B

sketch

//Becky Groves
//Section B
//rgroves@andrew.cmu.edu
//Project 5 Wallpaper

//dimensions of the pattern
var h = 140;
var w = 200;

function setup() {
    createCanvas(480, 480);  
    background(167, 178, 181);	
}

function draw() {
for (var y = 0; y < height/h; y++){
		for (var x = 0; x < width/w; x++) {
			//change the position of the pattern for each row
			if (y%2 == 0) {
				texas(x * 2 * w, y * h);
				//change the color of the star for each column
				noStroke();
				if (x%3 == 0) {
					fill(255, 255, 255);
				} else
				if (x%2 == 0) {
					fill(255, 0, 0);
				} else {
					fill(0, 0, 255);
				}
				star((x * 2 * w) + w, y * h, 20, 50, 5);
			} else {
				texas(-w + (x * 2 * w), y * h);
				noStroke();
				if (x%3 == 0) {
					fill(0, 0, 255);
				} else
				if (x%2 == 0) {
					fill(255, 255, 255);
				} else {
					fill(255, 0, 0);
				}
				star((x * 2 * w), y * h, 20, 50, 5);
			}
		}
	} 
}


function texas(x, y){ //combine right and left sides of the pattern
	lefttexas(x, y);
	righttexas(x + w, y);
}

function lefttexas(x, y){ //left half of the pattern
	fill(167, 178, 181);
	noStroke();
	rect(x, y, w, h);
	//grass
	fill(142, 130, 78);
	rect(x, y + h - 45, w, 45);
	//windmills
	var a = 25; //distance of first windmill from the left
	var xs = 30; //horizontal spacing
	var yst = 15; //difference in heights from the top
	var ysb = 5; //difference in heights from the bottom
	for (i = 0; i < 3; i++) {
		stroke(223, 218, 207);
		strokeWeight(3);
		line(x + a + (xs * i), y + 30 + (yst * i), x + a + (xs * i), y + h - 10 - (ysb * i));
		line(x + a + (xs * i), y + 30 + (yst * i), x + a + (xs * i) + 6, y + 30 + (yst * i));
		push();
		noStroke();
		fill(223, 218, 207);
		translate(x + a + (xs * i) + 6, y + 30 + (yst * i));
  		rotate(frameCount / 200.0 * (i + 1)); //the blades spin!
  		rotate(45 * (i + 1))
		star(0, 0, 2, 30, 3); 
		pop();
	}
	//fence
	stroke(100);
	strokeWeight(4);
	noFill();
	rect(x + ((11/16) * w), y + 80, (5/16) * w, 50, 10, 0, 0, 10);
	line(x + w - 10, y + 80 + 25, x + w, y + 80 + 25);
	for (i = 1; i <= 4; i++) {
		strokeWeight(2);
		var s = 50/5;
		line(x + ((5/8) * w), y + 80 + (i * s), x + w, y + 80 + (i * s));
	}
	stroke(188, 157, 118);
	strokeWeight(10);
	line(x + ((5/8) * w), y + 80, x + ((5/8) * w), y + h);
}

function righttexas(x, y) {
	push();
	translate(2 * x + w, 0);
	scale(-1, 1);
	lefttexas(x, y);
	pop();
}

//this is from the p5.js reference site
function star(x, y, radius1, radius2, npoints) {
  var angle = TWO_PI / npoints;
  var halfAngle = angle/2.0;
  beginShape();
  for (var a = 0; a < TWO_PI; a += angle) {
    var sx = x + cos(a) * radius2;
    var sy = y + sin(a) * radius2;
    vertex(sx, sy);
    sx = x + cos(a+halfAngle) * radius1;
    sy = y + sin(a+halfAngle) * radius1;
    vertex(sx, sy);
  }
  endShape(CLOSE);
}

For this project I was inspired by the landscape of my home state Texas. I think it looks better at a larger scale so here’s a screenshot of what that would look like:


dchikows – Section C – Looking Outward – 05

Pedro Conti’s Work on Moana

Barges
Side view of Barges
Object Layers

Pedro Conti is a freelance character designer from São Paulo. His most recent work is for Walt Disney Animation Studios on the movie Moana. Conti mainly worked on creating the two barges in the movie and the trash on them. It was a total of 140 shots which he had to code to create. The attention to detail is immediately transparent. Hundreds of tiny objects had to be coded. Not only did all of the tiny objects have to be coded, but they had to be textured as well. One of the biggest challenges was that of making the barges look realistic. Conti started with the bigger graphic elements and worked his way down in layers to smaller objects to reach a final image without any intersecting lines.


rgroves – Looking Outwards 05


Richard Kolker’s series “Reference, Referents” reverses that convention of using photograph as references for paintings. Instead, he takes famous paintings and uses 3D digital modeling techniques to create synthetic photographs of what the original painters may have been looking at. This project is interesting because it asks the question – if an image is indistinguishable from a photograph, does that make it a photograph? His images are every bit as fabricated as the paintings he’s inspired by, but they are meant to look like reference material.

 .    

I particularly liked how he rendered Lazlo Maholy-Nagy’s A19, which is not a representational artwork and one would not assume that artist originally worked with a photograph. Kolker’s interpretation of the stripes as ribbons and the discolored area as a spotlight made me see the original work in a totally different way.

http://www.richardkolker.com/refref.htm

Ziningy1 – Looking Outward 05 – 3D Computer Graphic

Kazuma Morino’s project Build draws my attention immediately while I was browsing through the portfolios of the Computer Graphic World(CGW) website. Then I looked the artist up to find out more information about him. So Kazuma Morino is a Japanese computer graphic artist, who has received many awards in international competitions including SIGGRAPH and Ars Electronica. In the project Build, exhibited in the SIGGRAPH 2003 Art Gallery, many of the built structures in our contemporary urban landscapes are concatenations of pre-fab parts and standardized dimensions. I was specifically intrigued by his way of constructing the board 3D perspective from single building blocks. There is a strong sense of order and rigidity from the highly geometric shapes. Then, I also found the videos of this project(blow), which is even more dazzling from still images. The way of those building cubes distribute and recompose is just very pleasing to look at. I can kind of imagine that this is accomplished by algorithm that resetting the coordinates of each or multiple building cubes in the 3D space every time the variations occur.

mecha-project04-string-art

sketch

//global variables that hold x and y position as well as the amount that is added to both values
//(different x and y variables per function)

var x1 = -100;
var y1 = 0;
var x1Step = 2;
var y1Step = 4;

var x2 = 400;
var y2 = 0;
var x2Step = 2;
var y2Step = 2;

var gradient = 0;
var gradient2 = 256;
var gradient3 = 256;

var x11 = 0;
var x22 = 400;
var y11 = 300;
var y22 = 0;
var x11Step = 0.5;
var y11Step = 1;
var x22Step = 0.5;
var y22Step = 1;

function setup() {
    createCanvas(400,300);
}

function draw() {
    //makes background change color value
    background(gradient3--);
    //calls functions that produce lines
    lines();
    lines2();
    lines34();
}

//lines converging in center
function lines(){
    var x1constrain = constrain(mouseX,-100,0);
    strokeWeight(0.8);
    for(var i=0;i<1000;i+=10){
        stroke(gradient+i);
        line(x1constrain+i, 0, 0, y1-i);

    }
    x1+=x1Step;
    y1+=y1Step;
}

//lines converging in center
function lines2(){
    var y2constrain =constrain(mouseX,-100,0);
    strokeWeight(0.8);
    for(var i=0;i<1000;i+=10){
        stroke(gradient2-i);
        line(x2-i, 300, 400, y2constrain+i);

    }
    x2-=x2Step;
    y2+=y2Step;
}

//slower corner lines
function lines34(){
    //increases i at a faster rate so as to draw less lines
    for(var i=0;i<1000;i+=30){
        stroke(gradient+i*1.2);
        line(x11+i,0,0,y11-i);
        stroke(gradient+i*1.2);
        line(x22-i,300,400,y22+i);
    }
    //changes x11 and y22 values so that it creates a curve
    x11+=x11Step;
    y11-=y11Step;
    x22-=x22Step;
    y22+=y22Step;
}

For this project, I decided that I wanted to play with adding motion into my string art. I started with figuring out the values in order to make the first loop of lines in the top left corner and used my experimentation with that in order to mirror the lines into the bottom right corner.

While I thought that the two looked interesting together, I decided that rather than create two more loops for the other corners, I wanted to create two new series of lines that would start from the same corner but act in a very different way. While playing around with that concept, I came up with the code below.

sketch

//lines1 variables
var x1=0;
var x1Step=0.5;
var y1=300;
var y1Step=1;
var x2=400;
var x2Step=1;
var y2=0;
var y2Step=1;
var gradient=0;

var y3=100;
var y3Step=0.5;
var x3=1000;
var x3Step=1;
var y4=400;
var y4Step=1;
var x4=400;
var x4Step=1;


function setup() {
    createCanvas(400,300);
}

function draw() {
    background(255,200,200);
    lines1();
}

function lines1(){
    if(y1 >0 & y1 < 300){
    for(var i=0;i<1000;i+=20){
        strokeWeight(0.8);
        //gradient black to white lines
        stroke(gradient+i*1.2);
        line(x1+i,0,0,y1-i);
        //teal lines
        stroke(gradient+i*1.2);
        line(x2-i,300,400,y2+i);
    }
}
     for(var i=0;i<1000;i+=60){
        strokeWeight(0.8);
        stroke(0);
        line(0,y3+i,x3-i,0);
        stroke(256);
        line(0,y4-i,x4+i,0);
    }
    x1+=x1Step;
    y1-=y1Step;
    x2-=x2Step;
    y2+=y2Step;
    x3+=x3Step;
    y3-=y3Step;
    x4-=x4Step;
    y4+=y4Step;

}

Although I found that I was able to satisfy the requirements of the project, I decided that I was not satisfied with the inconsistent ways that the lines would move, so I restarted and played around with changing different variables. Through more experimentation, I was able to come up with my final code, which appeared more sophisticated in terms of the spacing of the grid it created as well as the monochrome colors.

ssontag-Project-04

For this project i struggled with creating something visually exceptional because of my limited knowledge of how to use for loops to create interesting visuals. So i added a animation aspect using the position of the mouse to determine the visuals.

sketch


function setup() {
    createCanvas(400, 300);
}

function draw() {
    background(210);
//i used a for loop to iterate the value of i so i could create a
//curve made from lines that have an incremental value based on i
    for (var i = 0; i <= 300; i += 20) {
//using the x value of x i made two sets of lines that are connected at the x value of the mouse
// by making two sets the curves can be moved from the left side to the right side of the canvas
        stroke(0, 128, 128);
        line(i, 0, mouseX, height - i);
        line(i, 300, mouseX, i);

        stroke(0, 0, 128);
        line(width - i, 0, mouseX, height - i);
        line(width - i, 300, mouseX, i);

//using the y value of y i made two sets of lines that are connected at the y value of the mouse
// by making two sets the curves can be moved from the top to the bottom of the canvas
        stroke(128, 128, 0);
        line(0, height - i, width- i, mouseY);
        line(400, height - i, i, mouseY);

        stroke(0, 128, 0);
        line(0, i, width - i, mouseY);
        line(400, i, i, mouseY);
    }
}

Project 4, odh

odhP4

//Owen D Haft
//Section D
//odh@andrew.cmu.edu
//Project 4

var W = 1;  //Value of strokeweight
var B = 150;//Value of B in RGB

function setup() {
    createCanvas(400, 300);
}
 
function draw() {
    background(50, 50, B);
    strokeWeight(W);

    //Sets up the series of lines and how they move with the mouse's location
    for(var i = 0; i < 20; i ++){
        line(mouseX, i*20, 400-i*10, height);
        line(mouseX, i*20, i*10, height);
        line(400, i*20, 100+i*10, mouseY);
        line(0, i*20, 100+i*10, mouseY);
    };

    //Determines the color of the background and 
    // the strokeweight of th lines based on the mouse's location
    if (mouseX > width/2) {
        W = 2;
        B = 255;
    } else {
        W = 1;
        B = 150;
    };
    if (mouseY > height/2) {
        W = 3;
        B = 0;
    } else {
        W = 1;
        B = 150;
    }; 
}

I used some simple loops to have the arrangement of the series of lines be determined by the mouse’s location. Then I practiced more with “if” statements and added some conditionals.

monicah1-project-04

sketch

var x = 100;
var y = 10;

function setup() {
    createCanvas(400, 300);
    strokeWeight(2);
}

function draw() {
	background(0);
	for (var i = 10; i<50; i+=5){
		strokeWeight(1);
		stroke("blue");
		line(mouseX, i*y,i*y, mouseY);
	}
	for (var i = 20; i<70; i+=5){
		strokeWeight(2);
		stroke("yellow");
		line(mouseX, i*y,i*y, mouseY);
	}
	for (var i = 30; i<80; i+=5){
		strokeWeight(3);
		stroke("green");
		line(mouseX, i*y,i*y, mouseY);
	}
	for (var i = 40; i<90; i+=5){
		strokeWeight(3);
		stroke("red");
		line(mouseX, i*y,i*y, mouseY);
	}
	for (var i = 40; i<90; i+=5){
		strokeWeight(3);
		stroke("yellow");
		line(mouseY, i*y,i*y, mouseX);
	}
	for (var i = 30; i<80; i+=5){
		strokeWeight(3);
		stroke("blue");
		line(mouseY, i*y,i*y, mouseX);
	}
	for (var i = 20; i<70; i+=5){
		strokeWeight(2);
		stroke("red");
		line(mouseY, i*y,i*y, mouseX);
	}
}

I played with the angles, colors, and movements.