sketch
//Claire Koh
//Section E
//juyeonk@andrew.cmu.edu
//Project-09


var balls = []; // An array that will store the little balls that make up the portrait


// Loads the image
function preload() {
    var myImageURL = "https://i.imgur.com/AOyeLOo.jpg";
    underlyingImage = loadImage(myImageURL);
}


function setup() {
    createCanvas(480, 480);
    background(0);
    underlyingImage.loadPixels(); // Loads the pixel data of the image
}


// Determines the properties of the balls
function makeballs() {
    var ix = constrain(floor(this.x), 0, width-1);
    var iy = constrain(floor(this.y), 0, height-1);
    var theColorAtLocationXY = underlyingImage.get(this.x, this.y); //gets the color value of the image at (x,y)

    fill(theColorAtLocationXY) // Fills the balls with the color of the image at (x,y)
    noStroke();
    ellipse(this.x, this.y, this.ballsize); // Draws the ellipse at (x,y) with the width and the height dimension of 'ballsize' which is a random number between 2 and 8
}


// Makes the ball move
function ballspeed() {
    this.y += this.dy; // MouseY will be later assigned as 'y'
}


// Sets up the function that returns the properties of the object p, which contains information like the coordinate point of x, y, dy, a function that determines the speed of the ball, a function that creates balls, and the size of the ball
function drawPortrait(placeholderx, placeholdery, placeholderdy) {
    p = {x: placeholderx,
         y: placeholdery,
         dy: placeholderdy,
         speed: ballspeed,
         balls: makeballs,
         ballsize : random(2,8)
        }
    return p;
}


function draw() {
    newBalls = []; // Creates an empty array that will store the values of the newly-created balls
    for (var i = 0; i < balls.length; i++) {
        var p = balls[i];
        p.speed(); //returns the function speed() which makes the balls move
        p.balls(); //returns the function balls() which assigns the balls their properties
        newBalls.push(p);
    }
    balls = newBalls;
}


// When the mouse is moved it replaces the placeholderx placeholdery and placeholderdy values with mouseX, mouseY and random(-20,20) and make the drawPortrait function actually happen and to be stored in the newball array
function mouseMoved() {
        var newball = drawPortrait(mouseX, mouseY, random(-20, 20));
        balls.push(newball);
        x += random(x-3, x+3);
}
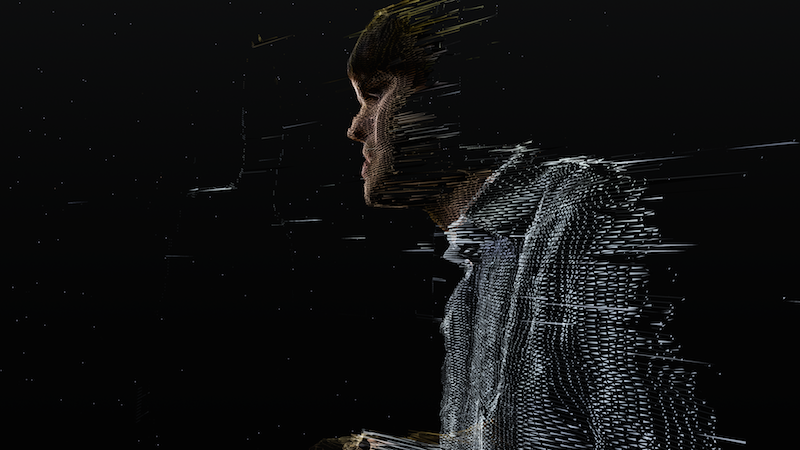
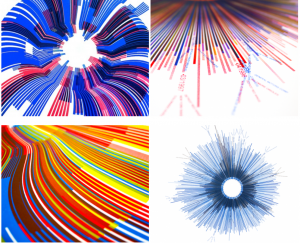
For this project I wanted to make the portrait appear as if it is being drawn by bunch of rain droplets. I tried to take a break from using the function-based operation and and use the object-based operation for once. Overall I think this project was a good opportunity for me to break down how the object-based operation works and to actually learn how to use it.
Initially I tried to make the little rain droplets to drop from the sky and to collect at the bottom without overlapping each other but I legitimately could not figure out how to make that happen so I just made the little droplets to crawl up or down at a constant speed and go beyond the canvas.
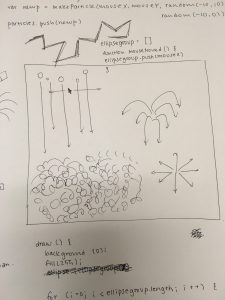
^ Original sketch
^
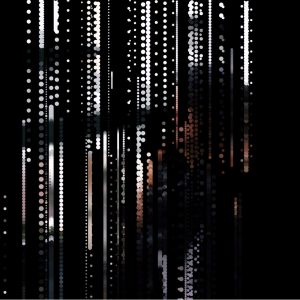
^ While it’s being drawn
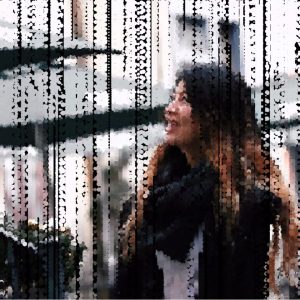
^ Almost done
**Credit to Grace Hou for letting me use her picture!!**
![[OLD FALL 2017] 15-104 • Introduction to Computing for Creative Practice](../../../../wp-content/uploads/2020/08/stop-banner.png)
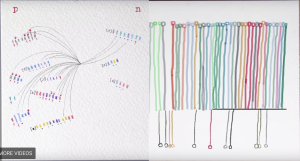
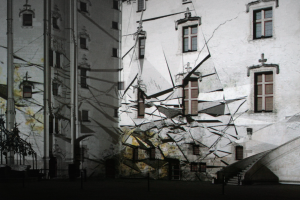
 Marius Watz, “Arcs04-01” and “Arcs-04-01″