Molly Wright Steenson is a designer and architect currently holding the position of the chair of the MDes program at the School of Design at Carnegie Mellon University. Her work in architectural history and designing human systems directly contributes to the ongoing development of Transition Design, a design practice founded in 2013 at Carnegie Mellon that investigates design’s role in making transitions towards preferable, sustainable futures. Specifically, her work focuses on the effects of existing, emerging, and nascent technologies on city systems (and, subsequently, the city in its next larger context — in a region, a region in a country, a country on the globe) as well as one the people that inhabit these cities.
As a designer currently focused on contributing to Transition Design, Molly’s work is influential to my approaches — I see evaluating things in its next larger context as essential in understanding how the designed products, spaces, and messages affect peoples from different breadths of cultures. As a presenter, I see her tactic of making apt references to relatable material as as useful — if the audience can empathize with the content, it makes the content easier to understand.
var nPoints = 100;

function setup() {
    createCanvas(480, 480);
    background(255);
}

function draw() {
  angleMode(DEGREES);
  var r = map(mouseX, 0, width, 0, 360); //rotate using x axis
  var m = map(mouseY, 0, height, 0, 360); //rotate using y axis

  background(255);
  push();
  translate(width/2, height/2); //move Epicycloid to center
  rotate(r);
  rotate(-m);
  drawEpicycloid(); //draws the function below
  pop();

}

function drawEpicycloid() {
  var a = 50; //set sizes of curves
  var b = 50;
  var aa = map(a,0,50,50,mouseX-350);
  var bb = map(b,0,50,50,mouseY-350);

  fill(220,180,165); //add butt color

  beginShape();
  for (var i = 0; i < nPoints; i++) {
    angleMode(RADIANS);
    var t = map(i,0,nPoints,0,TWO_PI); //map the points to a circular area

    x = (aa+bb)*cos(t)-bb*cos((t*(aa+bb))/bb);
    y = (aa+bb)*sin(t)-bb*sin((t*(aa+bb))/bb);
    vertex(x,y);
  endShape(CLOSE);
  }
}
I started with a basic code that let me create the simplest Epicycloid, which is basically in the form of a butt. I, therefore, took that notion and turned the shape’s color to skin tone. However, I added parameters that allowed me to change the rotation and overall shape of the Epicycloid using mouseX and mouseY. All in all, due to the randomness of the mouseX and mouseY alterations, I loved how I could stop anywhere along the square and it would procure a different shape.
This video features two seemingly irrelevant “posters”. One with images of our world, the other with “random” dots. The artist, studio Nand.io, wanted to venture to see what “tomorrow” would look like. In this project titled, Analog Mensch Digital, the poster on the right, with the random dots is the tomorrow. After reading about the project it explains that the random dots are in fact digitally encrypted patterns of the images on the left on the analog poster. The artist wanted to give a new way of looking at the world, the right poster. Basically, the analog poster is only there to give concept and understanding to the digital poster. It would interesting to think about if we in fact needed the digital poster as the reference for the analog.
var nPoints = 100;
function setup() {
    createCanvas(400, 400);
    frameRate(60);
}
function draw() {
    background(0);
    translate(width / 2, height / 2);
    var a = 150; //for function
    var b = 25;
    var h = 25;
    fill(256, 256, 0);
    push();
    beginShape();
    for (var i = 0; i < nPoints; i++) { //draw the curves
        var t = map(i, 0, nPoints, 0, TWO_PI);
        var x = (a - b) * cos(t) + h * cos(t * (a - b) / b); //use these functions
        var y = (a - b) * sin(t) - h * sin(t * (a - b) / b);
        vertex(x + random(-1, 1), y + random(-1, 1)); //wiggle
        if (mouseX > width / 2 & mouseY > height / 2) { //2nd quadrant
          fill(256, 0, 256)
          b = 50;
          h = 50;
        }
        if (mouseX < width / 2 & mouseY < height / 2) { //3rd quadrant
          fill(256)
          b = 10;
          h = 10;
        }
        if (mouseX > width / 2 & mouseY < height / 2) { //4th quadrant
          fill(0, 256, 256)
          b = 15;
          h = 15;
        }
    }
    endShape(CLOSE);
    pop();
}
var points = 5100;
var depth = 10;

function setup() {
  createCanvas(400, 400);
}

function draw() {
	background(0);

    translate(width /2, height/2);
    rotate(mouseX/2);
    drawParabolaCurve();
    drawHypotrocloid();
}

function drawParabolaCurve() {
    strokeWeight(0.1);
    stroke(104,259,242);
    noFill()
    var Z = 6000;

    beginShape();
    for (var i = 0; i < points; i++) {

        var t = map(i, 10, points, 10, HALF_PI);
        var x = Z * pow(t,depth) / Z;
        var y = 2 * Z * t;

        vertex(x, y);
    }
    endShape();

}

function drawHypotrocloid() {
    var e = 100;
    var f = map(mouseX, 0, width, 0, 300);
    var g = e/map(mouseY, 0, height, 0, 300);


    beginShape();
        for (var i = 0; i < points; i++) {

            var angle = map(i, 0, points, 0, HALF_PI);
            var j = (e - f) * cos(angle) + f * cos (((e - g)/g)*angle);
            var k = (e - f) * sin(angle) - f * sin (((e - g)/g)*angle);

            vertex(j, k);
        }
    endShape();
}
I usedParabolaCurve and Hypotrocloid in one visual, playing with stroke weight and dynamic behaviors. I like the mysterious, delicate, and sensual visual qualities.
//Hannah Kim
//Section A
//hannahk2@andrew.cmu.edu
//Project-07

var nPoints = 100;
var EPITROCHOID = 0; // Cartesian Parametric Form  [x=f(t), y=g(t)]
var CRANIOID = 1; // Polar explicit form   [r =f(t)]
var curveMode = EPITROCHOID;

var numObjects = 10;
var centerX;
var centerY;
var angle = 0;
var distance = 100;

function setup() {
// creates canvas
createCanvas(500, 500);
centerX = width/2;
centerY = height/2;
noStroke();
ellipseMode(CENTER);
}

function draw() {
background(0, 0, 0, 20);
// draw the frame
fill(0);
stroke(255, 0, 0, 40);
noFill();
rect(0, 0, width-1, height-1);

// draw the curve and rotate at different angles
push();
translate(width / 2, height / 2);
drawecurve();
rotate(PI/3.0);
drawecurve();
rotate(2*PI /3.0);
drawecurve();
pop();

//function to draw the curve
function drawecurve() {
    var x;
    var y;

    var a = 70.0;
    var b = a / 2.0;
    var h = constrain(mouseY / 20.0, 0, b);
    var ph = mouseX / 80.0;

    beginShape();
    for (var i = 0; i < nPoints; i++) {
        var t = map(i, 0, nPoints, 0, TWO_PI);

        x = (a + b) * cos(t) - h * cos(ph + t * (a + b) / b);
        y = (a + b) * sin(t) - h * sin(ph + t * (a + b) / b);
        vertex(x, y);
    }
    endShape(CLOSE);
}

var angleObject = 360/numObjects;
	//creates for loop which creates ellipses
	for (var i=0;i<numObjects ;i++) {
	angle = frameCount;
	//makes the distance between the ellipses change according to mouseX
	distance = sin(radians(mouseX))*150;
	var posX = centerX + distance *cos( radians(angleObject*i + angle) );
	var posY = centerY + distance *sin( radians(angleObject*i + angle) );
		//creates different curves and lines
		//makes one curve grow in width depending on mouseY
		//changes size of curves based on var posX and posY
		fill(255, 0, 0, 0);
		ellipse(posX, posY, 10, 10);
		stroke(255, 0, 0, 40);
		strokeWeight(1);
		line(centerX, centerY, posX, posY);
		line(centerX, centerY, posX-100, posY-100);
		line(centerX, centerY, posX+100, posY+100);
	 	//ellipse(posX, posY, mouseY, 100);
		ellipse(posX, posY, 200, 200);
	}
}
I really enjoyed making this project and playing with the different parameters of the curves. I tried to make something resembling a rotating planet/orb.
function setup() {
    createCanvas(480, 480);
    frameRate(10);
}

function draw() {
    background("#9CE2F7");
    fill(255, 255, 255, 64);
    translate(width/2, height/2); //moves lines to center of the canvas


    // draw the circle as a starburst
    push();
    for (var i = 0; i < 20 ; i++) {
        var theta = map(i, 0, 20, 0, TWO_PI);
        var px = 50 * cos(theta);
        var py = 50 * sin(theta);
        line(0, 0, px, py);
    }
    pop();
}
//Isadora Krsek
//Ikrsek@andrew.cmu.edu
//Section C
//Project 07: Curves

var x;
var y;
var z;

function setup() {
    createCanvas(400, 400);
    noStroke();
}

function draw() {
    background(0);
    //adjusting placement & size of curves
    translate(width/2, height/2);
    scale(150)
    limit = (map(mouseX, 0, width, 2, 8)); //caps the # of loops
    limit2 = (map(mouseY,0,height,20, 80)) //caps the # of loops
    push();
    scale(3,3)
    rotate(radians(90));
    push();
    rotate(mouseY,0,height,0,360)
    drawLoxoB();
    pop();
    drawLoxo();
    pop();
}


function drawLoxo() {
  //a controls how many strokes there are in terms of representing the loxodrome
    for (var a=.4; a<limit; a+=.2) {
    //color change mapped to a
      var rValue = (map(a, 0.4, 4, 0, 360))
      fill(rValue);
      beginShape(QUADS);
      for (var t = -20; t <limit2; t+=.1) {
        x = ((cos(t))/(sqrt(1+pow(a,2)*pow(t,2))));
        y = ((sin(t))/(sqrt(1+pow(a,2)*pow(t,2))));
        vertex(x, y);
      }
      endShape();
    }
}

function drawLoxoB() {
  for (var a=.4; a<limit; a+=.2) {
    var rValue = (map(a, 4, 0.4, 0, 360))
    fill(rValue);
    beginShape(QUAD_STRIP);
    for (var t = -20; t <limit2; t+=.1) {
      x = ((cos(t))/(sqrt(1+pow(a,2)*pow(t,2))));
      y = ((sin(t))/(sqrt(1+pow(a,2)*pow(t,2))));
      vertex(x, y);
    }
    endShape();
  }
}
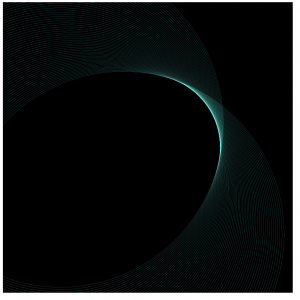
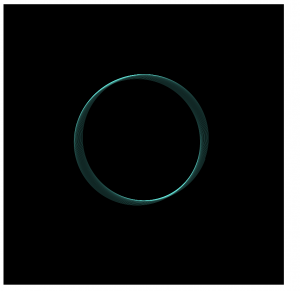
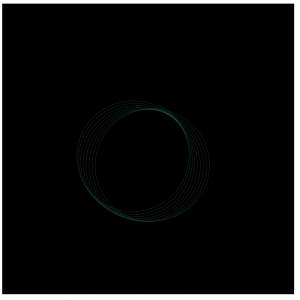
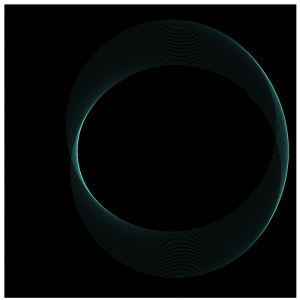
I was looking at a few different curves but was most inspired by the loxodrome which I decided to try to replicate 2-dimensionally.
I wanted to create something a little haunting, but still somewhat visually exciting in the spirit of October, and as a result this is what I came up with. It brings to mind for me, the headlight of a train as it’s running towards you inside of a tunnel.
//Clair(sijing) Sun
//session C
//sijings@andrew.cmu.edu
//Assignment-06-compositionwithCurve

var t=0;
var r=60;
var curveP1;
var curveP2;
var color1=141;
var color2=141;

function setup() {
  createCanvas(480, 480);
}

function draw() {
  var t=map(mouseY, 0, height/4, height/2, height/4);//constrain it between hieght/2 and height/3
  background(156,170,164);
  noStroke();
  var limit;//curve for determining how many times we want to rotate
  if (mouseX<width/2){
    limit=map(mouseX,0,width/2,0,16);
  }else{
    limit=map(mouseX, width/2, width,16,0);
  }
  for (var num=0;num<limit;num++){//set limit as our limit for iteration
    //leafs
    angleMode();
    fill(200,195,167);
    arc(50, 50, 140, 140, 180, 270,CHORD);//all used chord becuase we need to create
    arc(50, 80, 140, 140, 200, 270,CHORD);//a effect of leaves
    arc(width-50, height-50, 140, 140, 180, 270,CHORD);
    arc(width-50, height-80, 140, 140, 200, 270,CHORD);
    fill(104,103,78);
    arc(50, 70, 160, 140, 30, 0,CHORD);
    arc(60, -90, 260, 240, 190,40, CHORD);
    arc(width-50, height-30, 160, 140, 30, 0,CHORD);
    arc(width-50, height-90, 260, 240, 190,40, CHORD);
    fill(203,169,111,70);
    arc(30, -40, 260, 240, 190,40, CHORD);
    arc(20, 70, 140, 140, 180, 270,CHORD);
    arc(55, 115, 140, 140, 200, 270,CHORD);
    arc(width-150, height-90, 260, 240, 190,40, CHORD);
    arc(width-20, height-70, 140, 140, 180, 270,CHORD);
    arc(width-55, height-115, 140, 140, 200, 270,CHORD);
    fill(212,202,144);
    arc(50, 120, 240, 240, 200, 270,CHORD);
    arc(width-115, height-120, 240, 240, 200, 270,CHORD);
    fill(104,103,78,100);
    arc(-20, 90, 160, 140, 30, 0,CHORD);
    arc(20, -90, 260, 240, 190,40, CHORD);
    arc(width-80, height-90, 160, 140, 30, 0,CHORD);
    arc(width-80, height-90, 260, 240, 190,40, CHORD);

  //inner loop for drawing the actual curve
    for (var i=0;i<670;i++){
      r=mouseX/5;//set the radius to continue change
      if (num%4==0){//set different conditions for determing which direction we want
        var x=r*cos(t)*(1+cos(t));
        var y=r*sin(t)*(1+cos(t));
      }
      if (num%4==1){
        var x=r*cos(t)*(1-cos(t));
        var y=r*sin(t)*(1-cos(t));
      }
      if (num%4==2){
        var x=r*sin(t)*(1+cos(t));
        var y=r*cos(t)*(1+cos(t));
      }
      if (num%4==3){
        var x=r*sin(t)*(1-cos(t));
        var y=r*cos(t)*(1-cos(t));
      }
      t+=0.97;
      curveP1=width/2+num*2+x-12;//circles position x
      curveP2=height/2+num+y;//circles position y
      if (mouseX<width/2){
        var color1=map(mouseX, 0, width/2, 200, 74);//set conditions for changing color
        var color2=map(mouseX, 0, width/2, 121, 36);
      }else{
        var color1=map(mouseX, width/2, width, 80,200);
        var color2=map(mouseX, width/2, width, 35,121);
      }

      rotate(PI/5.0);//for rotating shape
      fill(255,color1,color2,255-mouseX/3);
      var size=map(mouseX,width/2,width,2,10);//also constrain size
      ellipse(curveP1,curveP2,size,size);
    }

  }


}
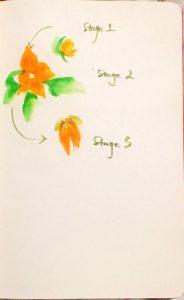
sketch before starting the project
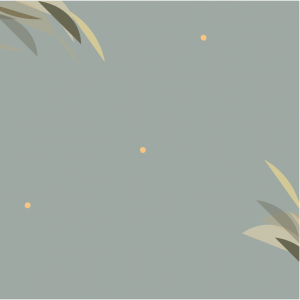
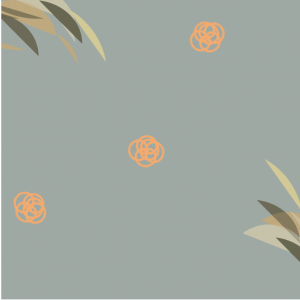
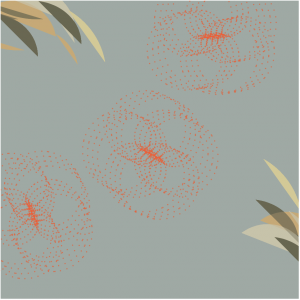
For this project, I wanted to express the idea a flower is blooming and then dying based on our mouse movement from left of the canvas to the right. So we can see there are changes of the number of petals (increase when mouseX approaching to the center of the canvas) and decreases when mouseX leaving the center of the canvas and going to the edge. With this movement, there are also changes in color, opacity, size, and the position of each dots. The audience can play this interactive work by rotating the flower and seeing how they can transform a flower from born to death. There are also some leaves being created for decoration. Here are some screenshots of the different states of the flower.
when the flower first appear, color-light orangeWhen flowers get bigger and curves appear, color becomes darker orangewhen flower bloom and become orange red
The final state of the curves, which will be reduced to fewer curves
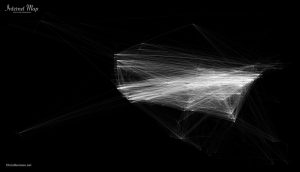
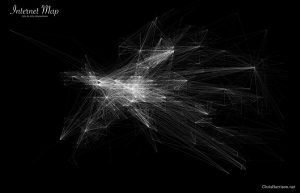
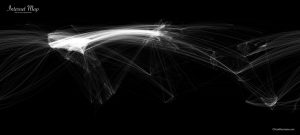
Chris Harrison did a really cool project on internet maps, where he compared internet connectivity of the world, and focused in on North America and Europe especially, as they had the most connections between each other.
Logistically, he mapped out the locations of connectivity by nearest whole number in a coordinate system. The brighter the point, the more points of connectivity there is. Harrison himself says that this approach probably is not indicative of users, as one point of connectivity can have multiple users. However, he chose the data and representation style based on an aesthetic approach, as there are already many other practically modeled ones existing. You can read more about it here.
Internet connectivity of Europe
Internet connectivity of North America
Internet connectivity of the World
I love how delicate the lines are and how orderly the grids look, zoomed in. Because Harrison rounded connectivity locations to nearest longitude and latitude, it looks like it follows a coordinate grid system. The contrast between order and chaos gives the appearance of string art.
![[OLD FALL 2017] 15-104 • Introduction to Computing for Creative Practice](../../../../wp-content/uploads/2020/08/stop-banner.png)