heeseoc-Project-07-Curves

sketch

//Steph Chun
//15-104 section #A
//heeseoc@andrew.cmu.edu
//Project-07

var a = 30;
var b = 10;
var t = 500;
var h = 80;

function setup() {
    createCanvas(400, 400);
    frameRate(10);
}

function draw() {
	background(0);
	stroke(255);

	push();
	translate(width/2, height/2);
	beginShape();

	//lines//
	for (var i = 0; i < 50; i++) {
		var Xcoord = ((a-b)*cos(i))+(h*cos(((a-b)/b)*i));
		var Ycoord = ((a-b)*sin(i))+(h*sin(((a-b)/b)*i));
		var Xcoord2 = ((a-b)*cos(i-t))+(h*cos(((a-b)/b)*(i-t)));
		var Ycoord2 = ((a-b)*sin(i-t))+(h*sin(((a-b)/b)*(i-t)));
		b = mouseX + 650;
		line(Xcoord + random(-3, 3), Ycoord+ random(-3, 3), Xcoord2+ random(-3, 3), Ycoord2+ random(-3, 3));
    	
    	//bubbles//
		push();
		rotate(i);
    	ellipse (i + random(-3, 3), Ycoord, 2, 2);
    	ellipse (i + random(-3, 3), Ycoord2, 4, 4);
    	ellipse (Xcoord, i + random(-3, 3), 2, 2);
    	ellipse (Xcoord2, i + random(-3, 3), 4, 4);
    	pop();
    }
    endShape(CLOSE);
    pop();
    
    //bigger circle//
    push();
    translate(width/2, height/2);
    beginShape();
    for (var i = 0; i < 20; i++) {
    	fill(255, 50);
        var theta = map(i, 0, 20, 0, TWO_PI);
        var x = mouseX * 0.25 + 60;
        var px = x * cos(theta);
        var py = x * sin(theta);
        vertex(px + random(-3, 3), py + random(-3, 3));
    }
    endShape(CLOSE);
    pop();

    //smaller circle//
    push();
    translate(width/2, height/2);
    beginShape();
    for (var i = 0; i < 20; i++) {
    	fill(0);
        var theta = map(i, 0, 20, 0, TWO_PI);
        var x = mouseX * 0.25 + 20;
        var px = x * cos(theta);
        var py = x * sin(theta);
        vertex(px + random(-3, 3), py + random(-3, 3));
    }
    endShape(CLOSE);
    pop();

}

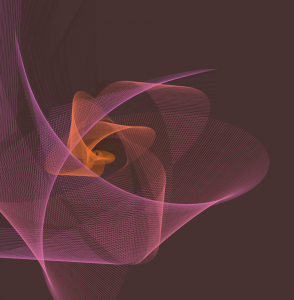
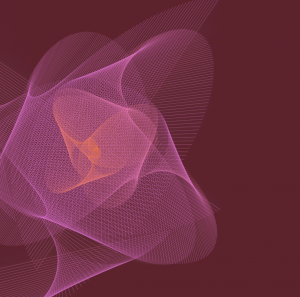
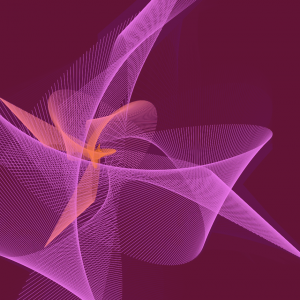
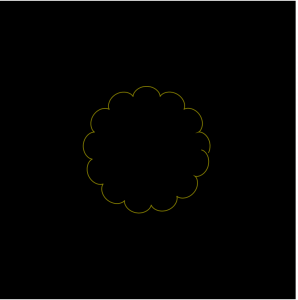
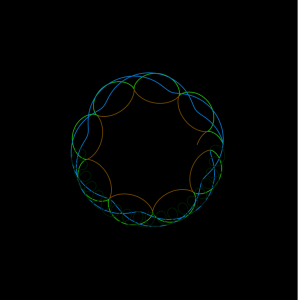
For this project, I started off with browsing mathworld website and finding the curve that we would want to use. I chose hypotrochoid. Then, I tried to generate that curve through coding, and what I found out was at some point, the lines that I made through the equation I chose made an eye-shaped form at some point, so I restricted the mouse movement to have it start from the shape and added wiggly circles in the middle of those lines. I added the wiggly bubbles in the back because it felt like it needed some more elements to it to have some sort of a visual balance. I kept all the colors white, because I did not want it to be way to literal in communicating my “zooming into an eye” idea. Below is the screenshot of the shape I got inspired from.

hdw – Project 7 – Curves

sketch

//Helen Wu
//Section A
//hdw@andrew.cmu.edu
//Project 7

function setup() {
    createCanvas(480,480);
    background(255, 71, 123)
}


function draw() {
  push();

  //this is to call the centers of which the sextic functions will be called from
  translate(width/2, height/2);
  beginShape();
  for(var i = 0; i < 25; i++){
    //25 sets the direction of which the curves draw
      var t = map(i,0,100,0,360);
      //t = angle
      var a = map(mouseY, 0, 480, -5, 5);
      //a = control the curvature of the loops
      var x = 4*a*(Math.pow(cos((1/3)*t),3))*cos(t);
      var y = 4*a*(Math.pow(cos((1/3)*t),3))*sin(t);
      //centerX and centerY = center of smaller curves
      var centerX = 10*x
      var centerY = 10*y
  }
  endShape(CLOSE);
  pop();


//drawing below sextics on points along above sextic
  cayleysSextic(centerX, centerY);
  }

function cayleysSextic(centerX,centerY) {
  push();
  //placement of sextics along center
  translate(width/2+centerX,height/2+centerY);
  beginShape();
  for(var i = 0; i < 50; i++){
      //t = angle
      var t = map(i,0,100,0,360);
      //a = control the curvature of the loops
      var a = map(mouseX, 0, 400, -10,10);
      var x = 4*a*(Math.pow(cos((1/3)*t),3))*cos(t);
      var y = 4*a*(Math.pow(cos((1/3)*t),3))*sin(t);
      //center of smaller loop's smaller curves
      noStroke()
      fill(255,255,255,30);
      ellipse(x*3,y*3,1,1);
      //drawing ellipses along the curve
  }
  endShape(CLOSE);
  pop();
}

This project was based on Cayley’s Sextic, which coincidentally looks like a butt. 👀👀

I mapped Cayley’s Sextic along another Cayley’s Sextic, just to see how it would look. I kind of like how cute the final product turned out to be. The centers of one are along the next, both mapped to the mouse position on the canvas.

JDBROWN – Project 7 – C U R V E S

Curve

// Joshua Brown
// Jdbrown@andrew.cmu.edu
// Project 7: Curves
// Section C

function setup () {
    createCanvas (480, 480);
    background (0);
}

function mousePressed () {
    background (0);
}


function draw () {

    stroke (255);
    strokeWeight (2.5);

    // defining variables for drawing line-heavy shapes;
    // linking x variables with the mouseX parameter;

    var x1 = mouseX;
    var y1 = 40;
    var x2 = mouseX;
    var y2 = 440;
    var xMid = width / 2;
    var yMid = height / 2;

    // drawing the spikey, Masonic symbol thing;

    stroke (mouseX / 2 + 20, mouseX / 2, mouseY / 3);
    line (x1, yMid, x2, yMid);
    line (xMid, yMid / 4 - 30, xMid, yMid - 40);
    line (xMid, yMid - 40, xMid - 180, yMid + 180);
    line (xMid, yMid - 40, xMid + 180, yMid + 180);
    line (xMid, yMid - 210, xMid + 180, yMid + 180);
    line (xMid, yMid - 210, xMid - 180, yMid + 180);
    line (x1, yMid, xMid, yMid - 150);
    line (x2, yMid, xMid, yMid - 150);
    line (x1, yMid, xMid, yMid - 80);
    line (-x2 + 480, yMid, xMid, yMid - 80);

    // drawing the inverse (upside-down version);

    stroke (mouseY / 2, 0, mouseX / 3);
    line (x1, yMid, x2, yMid);
    line (xMid, yMid / 4 - 30, xMid, yMid + 40);
    line (xMid, yMid + 40, xMid + 180, yMid - 180);
    line (xMid, yMid + 40, xMid - 180, yMid - 180);
    line (xMid, yMid + 210, xMid - 180, yMid - 180);
    line (xMid, yMid + 210, xMid + 180, yMid - 180);
    line (-x1 + 480, yMid, xMid, yMid + 150);
    line (-x2 + 480, yMid, xMid, yMid + 150);
    line (-x1 + 480, yMid, xMid, yMid + 80);
    line (x2, yMid, xMid, yMid + 80);
    fill (255);

    ellipse (width/2, height/2, 30, 30);

    // drawing the circles which comprise the central diamond shape;

    push();

    translate (width/2, height/2);
    rotate (radians (mouseX));

    fill (255, 25);
    ellipse (-240, -240, 600, 600);
    ellipse (-240, height - 240, 600, -600);
    ellipse (width - 240, -240, 600, 600);
    ellipse (width - 240, height - 240, 600, 600);

    pop ();

    // drawing circles on the fringes, to increase dimensionality;

    push ();

    translate (width/2, height/2);
    rotate (radians (mouseY));

    fill (0, 25);
    ellipse (-240, -240, 300, 300);
    ellipse (-240, height - 240, 300, -300);
    ellipse (width - 240, -240, 300, 300);
    ellipse (width - 240, height - 240, 300, 300);

    pop ();

    // drawing smaller fringe circles to increase trippiness;

    push ();

    translate (width/2, height/2);
    rotate (radians (mouseX));

    fill (0, 25);
    ellipse (-240, -240, 150, 150);
    ellipse (-240, height - 240, 150, -150);
    ellipse (width - 240, -240, 150, 150);
    ellipse (width - 240, height - 240, 150, 150);

    pop ();

    // small white circles! Why not!

    push ();

    translate (width/2, height/2);
    rotate (radians (mouseX));

    fill (255);
    ellipse (-240, -240, 80, 80);
    ellipse (-240, height - 240, 80, -80);
    ellipse (width - 240, -240, 80, 80);
    ellipse (width - 240, height - 240, 80, 80);

    pop ();

}


I was interested in the petal-ish curve shapes, since I didn’t quite understand how to translate a lot of the more complicated algebraic maths into code.

ssharada-project-07-composition-with-curves

project04.js


function setup() {
    createCanvas(480, 480);
    angleMode(DEGREES);
    frameRate(50); //delayed feedback so lines appear to draw themselves and disappear
}

function draw() {

//making the colour of the background dependent on the cursor position
    background(mouseX/7.55, mouseY/20, mouseX/15, mouseY/20); 
    //the trasnparency of the backgroud is also dependent on the cursor position

//changing the position of the start point of the curves. 
    translate (width/3,height/2);
    noFill();

//creating the for loop variables for which the angles will change
    for (var i = 0; i < 361; i++){

        //maping the angles so they only go between 0 and 360 
        var t = map(i, 0, 360, 1, 500); 
        
        //making the colours only range 0 and 255 no matter cursor position
        var r = map(mouseX, 0, 1000, 250, 255); 
        var g = map(mouseX, 0, 1000, 120, 130);
        var b = map(mouseX, 0, 1000, 70, 80);

        //making the variables for the points' scaling
        var scale1 = 0.0005;  
        var scale2 = 0.5;
        var scale3 = 0.001;
        var scale4 = 0.4;

        //creating the curves of the graphs that the for loop is going to be used with
        var x1 = -sin(t)+cos(t);
        var y1 = cos(t);
        var x2 = cos(t) + 0.5;
        var y2 = sin(t);

        //creating the stroke colour and varying it according to the cursor position and the for loop
        stroke(r, g, t*(mouseX/800));
        strokeWeight(random(0.01, 0.05));

        line(x1*t*mouseX*scale1, y1*t*scale2, x2*t*scale2, y2*t*mouseY*scale1);
        line(x1*t*scale4, y2*t*mouseX*scale3, x2*t*mouseY*scale1, y2*t*scale4);

        push();
        //rotating the same two curves to create the rose like shape.
        rotate(90);
        
        line(x1*t*mouseX*scale1, y1*t*scale2, x2*t*scale2, y2*t*mouseY*scale1);
        line(x1*t*scale4, y2*t*mouseX*scale3, x2*t*mouseY*scale1, y2*t*scale4);
        
        pop();

    }
    
}


For this assignment I was inspired by a rose bud blooming and I was trying to figure out how to find an abstract way to represent it. I did this by changing the colours and have a frame rate that was slow enough for the lines to look like they were emerging from each other.

I experimented with cosine and sine curves and looked at what would happen if i multiplied, subtracted, added, and divided them from each other. I ended up with the above version because i felt that it represented the idea of the flower blooming the best.

nahyunk1 -Project 07 – curves

sketch

//NaHyunKim
//section B
//nahyunk1@andrew.cmu.edu
//Project 07

var numObjects = 500;
var r = 255;
var g = 255;
var b = 255;

function setup() {
createCanvas(380, 380);
ellipseMode(CENTER);
}

function draw() {
var centerX = width/2;
var centerY = height/2;
background(0);
translate(centerX, centerY);
//draw Epicycloid
drawEpi(); //

function drawEpi() {
  noFill();
  stroke(random(0,r), random(0,g), random(0,b)); // stroke is all random colors

  beginShape();
  var x;
  var y;
  var a = mouseY/3; //the increase and the decrease of lines/curves.
  var b = -mouseX/40;//the increase and the decrease of lines/curves.
  for (var i=0; i < numObjects; i++){
    var t = map(i, 0, numObjects, 0, TWO_PI);
    var x = ((a+b)*cos(t) - b*cos(((a+b)/b*t))); // x eq. for the epicycloid
    var y = ((a+b)*sin(t) - b*sin(((a+b)/b*t))); // y eq. for the epicycloid
    vertex(x,y); // starts at the vertex.
  }
  endShape();
}
  beginShape();
  var x;
  var y;
  var a = mouseY/3;//the increase and the decrease of lines/curves.
  var b = mouseX/40;//the increase and the decrease of lines/curves.
  stroke(random(0,g), random(0,r), random(0,b)); //switch up the variables so that each epi. has different types of randomness.
  for (var i=0; i < numObjects; i++){
    var t = map(i, 0, numObjects, 0, TWO_PI);
    var x = ((a+b)*cos(t) - b*cos(((a+b)/b*t))); // x eq. for the epicycloid
    var y = ((a+b)*sin(t) - b*sin(((a+b)/b*t)));// y eq. for the epicycloid
    vertex(x,y);
  }
  endShape();
  beginShape();
  var x;
  var y;
  var a = mouseY/3;//the increase and the decrease of lines/curves.
  var b = mouseX/40;//the increase and the decrease of lines/curves.
  stroke(random(0,b), random(0,g), random(0,r));//switch up the variables so that each epi. has different types of randomness.
  for (var i=0; i < numObjects; i++){
    var t = map(i, 0, numObjects, 0, TWO_PI);
    var x = ((a+b)*cos(t*2) - b*cos(((a+b)/b*t))); // x eq. for the epicycloid
    var y = ((a+b)*sin(t*2) - b*sin(((a+b)/b*t)));// y eq. for the epicycloid
    vertex(x,y);
  }
  endShape();
  beginShape();
  var x;
  var y;
  var a = mouseY/3;//the increase and the decrease of lines/curves.
  var b = mouseX/40;//the increase and the decrease of lines/curves.
  stroke(random(0,b), random(0,g), random(0,r));//switch up the variables so that each epi. has different types of randomness.
  for (var i=0; i < numObjects; i++){
    var t = map(i, 0, numObjects, 0, TWO_PI);
    var x = ((a+b)*cos(t/2) - b*cos(((a+b)/(b/2)*t))); // x eq. for the epicycloid
    var y = ((a+b)*sin(t/2) - b*sin(((a+b)/(b/2)*t)));// y eq. for the epicycloid
    vertex(x,y);
  }
  endShape();
}

I first played around with the epicycloid itself to see how it gets formed as I move around the mouse. Then, I tried adding more layers of the same epicycloid and change around the equation to see changes occur in the image. I worked with division and multiplication of the variable ‘t’ in order to create shapes that differ from the original epicycloid made with the initial equation. Here are the screenshots of the initial, single epicycloid and my progressional adaptation of the shape through adding the altered versions of the original.

Looking outwards-07

Data visualization is an important part of understanding complex systems because it allows for an intuitive understanding of complex systems. Data is not the answer to problems, but pulling a well informed understanding from data can help experts decide the state and needs of the system. The Tweet Bursts project from Senseable City @mit used public tweets to understand events. Data is valuable because it’s inherently crowdsourced. As natural language processing develops, computational understanding of events can be understood and communicated in realtime. Realtime access to events around the world can help leaders (hopefully) make good decisions.

http://senseable.mit.edu/tweetbursts/

Sheenu-Project-07-Composition with Curves

sketch

//Sheenu You
//Section E
//sheenuy@andrew.cmu.edu
//Project 07
var nPoints = 100;
function setup() {
    createCanvas(480, 480);
    background(0);

}
function draw(){
	background(218,205,188)
	drawLoopFlower();

}

function drawLoopFlower() { 
	//SHIFTS SHAPE INTO CENTER OF CANVAS
	translate(240,240);
	//MULTIPLIES SHAPE
	//MATH VARIABLES
	for (var o=0; o<80; o++){
	var x;
	var y;
	var a=o*.5+mouseX/5
	var b=mouseX/30;

	stroke(56+o*1,82-o*1,139-o*1);

	noFill();
	
	//STARTS SHAPE
	beginShape();
	
	//MATHEMATICAL EQUATION FOR EPIcyCLOID 
	//x=(a+b)cos(theta)-bcos((a+b)/b*theta)
	//y=(a+b)sin(theta)-bsin((a+b)/b*theta)
	//ellipse(240,240,a,a)
	
	for (var i =0; i<nPoints; i++){
		var t = map(i,0,nPoints,0, TWO_PI);
		x=(a+b)*cos(t)-b*cos(((a+b)/b)*t+80)
		y=(a+b)*sin(t)-b*sin(((a+b)/b)*t+80)
		//x=o*a*((b-1)*cos(t)+cos((b-1)*t))/b
		//y=o*a*((b-1)*sin(t)-sin((b-1)*t))/b
		vertex(x,y);
	}
	//END SHAPE
	endShape(CLOSE);
}

}

Many curve compositions posted on site inspired me to make this curve. I used a for loop to multiply the number of curves so it can create a much more visually appealing and interesting picture. I also found a color palette I liked and used it in this image. I transformed the common Hypotrochoid curve in the example into a beautiful and much more interesting shape.

monicah1-lookingoutward-07

The Rhythm of Food by Moritz Stefaner

This project Mortiz Stefaner works on relating specific food and time of the year. For example, he looked at the human purchase behavior on apricot; The population of purchasing apricot, the amount they buy, and when they buy.

I am interested in this data visualization because I never seen data viz on specific food. When I really look into the visualization. The visual tells me so many information, like stories, seasons, demographic and more. When looking at data viz on strawberry, it interesting to see the anecdote on how strawberries relates to valentines. It would be interesting to see if people are keeping up with the tradition on certain holidays by looking at people behaviors when purchase food. Also, the data viz can clearly support people supply and demand needs.


dayoungl Project -07

sketch

//Sharon Lee
//Section E
//dayoungl@andrew.cmu.edu
//Assignment 07-C
var h = 280;
var v = 5;
var dirX = 1;
var wall1 = 60;
var wall2 = 340;
var xarray = [];
var yarray = [];
var rings = 10;
var counts = [];
var circles = [];

var xs = []
var ys = []
var is = []

function setup() {
  createCanvas(400,400);
  // angleMODE(DEGREES);
  frameRate(8);
}

function draw() {
  ripples();
  for(i = 0; i< counts.length;i++){
    counts[i]++;
  }
  if(counts[0]>rings){
    counts.splice(0,1);
    xarray.splice(0,1);
    yarray.splice(0,1);
  }
 
}

function ripples() {
  background(100);
  //rectangle
  push();
  rectMode(CENTER);
  stroke(122,203,241);
  strokeWeight(4);
  noFill();
  rect(width/2, height/2,h,h);
  //set the number of the ripples
  for (i = 0; i < xarray.length; i ++){
    
    //draw ripples
    stroke(122,203,241);
    noFill();
    // var m = map(mouseX, 0, width, 25, 75);
    //constrain the ripples inside the square
    var xc = constrain(xarray[i], wall1, wall2);
    var yc = constrain(yarray[i], wall1, wall2);
    xs.push(xc);
    ys.push(yc);
    is.push(counts[i]);
    //ellipse(xc,yc,50 * counts[i], 50 * counts[i]);
  }

  for (i = 0; i < xs.length; i++) {
    ellipse(xs[i],ys[i],50 * is[i], 50 * is[i]);
  }

  pop();
  fill(100);
  noStroke();
  rect(0,0,wall1,height);
  //create bounding box
  //right bouding box
  rect(wall2,0,wall1,height);
  //left bounding box
  rect(height,0,width,wall1);
   //top bounding box
  rect(0,0,width,wall1);
  //bottom bounding box
  rect(0,wall2,width,wall1);
}

function mousePressed() { 
  counts.push(0);
  xarray.push(mouseX);
  yarray.push(mouseY);
}

// function mouseDragged() {
//   ripples (mouseX, mouseY);
// }

I wanted to represent ripples. As mouse is clicked, the ripples appear on the screen and overlap on top of each other.

selinal-Looking-Outwards-07

Personal Knowledge Database by Moebio Labs (Santiago Ortiz)

http://intuitionanalytics.com/other/knowledgeDatabase/

Moebio Labs is a collaborative team of engineers, analysts, programmers, etc. which has swept through and encountered millions of pages on the internet. While they make most of their data visualizations about a specific topic or theme, their project Personal Knowledge Database acts as an archive for the research they have done throughout the ten years since they started making data visualizations. I admire how they use of old, “unseen” material and incorporate it as a main thematic element in another one of their projects. I think there is a significance in the metaphorical translation of the project’s concept to a visual, and the interactive and technical aspects are extremely impressive. One observation I have of the algorithm used is the separation of certain links/projects into nodes within other nodes, perhaps to indicate time period and area of research.

Image result for personal knowledge database santiagoImage result for personal knowledge database santiago