![[OLD FALL 2017] 15-104 • Introduction to Computing for Creative Practice](../../../../wp-content/uploads/2020/08/stop-banner.png)
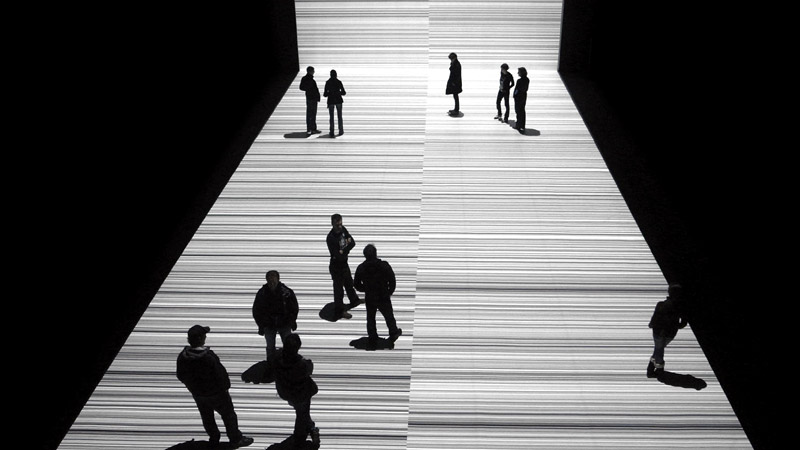
I appreciate this project because of it’s use of natural aspects in a computer aided art installation. This project uses light sensors to influence the ambient noise played through the speakers. Depending on the light levels collected from the sensors it creates a complex soundscape. This is something that is inspiring to me because it is an example of using contextual elements to influence the environment people experience. I could see this becoming something more interactive using other sensors that are based on the people and the noises already within the room. I could see this becoming a very uncomfortable room that changes as people move through it.
Month: September 2017
haewanp – Project 04 – String Art
//Hae Wan Park
//15104-A
//haewanp@andrew.cmu.edu
//Project-04-StringArt

//radius of imaginary circle that its boundary contains X, Y coordinate of beginning or ending point of lines
//radius of some ellipses
var r1 = 110;
var r2 = 90;
var r3 = 55;
var r4 = 40;

//X, Y coordinate of beginning or ending point of lines
var x1;
var y1;
var x2;
var y2;
var x3;
var y3;

function setup() {
    createCanvas(400, 300);
}

function draw() {
    background(255);
    translate(width/2, height/2);

    //circle yellow 1
    noStroke();
    fill(255, 220, 100);
    ellipse(0, 0, 2*r1, 2*r1);
    //circle yellow 2
    fill(255, 240, 100);
    ellipse(0, 0, 210 + r4/3, 210 + r4/3);
    //circle green
    fill(211, 229, 212);
    ellipse(0, 0, 180, 180);
    //circle blue
    fill(0, 50, 130);
    ellipse(0, 0, r4*2, r4*2);

    angleMode(DEGREES);
    strokeWeight(1);

    //along the boundary of imaginary circle, lines are created in each 5 degree
    for (var a = 0; a < 360; a = a + 5) {
        x1 = cos(a) * r1;
        y1 = sin(a) * r1;
        x3 = cos(a) * r3;
        y3 = sin(a) * r3;

        stroke(242, 109, 98);
        line(x1, y1, -cos(a - 110) * r1, -sin(a - 110) * r1);
        line(x3, y3, -cos(a - 90) * r4, -sin(a - 90) * r4);
    }

    //along the boundary of imaginary circle, lines are created in each 10 degree
    for (a = 0; a < 360; a = a + 10) {
        x2 = cos(a) * r2;
        y2 = sin(a) * r2;
        x3 = cos(a) * r3;
        y3 = sin(a) * r3;

        stroke(255, 240, 100);
        line(x2, y2, x3, y3);
        stroke(0, 50, 130);
        line(x3, y3, -cos(a - 80) * r4, -sin(a - 80) * r4);
    }

    //change size of radius based on position of mouse
    r4 = map(mouseY, 0, 300, 30, 80);
    r1 = map(mouseX, 0, 400, 70, 170);

    //if press mouse radius increases then release radius decrease
    if (mouseIsPressed){
        r2 = r2 + 10;
    } else {
        if (r2 > 90) {
            r2 = r2 - 5;
        }
    }

    //blue lines around canvas
    stroke(0, 50, 130);
    for (var i = -30; i < 30; i++) {
        line(-150, i*17, i*17 - 120, 150);
        line(150, i*17, i*17 + 120, -150);
        line(-150, i*17, -i*17 - 120, -150);
        line(150, -i*17, i*17 + 120, 150);
    }

}
The process was a bunch of geometry to calculate the X, Y coordinate of lines which are created along imaginary circles. I created the animation based on the mouse behaviors. Especially, I like that raylike lines are stretched out when the mouse is pressed.
nayeonk1-LookingOutwards-04
Ryoji Ikeda is a famous japanese sound and media artist. He crosses the boundary between visual media and audio media and creates mesmerizing performances. He focuses on very detailed sound like super sound and frequency using high digital technology. Developing his unique way, he gained world wide fame. In his work, sound, time and space are composed by mathematical way so that physical features of sound could reach to audience’s perception and feeling. Many of his work are consist of variable materials such as visual media, sound, installation object and new fabrications which lead his work to new area of art. I admire his work as he create new dimension to audience with very detailed sound and installation art. I always have interested in different perception to the world, his work gave me a glimpse of new world!
ssontag-Project-04
For this project i struggled with creating something visually exceptional because of my limited knowledge of how to use for loops to create interesting visuals. So i added a animation aspect using the position of the mouse to determine the visuals.
function setup() {
    createCanvas(400, 300);
}

function draw() {
    background(210);
//i used a for loop to iterate the value of i so i could create a
//curve made from lines that have an incremental value based on i
    for (var i = 0; i <= 300; i += 20) {
//using the x value of x i made two sets of lines that are connected at the x value of the mouse
// by making two sets the curves can be moved from the left side to the right side of the canvas
        stroke(0, 128, 128);
        line(i, 0, mouseX, height - i);
        line(i, 300, mouseX, i);

        stroke(0, 0, 128);
        line(width - i, 0, mouseX, height - i);
        line(width - i, 300, mouseX, i);

//using the y value of y i made two sets of lines that are connected at the y value of the mouse
// by making two sets the curves can be moved from the top to the bottom of the canvas
        stroke(128, 128, 0);
        line(0, height - i, width- i, mouseY);
        line(400, height - i, i, mouseY);

        stroke(0, 128, 0);
        line(0, i, width - i, mouseY);
        line(400, i, i, mouseY);
    }
}
Project-04-String-Art
//Hanna Jang
//Section B
//hannajan@andrew.cmu.edu
//Project 04

function setup() {
	createCanvas (400, 300);
    strokeWeight(1);

}

function draw() {
	background(0);
	var x1= 200;
	var accum= 2;
	var space= 40;

 	for (var i = 0; i < 300; i += 40) {
    	//white lines start on left and spread out
    	stroke(255);
      line (0, 0, width, i);
      //white lines start on right and spread out
      line(width, 0, 0, i)

      //pink lines start on left and spread out
      stroke(255, 183, 221);
      line(0, space, width, i);
      //pink lines start on right and spread out
     line(width, space, 0, i);

      //yellow lines start on left and spread out
      stroke(255, 241, 150);
      line(0, space*2, width, i);
      //yellow lines start on right and spread out
      line(width, space*2, 0, i);

      //blue lines start on left and spread out
      stroke(183, 222, 255);
      line(0, space*3, width, i);
      //blue lines start on right and spread out
      line(width, space*3, 0, i);

      //aqua lines start on left and spread out
      stroke(183, 253, 255);
      line(0, space*4, width, i);
      //aqua lines start on right and spread out
      line(width, space*4, 0, i);

      //green lines start on left and spread out
      stroke(151, 231, 182);
      line(0, space*5, width, i);
      //green  lines start on right and spread out
      line(width, space*5, 0, i);

      //purple lines start on left and spread out
      stroke(161, 170, 245);
      line(0, space*6, width, i);
      //purple  lines start on right and spread out
       line(width, space*6, 0, i);

       //hot pink line starts on left and spreads out
       stroke(243, 62, 150);
       line(0, space*7, width, i);
        //hot pink line starts on right and spreads out
      line(width, space*7, 0, i);

    }


}
For this particular project, I was stuck at first on what I should do. I then wanted to try to make a visual illusion. The curves in my project are seen in the middle of the canvas where there are black spots. If you concentrate on the black spots only and move your eyes hori
sijings-lookingOutwards04
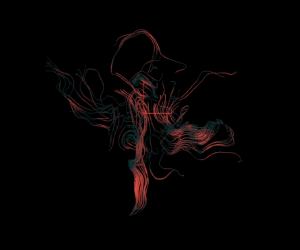
The visualization of sound inspired me because I used to do artworks about visualization, for example, the visualization of math. Thus, I zoomed into the relationship between sound (amplitude and frequency) and visual patterns to see if one relates to the other. Through my exploration, I found Simon Russell’s work to be a really interesting example to me. He is an animation director based in London. This project is about sound visualization and it is called “Audio Geometry Exploration- Sonification in Houdini”. This is a project using Houdini experiments where geometry is used to visualize sound and creates patterns. Simon discovered that Houdini is really flexible with audio and allow the audio to create f-curves from geometry. So he can manipulate in myriad ways. To be more specific, Simon used 3d geometry to connect collisions of lines in the visualized part with an audio pulse based on the shape’s height. The basic strategy is to export from Houdini into Cinema 4D and see cloners and splines to create additional geometry. Last but not least, he used After Effects and Audition to composite and mix. Overall, I really admire the coherence between the visual part and the sound. It is really pleasant to watch the whole video when two of our sensory parts are combined well.
audio geometry exploration: sonification in houdini
Brandonhyun- Project-04-String-Art
I was trying to emulate wave shapes and the movement of waves in this project. When the mouse is moved through the x axis, the strings are elongating towards the right of the canvas and when the mouse is moved through the y axis then the strings elongating downwards.
When the mouse is clicked the background color changes.
// Brandon Hyun
// 15-104 Section B
// bhyun1@andrew.cmu.edu
// Project 04

var increase = 15;
var xInt = 15;

var x1 = 0;
var y1 = 550;
var x2 = 550;
var y2 = 0;
var red;
var green;
var blue;

function setup() {
  createCanvas(400, 300);
}

function draw() {
  background (red,green,blue);
  var m = 400/25;
	for(var i = 0; i < m; i += 1) {
        strokeWeight(1);
		    stroke(40,40,40);


        for(var j =0; j<10; j+=1){
          line(mouseX+40*j, increase * i, increase * i +40*j, y1);
        }

		    for(var z =0; z<10; z+=1){
          line(mouseY+ x2 - increase * i, y2+40*z, x1, increase * i+ 40*z);
        }

	}
}

function mousePressed() {
  red = random(0,255);
  green = random (0,255);
  blue = random (0,255);
}
ssharada-project-04-section-a-string-art
//Shariwa Sharada
//Section-A
//ssharada@andrew.cmu.edu
//Project-04

var gap = 1; //spacing between lines
var x1 = 0; //starting point x
var x2 = 200; //mid-point x
var x3 = 400 //endpoint x
var y1 = 150; //midpoint y
var y2 = 0; //starting point y
var y3 = 300; //end point y


function setup(){
	createCanvas(400,300);
	strokeWeight(1); //predetermining the stroke weights of everything
}

function draw(){
	background(255, 247, 213);

	gap = map(mouseY, 0, 300, 3, 10);//mapping the gap size so that it is proportionate no matter the placement of the mouse

	var g = 150; //changing the green value
	var b = 100; //changing the blue value
	var r = 50; //changing the red value


	for (var i= 0; i< width; i++){

		//creating the first pair of dark green to yellow curves
		stroke(r,g,0);
		line (x1, gap*i, gap*i, y1);//creating lines based of the start and mid points
		line (x2, gap*i, gap*i, y2);
		g += i/20; //creating a gradation in the colour range in terms of the increment
		r += i/10;

		//creating the second pair of yellow to dark green curves
		stroke(r,g,0);
		line (gap*i, height-y1, width-x1, gap*i); //creating lines based of the end and mid points
		line (gap*i, height-y2, width-x2, gap*i);
		g += i/2;//creating a gradation in the colour range in terms of the increment
		r += i/4;
	}

	//creating the third pair of green to blue curves
	for (var j= 0; j< width; j++){
		stroke(0,g,b);
		line (x3, gap*j, gap*j, y1); //creating lines based of the end and mid points
		line (x1, gap*j, gap*j, y3);
		g += j/20; //creating a gradation in the colour range in terms of the increment
		b += j;


	}


}
The main aim of my work was to examine the difference between larger increments and smaller increments while trying to vanish some lines into the background and keeping focus on a few of them. I wanted to explore this idea because I found it fascinating how the lines when they come together form this dense intrinsic pattern of curves that you could never imagine that they could come from straight lines – but as you drag the mouse away, you realise what actually creates the lines and it makes you wonder about the complexity of everyday simple objects like curves
dayoungl – LookingOutwards 04
http://www.norment.net/work/sonic-performance-ind/rapture/
Camille Norment is an Oslo-based multimedia artist who works with sound, installation, sculpture, drawing, performance and video. For her piece, “Rapture”, she utilizes 12 voice chorus, glass armonica tones, and audio devices. According to the artist, ‘Rapture’ is a three-part project consisting of 1) a solo exhibition in the Nordic Pavilion, 2) a series of sonic performances unfolding from physical and referential elements within the installation, and 3), a three-part publication that explores the greater context of the investigation through a variety of essays relating sound to the body and society. Mainly, the artist explores the tension of constantly changing time and uncertainty of times. ‘Rapture’ uses vibrations (sound waves) for a phenomenological and socio-political reflection upon the body and mind’s relationship to trauma, ecstasy and the state of becoming. The body of the pavilion itself is subject to this experience, allowing visitors to witness, and enter within a body suspended in a state of excitation. Through this piece, visitors walk into a space of contrasting values: body of art in order and in chaos; art in harmony and in dissonance.
dnoh-sectionD-project4-stringart
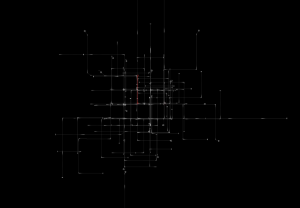
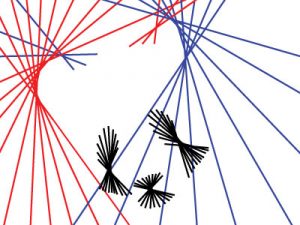
I attempted to create a panda using lines. I first created a sketch on Adobe Illustrator to map out the locations of the lines. I will be honest… I did not expect this to be so difficult. I used if statements to confine lines and move them around, so everything is “animated”.
Above, is the sketch I attempted to recreate on p5js.
As you can see… it didn’t turn out as expected.
/*
Daniel Noh
Section D
dnoh@andrew.cmu.edu
Project-04-String-Art
*/

var x1 = 172;
var y1 = 300;
var x2 = -50;
var y2 = 0;

var x3 = 100;
var y3 = 92;
var x4 = 0;
var y4 = -30;

var x5 = 95;
var y5 = 300;
var x6 = 300;
var y6 = 0;

var x7 = 172;
var y7 = 62;
var x8 = 260;
var y8 = 0;

var x9 = 130;
var y9 = 250;
var x10 = 160;
var y10 = 200;

var x11 = 251;
var y11 = 237;
var x12 = 229;
var y12 = 160;

var x13 = 268;
var y13 = 213;
var x14 = 190;
var y14 = 145;

var x15 = 182;
var y15 = 276;
var x16 = 218;
var y16 = 235;

function setup() {
    createCanvas(400, 300);
    background(255);
}

function draw() {
//red left ear

  stroke(255,0,0);
  strokeWeight(2);
  line(x1,y1,x2,y2);

  if (x1 > -150) {
    x1 = x1 - 50;
  }

  if (x2 < 240) {
    x2 = x2 + 50;
  }

  if (y1 > 180) {
    y1 = y1 - 20;
  }

  //blue left ear

  stroke(0,0,255);
  line(x3,y3,x4,y4);

  if (x3 >= 100 & x3 <= 129) {
    x3 += 15;
    y3 -= 10;
  }
  if (y4 <= 30 & y4 <= 100) {
    x4 -= 50;
    y4 += 50;
  }

  //blue right ear

  stroke(0,0,255);
  line(x5,y5,x6,y6);

  if (x5 >= 95 & x5 <= 400) {
    x5 = x5 + 55;
  }
  if (x6 <= 300 & x6 >= 130) {
    x6 = x6 / 1.04;
  }
  if (x5 > 400) {
    y5 = y5 - 100;
  }

  //red right ear
  stroke(255,0,0);
  line(x7,y7,x8,y8);

  if (x7 <= 205) {
    x7 = x7 + 17;
    y7 = y7 - 3;
  }
  if (x8 >= 210) {
    x8 = x8 - 26;
  }

  //left eye
  stroke(0);
  line(x9,y9,x10,y10);

  if (x9 <= 175) {
    x9 = x9 + 5;
    y9 = y9 + 1;
  }
  if (x10 >= 143) {
    x10 = x10 - 5;
    y10 = y10 - 9;
  }
  if (x10 >= 129 & x10 <= 142) {
    y10 = y10 + 13;
    x10 = x10 - 4;
  }

  //right eye top
  line(x11,y11,x12,y12);

  if (x11 <= 265) {
    x11 = x11 + 5;
    y11 = y11 - 5;
  }
  if (x12 >= 200) {
    x12 = x12 - 7;
    y12 = y12 - 5;
  }

  //right eye bottom
  line(x13,y13,x14,y14);

  if (x13 <= 278) {
    x13 = x13 + 3;
    y13 = y13 - 3;
  }
  if (x14 <= 215) {
    x14 = x14 + 4;
    y14 = y14 + 6;
  }

  //mouth
  line(x15,y15,x16,y16);

  if (x15 <= 205) {
    x15 = x15 * 1.03;
    y15 = y15 * 1.01;
  }
  if (x15 >= 206 & x15 <= 232) {
    x15 = x15 * 1.03;
    y15 = y15 / 1.02 ;
  }
  if (x16 >= 213) {
    x16 = x16 - 4;
    y16 = y16 - 5;
  }
  if (x16 >= 176 & x16 <= 212) {
    x16 = x16 / 1.03;
    y16 = y16 * 1.01;
  }
}