Matthew Erlebacher

Video on the work of No Ceilings

Video on the work of Connected China

To be completely honest, it was somewhat hard for me to find interest in this looking outward report. This probably isn’t what you wanted me to write about, but I simply don’t find it very interesting. However, one program that was able to engage me was Fathom by Ben Fry. In particular, I enjoyed looking at the No Ceilings video which showcased statistics on how women’s rights have progressed over the years. They had statistics on things such as teenage pregnancy, child brides, and female entrepreneurship. I also found the Connected China video to be somewhat interesting. The website offered a look into the inner workings of the Chinese government, and a large amount of information on their leaders. As for the algorithms they used, likely had to create a lot of computer graphics. In addition, it seems like they had to program a large amount of mouse interactions. These helped the website feel more alive, as well as make for an incredibly intuitive experience.

http://www.noceilings.org/

http://china.fathom.info/

hannahk2-LookingOutwards-07

The project I chose for this week is “Flight-Patterns” by artist, Aaron Koblin. It is a computational information visualization project created as a series of experiments for the project, “Celestial Mechanics”. The project basically takes paths of air traffic over North America, and visualizes them in color and form, creating luminescent cotton-like webs of light and paths. To make this project, FAA data was parse and plotted using the Processing programming environment. I admire this project because the artist was able to take something as mundane and repetitive as flight paths, and turn them into a stunning visual map. The lines look like the thinnest strands of thread and resemble the shape of the united states. I can see the artists’ creative sensibilities manifesting in the work, because seeing his other works he is obviously drawn to fragile and delicate, complex and elegant lines. I am also extremely amused by his project, The Single Lane Superhighway, in which he invites visitors of his website to draw a car facing right, using a simple drawing tool he created. After reaching 50,000 cars, he compiled them to drive on a never ending parade on a single line. I thought this was really cute.

http://www.aaronkoblin.com/project/flight-patterns/

http://www.aaronkoblin.com/project/the-single-lane-superhighway/

Matthew Erlebacher Project-07

Curve Pattern

// Matthew Erlebacher
// Section B
// merlebac@andrew.cmu.edu
// Project-07

function setup() {
    createCanvas(480, 480);
}

function draw() {
    background(125);

    var angR = map(mouseX, 0, 6.28318, 0, width);
    // Controls the rotation of the points
    var stem = map(mouseY, 0, 10, 0, height);
    // Determines the amount of stems
    
    push();
    translate(width/2, height/2);
    beginShape();
    for (var ang = 0; ang <= 6.28318; ang += 0.001) {
        var radius = 200 * cos(stem * ang);
        // Sets the radius
        var flowerX = radius * cos(ang);
        var flowerY = radius * sin(ang);
        // I found the equation from Dan Shiffman and decided to crank it up to 11
        // https://www.youtube.com/watch?v=f5QBExMNB1I

        strokeWeight(5);
        rotate(angR);
        point(flowerX, flowerY);
        // This creates points which create a flower pattern I used points instead of vertex because vertex looked unappealing
    }
    endShape(CLOSE);
    pop();
}

I am really glad with how this project turned out. At first I was pretty overwhelmed by the code and equations. However, after I watched Dan Shiffman’s video “Coding Challenge #55: Mathematical Rose Patterns” I had a much better understanding of the assignment. I decided that my two aspects of variability would be the amount of stems in the flower, and the rotation. I started out using vertex, but decided to change it to point since it had a much smoother look. I also wanted to make it so that it could rotate as much as possible, and have a massive amount of stems. I opted out of using color because I thought that it gave the image a more simplistic look.

Sheenu-Project-07-Composition with Curves

sketch

//Sheenu You
//Section E
//sheenuy@andrew.cmu.edu
//Project 07
var nPoints = 100;
function setup() {
    createCanvas(480, 480);
    background(0);

}
function draw(){
	background(218,205,188)
	drawLoopFlower();

}

function drawLoopFlower() { 
	//SHIFTS SHAPE INTO CENTER OF CANVAS
	translate(240,240);
	//MULTIPLIES SHAPE
	//MATH VARIABLES
	for (var o=0; o<80; o++){
	var x;
	var y;
	var a=o*.5+mouseX/5
	var b=mouseX/30;

	stroke(56+o*1,82-o*1,139-o*1);

	noFill();
	
	//STARTS SHAPE
	beginShape();
	
	//MATHEMATICAL EQUATION FOR EPIcyCLOID 
	//x=(a+b)cos(theta)-bcos((a+b)/b*theta)
	//y=(a+b)sin(theta)-bsin((a+b)/b*theta)
	//ellipse(240,240,a,a)
	
	for (var i =0; i<nPoints; i++){
		var t = map(i,0,nPoints,0, TWO_PI);
		x=(a+b)*cos(t)-b*cos(((a+b)/b)*t+80)
		y=(a+b)*sin(t)-b*sin(((a+b)/b)*t+80)
		//x=o*a*((b-1)*cos(t)+cos((b-1)*t))/b
		//y=o*a*((b-1)*sin(t)-sin((b-1)*t))/b
		vertex(x,y);
	}
	//END SHAPE
	endShape(CLOSE);
}

}

Many curve compositions posted on site inspired me to make this curve. I used a for loop to multiply the number of curves so it can create a much more visually appealing and interesting picture. I also found a color palette I liked and used it in this image. I transformed the common Hypotrochoid curve in the example into a beautiful and much more interesting shape.

monicah1-lookingoutward-07

The Rhythm of Food by Moritz Stefaner

This project Mortiz Stefaner works on relating specific food and time of the year. For example, he looked at the human purchase behavior on apricot; The population of purchasing apricot, the amount they buy, and when they buy.

I am interested in this data visualization because I never seen data viz on specific food. When I really look into the visualization. The visual tells me so many information, like stories, seasons, demographic and more. When looking at data viz on strawberry, it interesting to see the anecdote on how strawberries relates to valentines. It would be interesting to see if people are keeping up with the tradition on certain holidays by looking at people behaviors when purchase food. Also, the data viz can clearly support people supply and demand needs.


elizabew – Looking Outwards – 07 – sectionE

Inequaligram, a project worked on by Lev Manovich and Agustin Indaco, is a project that focused on analyzing public Instagram images in Manhattan over a period of five months. The point of the project was to measure and correlate the economic equality with how much people share between different parts of the city.

I really look up to this project since it tackles a new modern day social issue relating to inequality that many people are affected by in one way or another. The result was interesting in that after analyzing over 7 million photos, they found that the inequality of these images were actually higher than inequalities between different standards of living of the locals; and that the inequality of visitors’ images is even larger than extreme income inequality. Poor areas show much less while rich areas have become “social media rich”.

data-visualization between photos taken by locals/visitors

In order to generate the dataset for this research, Lev Manovich and Agustin Indaco used Instagram images with location information to collect their data while using the standard measure of inequality (Gini index) to measure the social inequality. In order to visualize all this data, they plotted locations of 200,000 random images from their dataset.

Click here for more information on the project

amui1-LookingOutwards-07


The project I chose to reflect on for this week’s Looking Outwards is called “Facebook Flowers.” This project is by Stamen Designs.

This first video is called “Marvin the Martian.” The artists follow the viral activity after George Takei, an American Actor, most well known as Hikaru Sulu in Star Trek, shares a “Marvin the Martian” picture on Facebook. They realized that the sharing and connections that follow a thread create this ever continuing strand, which branches indefinitely off of numerous points. The artists compare this large and complex data set to a living organism such as a plant or algae.

Caption: “Marvin the Martian.” This video is showing the thread after George Takei shared a picture on Facebook.

Caption: “Famous Failures.” Facebook thread after posting of the most famous failures.

This video is called “Famous Failures.” I admire this video in particular because it contrasts significantly to the video above. This “algae” is much more concentrated and sprouting much more quickly. This represents how fast and how far “bad news” spreads. I can only imagine how large and complex the data set behind this visualization was. So, it is really inspirational that the artists were able to symbolize and communicate the same meaning from the data set in such a representative, graceful experience.

I couldn’t find any information on how exactly the artists related the data set points to the points on the visualization. However, I suspect there is a mapping of points (each time the thread is continued) from an original point (the beginning post). I suspect, after that, maybe the points are transferred to an x-y plot.

The full page can be found here

Project-07

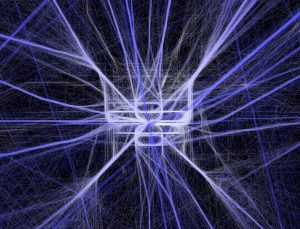
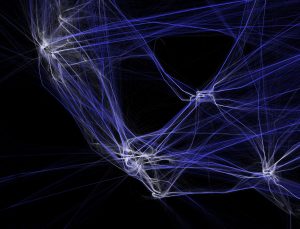
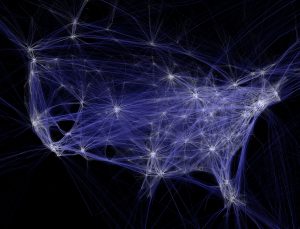
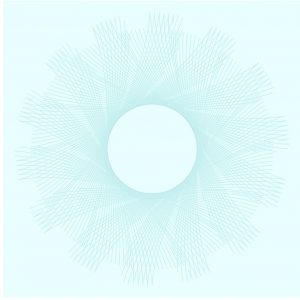
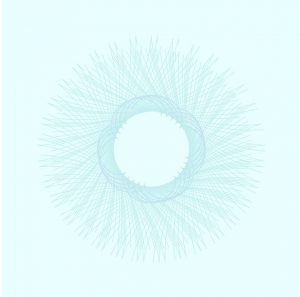
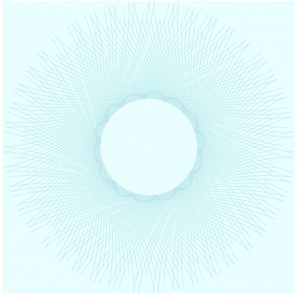
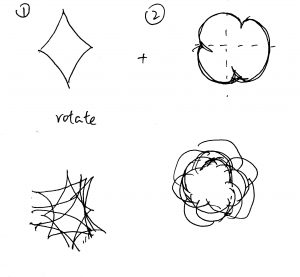
This project is an exploration of connecting two shapes through variables. My main focus was to create points along the outside of the curves, like the examples, and pass those positions to another shape as start/end points. My favorite part of this assignment was taking two existing functions, and implementing them together in one program. Some errors I encountered were duplicate variables, miscommunication of variable between functions, and misaligned positioning of drawn shapes.

sketch

//Ty Van de Zande
//ctv@andrew.cmu.edu
//Project-07
//Section B


//Most of this code was repurposed from the examples provided
//by Professor Dannenberg. Additions were made to explore 
//curves, helper functions, and passing variables.

var friz = [];
var frizy = [];
var frizX = [];
var frizyY = [];

function setup() {
    createCanvas(480, 480);
    frameRate(10);
}

function draw() {
    background(255, 200, 200); //I additionally love this pink
    fill(255, 255, 255, 64);
    var nPoints = mouseX/10;
    var radius = 50;
    var separation = 125;
    drawShape(nPoints, radius, separation);
    drawEpitrochoidCurve(nPoints);
    yoyo(nPoints, separation);

}

function drawShape(nPoints, radius, separation){  // draw the circle normally
    push();
    translate(1*separation, height / 2);
    beginShape();
    for (var i = 0; i < nPoints; i++) {
        var theta = map(i, 0, nPoints, 0, TWO_PI);
        var px = radius * cos(theta);
        var py = radius * sin(theta);
        vertex(px,py); 
        ellipse(px, py, 3,3);
        friz[i] = px;
        frizy[i] = py;
    }
    endShape(CLOSE);
    pop();  
}

//--------------------------------------------------
function drawEpitrochoidCurve(nPoints) {
    // Epicycloid:
    // http://mathworld.wolfram.com/Epicycloid.html
    
    var x;
    var y;
    
    var a = 80.0;
    var b = a / 2.0;
    var h = constrain(mouseY / 8.0, 0, b);
    var ph = mouseX / 50.0;
    
    fill(255, 200, 200);
    beginShape();
    for (var i = 0; i < nPoints; i++) {
        var t = map(i, 0, nPoints, 0, TWO_PI);
        
        x = (a + b) * cos(t) - h * cos(ph + t * (a + b) / b);
        y = (a + b) * sin(t) - h * sin(ph + t * (a + b) / b);
        vertex(x+height/2, y+width/2);
        frizX[i] = x;
        frizyY[i] = y;
        
        
    }
    endShape(CLOSE);
    
}

function yoyo(nPoints, separation) {
    var w = width/2;
    for(var i = 0; i < nPoints; i++) {
        line(friz[i]+separation, frizy[i]+w, frizX[i]+w, frizyY[i]+w);
    }
    
}

rsp1-LookingOutwards-07

Calligraffiti

https://creators.vice.com/en_us/article/nz57wz/activists-are-projecting-digital-calligraffiti-onto-walls-in-berlin

Calligraffiti is an art form combining traditional calligraphy with graffiti. In yet another unlikely symbiosis, calligraffitos are now fusing it with new media to render “digital calligraffiti,” which is projected onto the sides of structures. Worked on by refugees, the medium is a part of a community project organized by Public Art Lab. The main idea with this project is to transform the “urban screens” such as subways and building exteriors into communication platforms for immigrants. A lot of these pieces convey messages such as  “love not war,” “art is love,” and “no violence.”

From this project, I appreciate how new media art is now also being used as a new platform to raise awareness of social injustice or unnecessary violence. Instead of being just a static installation that lives in a museum, Calligraffiti can be seen in the simplest of neighborhoods and the everyday lives of the citizens who live nearby these pieces.

calligraffiti in action
the board where people can create their artwork
This man’s calligraffiti is being projected onto the wall right in front of him as he creates the calligraphy

yunzhous-project-07

sketch

function setup() {
    createCanvas(480, 480);
    angleMode(DEGREES);
}

function draw() {
    background("lightcyan");
    curve1();
    curve2();
}

function curve1(){
    //astroid
    beginShape();
    stroke(178, 240, 241);
    noFill();
    translate(width/2, height/2);
    for (var i = 0; i < mouseX/2; i ++){ //mouseX controls number of curves
        LimMouseX = constrain(mouseX, 0, width);
        var a = map(LimMouseX, 0, width, 10, 80); //relate to mouseX
        var theta = map(i, 0, mouseX, 20, 360);
        var x = 2 * a * cos(theta) + a * cos(2 * theta);
        var y = 2 * a * sin(theta) - a * sin(2 * theta);
        vertex(x, y);
    endShape();
    rotate(mouseX); //rotate according to position of mouseX

    }
}
function curve2(){

    //Epicycloid Involute
    beginShape();
    stroke(178, 230, 241);
    noFill();
    for (var i = 0; i < mouseX; i ++){ //mouseX controls number of curves
        LimMouseX = constrain(mouseX, 0, width);
        var a = map(LimMouseX, 0, width, 0, 80); //relate to mouseX
        var theta = map(i, 0, mouseX/5, 20, 360);
        var b = map(mouseY, 0, height, 0, 50);
        var x2 = (a+b)*cos(theta) - b*cos(((a+b)/b)*theta);
        var y2 = (a+b)*sin(theta) - b*sin(((a+b)/b)*theta);
        vertex(x2, y2);
    endShape();
    }
}

For this project, I started with researching for curves. I found astroid and epicycloid involute to be interesting and not overly complicated. I wrote two for loops to create multiple curves, and the curves rotate to create repetition. The curves are centered at the canvas and as mouseX and mouseY moves, they generate different pattern