atraylor – Project 04 – Section B

sketch

// atraylor
// project 04, Section B

var x1 = 0;
var y1 = 0;
var x2 = 0;
var y2 = 0;
var num = 0.01;

function setup() {
    createCanvas(400, 300);
    background(178, 44, 0);

}

function draw() {

    for (var i = 0; i < 10; i++) { //Drawing the lines from the edges
        stroke(0, 178, 135);
        lineLeft(i, y1);
        lineRight(i, y1);
    }

    for (var i = 0; i < 180; i++){ // drawing the line spiral
        c = color(25, 255, 200);
        num += 1;
        if (i > 60) {
            c = color(255, 62, 0);
        }
        if (i > 120){
            c = color(25, 255, 200);
        }
        if (i > 180){
            c = color(255, 62, 0);
        }
        stringLine(num, c, i);
    }
    noLoop(); // stoping the for loop so it doesn't keep drawing
}

function stringLine(deg, col, i) {
    push();
    translate(200, 150);
    rotate(radians(deg * 6));
    stroke(col);
    line( i * 0.5, 0, 200, 0); // changing the x position so the radius increases
    pop();
}

function lineLeft(i, y1) { // the two line things on the left side
    y1 = lerp(0, 400, i * .01); // these interpolate between the points, beginning y and end y
    y2 = lerp(300, 0, i * .01);
    line(0, i * 2 + 280, 200, i * y1);
    line(0, i * 2, 200, i * y1);
}

function lineRight(i, y1) { // the only difference is that these start at 400 rather than 0
    y1 = lerp(0, 400, i * .01);
    y2 = lerp(300, 0, i * .01);
    line(400, i * 2 + 280, 200, i * y1);
    line(400, i * 2, 200, i * y1);
}

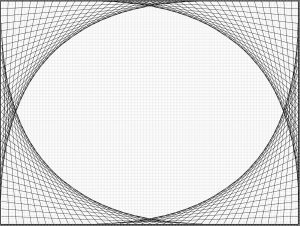
For this project, I tried to use the lerp() function to define the beginning and end points of my lines. It was a rough task because I knew what lerp was supposed to do, but I wasn’t checking my changes after I made them. I figured it out but it took a lot of guessing and checking.


svitoora – 04 Gravity 2.0

Gravity

//
// Supawat Vitoorapakorn
// Svitoora@andrew.cmu.edu
// Section E
//
// Gravity 2.0 is a point mass dynamic drawing inspired
// from physics, nature, and falling off a skateboard.
// f = G (m1*m2)/d^2
// f = G sum(m)/(d from avg)^2


// World Model Setup /////////////////////////////////////
var max_curves = 4; //Limit amount of drawings

var w = 300;
var h = 400;
var t = 1; // time variable
var g = 12; // gravity

var ball;
var balls = []; // Local Objects
var ballz = []; // Global Object
var ball_size = w * .010 // Default object size

var max_count = 35;
var auto_every = 40;
var auto_create = 125;
var max_line = 1000; // Prevents crash


// Control ///////////////////////////////////////////////

// Creates new object in system given (x,y)
function ball_create(x, y) {
	this.x = x;
	this.y = y;
	this.vx = 0;
	this.vy = 0;
	this.r = ball_size;
	this.m = 1;
	this.ALPHA = 255
}

function mousePressed() {
	ballz.push([]);
	// print("Added Yo");
}

// Add new object and delete oldest object
function mouseDragged() {
	if (t % 10) {
		ballz[ballz.length - 1].push(new ball_create(mouseX, mouseY));
	}
	if (ballz[ballz.length - 1].length >= max_count) {
		ballz[ballz.length - 1].splice(0, 1)
	}
}

// World /////////////////////////////////////////////////


// Maintain global mass of system
function sum_mass(balls) {
	sum_m = 0;
	for (i in balls) {
		sum_m += balls[i].m;
	}
	return sum_m;
}

// Determines the system's average position X
function average_posX(balls) {
	if (balls.length == 0) {
		return w / 2;
	};
	var sum_x = 0;
	for (i in balls) {
		sum_x += balls[i].x;
	}
	avg = sum_x / balls.length
	return avg;
}

// Determines the system's average position Y
function average_posY(balls) {
	if (balls.length == 0) {
		return h / 2;
	};
	var sum_y = 0;
	for (i in balls) {
		sum_y += balls[i].y;
	}
	avg = sum_y / balls.length;
	return avg
}

// Apply gravity for all objects in the system
function gravity(balls) {
	var avg_x = average_posX(balls);
	var avg_y = average_posY(balls);
	var speed = .005 //0-1 Multuplier for controlling velocity of attratction
	for (i in balls) {
		d = dist(balls[i].x, balls[i].y, avg_x, avg_y);
		ds = map(d, 0, w / 2, 1, 0); // used to simulate d^2

		// Gravity X
		if (balls[i].x > avg_x) {
			balls[i].x *= 1 - (g * (balls.length * speed));
		} else {
			balls[i].x *= 1 + (g * (balls.length * speed + ds));
		}

		// Gravity Y
		if (balls[i].y > avg_y) {
			balls[i].y *= 1 - (g * (balls.length * speed))
		} else {
			balls[i].y *= 1 + (g * (balls.length * speed + ds));
		}
	}
}

// Add object to system in the middle; // Used at setup()
function add_ball(balls) {
	balls.push(new ball_create(w / 2, h / 2));
}


// Connects all the object in the system via a line
function draw_line(balls) {
	lines = 0
	opacity = 255 * .1

	if (lines < max_line) {
		for (i in balls) {
			var x_1 = balls[i].x;
			var y_1 = balls[i].y;
			for (i in balls) {
				var x_2 = balls[i].x;
				var y_2 = balls[i].y;
				stroke(255, 255, 255, opacity);
				line(x_1, y_1, x_2, y_2);
				lines += 1;
			}
		}
	}
}

// SETUP
function setup() {
	createCanvas(w, h);
	g = .0025;
	background(50);
	balls.length = 0; // Kill all objects in system
}

// Refreshes the systems with new objects
// Removes old objects and add new objects
function auto_refresh(balls, t) {
	// Starts refreshing system at 5 objects
	// every auto_every interval.
	if (t % auto_every == 0 & balls.length > 5) {
		balls.splice(0, 1);
	}
	X = constrain(mouseX, 1, w);
	Y = constrain(mouseY, 1, h)
	if (t % auto_every == 0) {
		balls.push(new ball_create(X, Y));
	}

	// Resets the system to 8 objects once every 500 ms
	// This prevents overload; Array starts at [0]
	if (t % 500 == 0 & balls.length > 8) {
		balls.length = 7;
	}
}

// Draw ////////////////////////////////////////////////////

// Draw all objects in systems mapped by distance from avg
function draw_balls(BALLS) {
	// print("BALLS.length" + BALLS.length)
	for (i in BALLS) {

		var avg_x = average_posX(BALLS);
		var avg_y = average_posY(BALLS);

		var d = dist(BALLS[i].x, BALLS[i].y, avg_x, avg_y);
		var SIZE = map(d, 0, w / 2, -2, 3) //max to min
		print(i + " : " + SIZE)

		noStroke();
		fill(255, 255, 255, 255 * .5);
		ellipse(BALLS[i].x, BALLS[i].y,
			BALLS[i].r * (2 * SIZE),
			BALLS[i].r * (2 * SIZE));
	}
}

function local_gravity(ballz) {
	for (i in ballz) {
		if (ballz[i].length > 1) {
			gravity(ballz[i]);
		}
	}
}

function DIE(BALLS) {
	BALLS.splice(0, 1);
}

function death_ballz(ballz) {
	var populated = 0;
	for (i in ballz) {
		if (ballz[i].length != 0) {
			populated++;
		}
	}
	if (populated > max_curves) {
		DIE(ballz[0]);
	}
}


function refresh_ballz(ballz) {
	if (ballz.length > 4) {
		for (i in ballz) {
			if (ballz[i].length == 0) {
				ballz.splice(i, i + 1);
				ballz.push([]);

			}
		}
	}
}


function draw_ballz(ballz) {
	for (i in ballz) {
		draw_balls(ballz[i]);
	}
}

function draw_lines(balls) {
	for (i in ballz) {
		draw_line(ballz[i]);

	}
}

// Creates Trail
function guider1() {
	stroke(255, 255, 255, 255 * .75)
	line(mouseX, mouseY, pmouseX, pmouseY)
}

// Prompt user to drag via random generation
function guider2() {
	ran1 = random(4, 12);
	if (t % auto_create == 0) {
		ballz.push([])
		ballz[ballz.length - 1].push(new ball_create(mouseX, mouseY));
		ballz[ballz.length - 1].push(new ball_create(pmouseX, pmouseY));
		for (var i = 0; i < ran1; i++) {
			ballz[ballz.length - 1].push(new ball_create(mouseX * random(.75,
				1.25), mouseY * random(.75, 1.25)));
		}
	}
}

// Execute /////////////////////////////////////////////////
function draw() {
	background(50);
	noStroke();
	// Update World
	t = t + 1;
	local_gravity(ballz);
	death_ballz(ballz);
	refresh_ballz(ballz);
	// LOL();

	// // Draw World
	draw_lines(ballz);
	guider1();
	guider2();
	// draw_ballz(ballz);	// For Some reason this doesn't work
	// Maybe it ran out of memory allocation


}

Click and drag to draw shapes. Try writing your name. I struggle with array in arrays. Eventually figured I figured it out.

aboyle-Project-04-String Art

aboyle String Art

function setup() {
    createCanvas(300, 400);
}

var move=100
var dir=1

function draw(){
    background(mouseX/2+mouseY/2);
    noFill();

//if moving lines hit the center of the circles, they switch direction
    move+=dir*2
    if (move>=300 || move<=100){
      dir=-dir
    }

  for (var i=10; i<=150; i+=10){
      //creates border lines on left
      stroke(0,300-mouseX,300-mouseX)
      line(0,110-i/2,i*2,0);
      line(0,296+i/2,i*2,400);
      //creates border lines on right
      line(300,360-i/2,i*2,400);
      line(300,30+i/2,i*2,0);
      //creates moving lines
      stroke(300-mouseX,0,300-mouseX)
      line(150,move,i-10,0);
      line(150,move,310-i,0);
      line(150,move,i-10,400);
      line(150,move,310-i,400);


    if (i<100){
      //creates side curves
      stroke(300-mouseX,0,0)
      curve(-200-i*4,150,0,155-i/5,0,255+i/5,-200-i*4,250)
      curve(500+i*4,150,300,145-i/5,300,245+i/5,500+i*4,250)
      //creates circles
      ellipse(150,100,30+i/2)
      ellipse(150,300,30+i/2)
      //creates center curves
      stroke(0,0,300-mouseX)
      curve(0,400,0,300,100+i,200,100,0);
      curve(0,400,300,300,100+i,200,100,0);
      //mirror image of curves
      push();
      translate(width,height);
      rotate(PI);
      curve(0,400,0,300,100+i,200,100,0);
      curve(0,400,300,300,100+i,200,100,0);
      pop();

    }
  }
}

I didn’t really have any ideas about what I wanted the final product to look like, so I just started messing around with different lines to see what would happen. I think that string art is visually appealing, so now that I have a basic grasp on for() I’m excited to play around with it in the future. I decided to add some color changes and movement as well, just to spice it up a little. The one thing I had trouble with was creating the center curves; I ended up making one half and then mirroring it with push() and pop(), but I bet there’s a simpler way to do it.

hqq – secE – project04 – string art

hamza

//hamza qureshi
//section e
//project 04
//hqq@andrew.cmu.edu

var x1;
var y1 = 1;
var x2 = 1;
var y2 = 1;
var yDes = 400;

function setup(){
    createCanvas(300,400);
}

function draw(){
    background(30); //dark gray background
    //create a single loop that sets the limits
    //within the x1 variable to allow the curves
    //to stretch horizontally
    for (var x1 = 0; x1 < 4*width; x1 += 5){
        strokeWeight(0.3);
        var y1 = x1 * 0.50;
        var yDev = height/4 + y1;
//outermost lines that are brightest in color
        stroke(180);
        line(x1*4, y1, x1-yDes, y2*0.5);
        line(x1*.10, height, x2, yDev);

//next ring
        stroke(130);
        line(x1*0.4, y1*0.6, x1-yDes, y2*0.5);
        line(x1*2, height*2, x2, yDev);

//next ring
        stroke(80);
        line(x1*0.4, y1, x1-yDes, y2*0.5);
        line(x1*.90, height, x2, yDev);

///next ring
        stroke(60);
        line(x1*0.3, y1, x1-yDes, y2*0.5);
        line(x1*1.7, height, x2, yDev);

//next ring
        stroke(50);
        line(x1*0.2, y1, x1-yDes, y2*0.5);
        line(x1*2.5, height, x2, yDev);

//final ring
        stroke(40);
        line(x1*0.1, y1, x1-yDes, y2*0.5);
        line(x1*3.2, height, x2, yDev);
    }
}

//voila!

For this piece of string art, I wanted to create a piece that used a tunneling effect to show depth. To do this, I used the for loop to change the size, orientation, and stroke color to make it appear as if the sections are getting deeper and deeper. After a few projects where the code became so long, I’m glad that this one uses a much more refined syntax.

heeseoc-Project-04-StringArt

heeseoc-stringart

//Steph Chun
//15-104 section #A
//heeseoc@andrew.cmu.edu
//Project-04

function setup() {
    createCanvas(400, 300);
}

function draw() {

	background(0);

	for (var i = 0; i < 500; i++) {

		stroke(150+mouseX, 255-mouseY, 100); //color change depending on cursor location// 
		strokeWeight(.5); 
	
		line(i*15, height, mouseX, height-i*15); //when mouse is at horizontal center, bottom left//
		line(mouseX, i*15, width-i*15, 0); //top right
		line(i*15+width, height, mouseX, i*15); //bottom right
		line(i*15, 0, mouseX, i*15); //bottom right
}
}

I’ve been experimenting with the curves that connect the adjacent sides of the canvas. While moving them around, I found out that it creates an interesting dimensional quality when the flat sides stick together along the cursor, so I flipped the curves so that the four curves follow the mouse. I gave a slightly different value for one of the curves, because the form as a whole looked boring when it was completely symmetrical.

elizabew-Project-04- String Art

sketch

//Elizabeth Wang
//elizabew
//Section E
//Project-04: String Art


// for (var VARNAME = STARTINGVALUE; VARNAME < LIMIT; VARNAME += INCREMENT) {
//     WHAT_TO_DO;
// }


function setup() {
  createCanvas(400,300);
  background(0);

}

function draw() {

  for (var x = 0; x <= 300; x += 10){ //looping lines with a spacing of 10 each time
    stroke(255);
    strokeWeight(.01);

    line(0, height - x, x * 1.5, 0); //upperleft

    line(width, x * 1.5, height - x, height); //lowerright

    line(0, x * 1.5, height/4 + x, height); //left side of eye

    line(height, height/20 + x, x * 1.5, 0); //right side of eye

    noStroke();
    fill(255);
    ellipse(180, 160, 80, 80);

  }


}

Reflection

At the beginning of the project, instead of coming up with an idea of what to make with lines, I wanted to practice getting used to using the for() function and seeing how it affects the shape and look of the lines. After a while, I felt that what I was beginning to form looked like an eye, and so I decided to work towards that as the goal of my project.

selinal-Project-String Art-04

My process for creating these visuals was first to cement a series of curves in a “random” line and balance that series with other curves series based on the location and spread of the first.

sketch

//Selina Lee
//Section C
//selinal@andrew.cmu.edu
//Project-04

function setup() {
    createCanvas(400, 300);
    background(250, 220, 130); //faint yellowish background
    
    noStroke();
    fill(200, 220, 170, 120); //greenish arced shadow on right lower corner
    ellipse(400, 320, 550, 400);

    for(var line1x = 0; line1x < width; line1x += 15) { //initial red series of curves with increments of 15
    	fill(200, 210, 110, 120); //greenish light color to fill curve shapes
    	stroke(250, 70, 20); // red line
    	curve(line1x, line1x, line1x * 10, 100, line1x * 2.5, 200, line1x * 2, height); 

    	curve(line1x - 15, height*1.5, line1x * 10 + 20, 220, line1x/2, 50, line1x * 2, 0);

    	curve(line1x/5, 0, -line1x, 0, line1x, 75, line1x + 50, 200);

    	curve(line1x, -100, -line1x/5, 100, line1x*10, 0, line1x + 50, 200);
    }
    
    for(var line2x = 6; line2x < width; line2x += 15) { //yellow series of curves with increments of 15 but starting more right
    	noFill();
    	stroke(250, 200, 0);
    	strokeWeight(2);
    	curve(line2x, line2x, line2x * 10, 100, line2x * 2.5, 200, line2x * 2, height*2); //thicker top set

    	strokeWeight(1);
    	curve(line2x - 15, height, line2x * 10 + 20, 220, line2x/2, 50, line2x * 2, 0);

    	strokeWeight(.5);
    	curve(line2x/5, 0, -line2x, 0, line2x, 75, line2x + 50, 200); //diminishing bottom sets that overlap with red series and green fills

    	curve(line2x, -100, -line2x/5, 100, line2x*10, 0, line2x + 50, 200);
    }

    for(var line3x = 0; line3x < width; line3x += 20) { //linear series with larger increments of 20
    	stroke(255, 180, 10);
    	strokeWeight(1.5);
    	line(line3x, height +20, line3x*2.3, 200 - line3x/15); //evened out yellow lines on bottom of canvas

    	line(line3x, height+20, line3x*1.8, 180 - line3x/15);

    	line(line3x, height + 20, line3x * 2, 190 - line3x/ 15);

    	fill(200, 50, 0, 150);
    	ellipse(line3x*2, 190 - line3x/15, 10, 10); //ellipse series of red circles

    }
    for(var circle4 = 220; circle4 < width; circle4 += 30) { //ellipse series from right half of canvas to balance out exponential series of red circles
    	fill(200, 50, 0, 150);
    	ellipse(circle4, 190 - circle4/15, 10, 10);
    	ellipse(circle4, 210 - circle4/25, 10, 10);
    }
    for(var line4y = 0; line4y < height; line4y += 15) { //vertical curve series to balance out horizontal strokes
    	fill(200, 100, 10, 50); // orange color with 50 percent transparency
    	curve(width, line4y, 250, line4y, 100, line4y, 0, height - line4y);
    }
}

function draw() {
}

sunmink-Project04-string-Art

sketch

//Sun Min Kim 
//Section E
//sunmink@andrew.cmu.edu
//project04-stringart 

var x1 = 50; //x of line
var y1 = 0; //y of line 

function setup() {
    createCanvas(400, 300);
}

function draw() {
    background(190, 100, 120);

    var r = acos(height, width); //rotating angle 

    for (var i = 0; i <800; i +=30) {
    	strokeWeight(1); 
    	rotate(r); 

    	stroke(191, 61, 80); //top red line 
    	line(400 , i / 8, i / 6, 2); 

    	stroke(191, 20, 130); //left pink line 
    	line(0, i / 3, i, 200);

    	stroke(130, 100, 140);
    	line(x1 + 250, y1, i/2 -300, 400); //left purple line 

    	stroke(255); 
    	line(x1 + 340, y1, i/2 -100, 400); //right white line 

    	stroke(245);
    	line(x1 - 100, width/2  , i - 300, 300); //bottom grey line 


    }

}

For this project, I started off with simple straight lines because I was not sure how function for () is going to act on this problem. However, as I gained confidence in using for (), I could build more layers of strings step by step. It was very interesting to create curves without curve vertex function and I look forward to learning many other ways to build similar result.

jooheek -Project04-StringArt

sketch

//JooHee Kim
//Section E
//jooheek@andrew.cmu.edu
//Project-04

function setup() {
    createCanvas(400, 300);
}

function draw() {
	background(0);

	//color variables so that it can change to mouseX & Y
	var sRColor = mouseX;
	var sGColor = mouseY;
	var sBColor = 255;

	//x1,y1 is for the left 2 curves when mouse is at 0, 300
	var x1StepSize = 30;
	var y1StepSize = 20;
	
	//x2, y2 for stationary right 2 curves when mouse is at 0, 300
	var x2StepSize = 15;
	var y2StepSize = 25;

	//x&y position is the same for both curves
	var xposition = mouseX;
	var yposition = mouseY;

    for (var i = 0; i <= 30; i ++) {
    	//variables that constrain x1&y1 position to canvas size
    	var cx = constrain(xposition, 0, 400);
    	var cy = constrain(yposition, 0, 300);

    	strokeWeight(0.75);
    	stroke(sRColor, sGColor, sBColor);

    	//curve at top left corner when mouse is at 0, 300
    	//i*4/3 because height and width of canvas is different
    	line(cx, y1StepSize*i, x1StepSize*i*4/3, cy);

    	//curve at bottom left corner when mouse is at 0, 300
    	line(cx, height - y1StepSize*i, x1StepSize*i*4/3, height - cy);

    	//curve at top right corner when mouse is at 0, 300
    	stroke(sRColor - 100, sGColor - 100, sBColor-100);
    	line(x2StepSize*i*4/3, height - cy, width - cx, y2StepSize*i/2);

    	//curve at bottom right corner when mouse is at 0, 300
    	line(x2StepSize*i*4/3, cy, width - cx, height - y2StepSize*i/2);

    }


}

I started by creating a simple composition on Illustrator just to understand how the coordinates work in string art curves. From there, I decided on the intervals of the lines to have some variation in the curves. I also wanted it to make it interactive with the mouse, so I made x&y positions and the color of the lines to be dependent of the lines. Although the code for this project was fairly short and simple, I thought it was pretty complicated when I was trying to understand the concept.


Initial sketch on Illustrator

thlai-Project-04-String-Art

I don’t know if this is the way to do it, but I set the gradient background by basically using a ‘for’ loop of strings and changing the colors. Als0, when the drawing resets, I noticed a blink, but I have not been able to figure out how to get rid of that.

thlai-project-04

// Tiffany Lai
// 15-104, Section A
// thlai@andrew.cmu.edu
// Project 04 - String Art

var t;

function setup() {
    t =1;
	createCanvas(640, 480);
    strokeWeight(1/4);
    noFill();
    angleMode(DEGREES);
}


// when triangle rotates all the way, reset
function reset(t){
    if (t/100 > 2.4) {
        setup();
    }
}


function draw() {
    t++;

    // set gradient background
    for (var i=0; i < 1000; i++) {
        stroke(20+i/2, 80+i/4, 90+i/4);
        line(0, 0+i, width, 0+i,);
    }
    
    // make 99 "strings"
    var num = 55;
    for (var i = 0; i < num; i++){
        // gradient stroke color
        stroke(i*5, i*7, i*11);

        var x1 = 0;
        var y1 = i*height/num;
        var x2 = i*width/num;
        var y2 = height;

        // draw strings
        line(x1, y1, x2, y2); // bottom left
        line(x2, 0, x1, height-y1); // top left
        line(width, height-y1, x2, y2); // bottom
        line(x2, 0, width, y1); // top right
    }

    push();

        var x1 = 0;
        var y1 = -138;
        var x2 = -120;
        var y2 = 70;
        var x3 = 120;
        var y3 = 70;

        var fade = 100;
        fade = 255 - t;
        stroke(255, 255, 255, fade); // triangle fades
        translate(width/2, height/2);
        triangle(x1, y1, x2, y2, x3, y3);

    for (var i = 0; i < 50; i++){ // center triangle
        rotate((t/100));
        triangle(x1, y1, x2, y2, x3, y3);
    }
    pop();

    print(t/100);
    reset(t);

}