Tyler Hobbs is a generative artist from Austin, Texas. Tyler writes a custom computer program specially designed to create an abstract image for each work. His work focuses on the interplay of randomness and order, and draws inspiration from paint, vegetation, and naturally occurring patterns. For Continuity series begins by generating semi-random quadrilaterals. Intersections between quadrilaterals become negative space. The positive space builds up in iterative layers. Proximity to an attractor point controls the transparency, brightness, and sharpness of the positive space. The generative aspect (pseudo randomness) is interesting to see as Hobbs allows the shapes to become harmonious as they relate arbitrarily, yet in a fully controlled way. Because chance provides a good foundation to the structure of these works, they can generate an entire series of images. Each work could be completely different from previous instances, providing an element of freshness and surprise.
Category: Section A
ljkim looking outward 06
“Letter Field” by Judson Rosebush
This piece is called “Letter Field” by Judson Rosebush. I really appreciate this piece because it uses a software to generate the art. Meanwhile, I feel like it follows communication design guidelines. I’m assuming that this piece had to be generated several times in order for one to look like an actual piece of designed work. It works by through a database of the Souvenir font; random number generation, a statistical basis to determine letter size, color, and position; and a hidden line algorithm all combine to calculate this scan line raster image. I believe that the letters are randomly generated and also with the size and color.
mjnewman Project-06, Section A
var canvasWidth = 240;
var canvasHeight = 480;
function setup() {
createCanvas(canvasWidth, canvasHeight);
}
function draw() {
//movement of minute, second, and hour ellipses
var sec = map(second(), 0, 59, 10, height - 10);
var min = map(minute(), 0, 59, 30, width - 30);
var hr = map(hour(), 0, 23, 50, height - 50);
//adding hour variable so that there is a dynamic background
background(20, 30, hr/6);
noStroke();
//hour cirlce moves up and down the canvas, color also changes depending on the hour
fill(40, 160, hr/2);
//largest circle
ellipse(width/4, hr, 100, 100);
//minutes circle moves across the canvas, color changes depending on minute
fill(130, 209, min);
//middle sized circle
ellipse(min, height * 0.75, 60, 60);
//seconds circle moves down the canvas, color changes depends on the second
fill(200, sec/2, 90);
//smallest circle
ellipse(width / 2, sec, 20, 20);
}
For my initial idea, I wanted to mimic how the interaction of asteroids and planets in our solar system. I wanted to illustrate how asteroids get uncomfortably close to these planets, hence the distance between the second and hour circles. There have been many documented close calls that are visible on Youtube.
In terms of colors, I wanted to mimic the impact that asteroids experience when the enter the atmosphere, hence the changing of color from pink to yellow. The rest of the circles change color in order to have a dynamic clock. The background will stay relatively dark to mimic the color of “space.”
mmiller5-Looking Outwards-06
Performance of John Cage’s “Inlets”
“Inlets” is a non-deterministic chance composition composed by John Cage in 1977. In it, there are three players who hold conch shells of varying sizes filled with water. By tipping the shells back and forth, it is possible to form bubbles that make a gurgling sound; however, the formation of bubbles is random, causing the piece to be non-deterministic and chance based. To remove the preferences of the players from the performance, John Cage utilized the novelty of conch shells as an instrument (something the players would have minimal preferences with), helping to ensure that the composition would be more contained and chance based. I admire John Cage’s re-envisioning of music, that it doesn’t have to be fixed each time that it’s played. Following the same algorithm for production leads to performances that have the same essence but different products, which I find to be really neat.
mmirho – Looking Outwards – Random
There wasn’t much on the internet about this image, it was simply referenced in a few places as being random art, but it really stuck out to me.
I could have created this myself, it’s simply a circle spread across three rings, with color changing slightly each ring. Then, the ring set is spanned across a random pattern, yet even with such simple rules, the result is incredibly satisfying.
There was no found author, and it’s likely a student like myself made it.
I’m inspired by this to try random stuff with JavaScript, to make up a set of simple rules and let the computation do the rest. If something even remotely as intricate as this results, I’ll be beyond happy.
I think the appealing part of the image is not only the beautiful color variation but the blur of circles. At first glance, you appear to be able to discern the location of every ring and see the full structure of every circle. However, if you start to push your vision back, everything becomes indiscernible. It feels good to look at, and the code behind it is very simple.
mmirho – Project 6 – Blood clock
The goal of this was to create something ominous, slightly spooky, but very easy to tell the general time of day.
I really enjoyed how satisfying the millisecond smooth movement was, so it made sense to make it relate to some liquid.
var prevSec;
var millisRolloverTime;
function setup() {
createCanvas(480, 480);
millisRolloverTime = 0;
}
function draw() {
background(240);
// Fetch the current time
var H = hour();
var M = minute();
var S = second();
// Reckon the current millisecond,
// particularly if the second has rolled over.
// Note that this is more correct than using millis()%1000;
if (prevSec != S) {
millisRolloverTime = millis();
}
prevSec = S;
var mils = floor(millis() - millisRolloverTime);
//fill(128,100,100);
//text("Hour: " + H, 10, 22);
//text("Minute: " + M, 10, 42);
//text("Second: " + S, 10, 62);
//text("Millis: " + mils, 10, 82);
var hourBarWidth = map(H, 0, 23, 0, width-75);
var minuteBarWidth = map(M, 0, 59, 0, width-75);
var secondBarWidth = map(S, 0, 59, 0, width-75);
// Make a bar which *smoothly* interpolates across 1 minute.
// We calculate a version that goes from 0...60,
// but with a fractional remainder:
var secondsWithFraction = S + (mils / 1000.0);
var secondsWithNoFraction = S;
var secondBarWidthChunky = map(secondsWithNoFraction, 0, 60, 0, height-75);
var secondBarWidthSmooth = map(secondsWithFraction, 0, 60, 0, height-75);
noStroke();
fill(140, 0, 0);
//This block makes the red pool at the top
//And connects it smoothly to the drips
fill(140, 0, 0);
rect(0,0,width,100);
fill(240);
ellipse(230,105,182,60);
ellipse(414,105,160,60);
ellipse(95, 105, 62, 30);
ellipse(0, 105, 100, 50);
fill(140, 0, 0);
rect(50, 75, 15, hourBarWidth);
ellipse(57.5, hourBarWidth + 75, 15, 35);
//Far left, slowest blood drip
rect(125, 75, 15, minuteBarWidth);
ellipse(132.5, minuteBarWidth + 75, 15, 35);
//Middle, slow blood drip
rect(320, 75, 15, secondBarWidthSmooth);
ellipse(327.5, secondBarWidthSmooth + 75, 15, 35);
//Far right, fastest drip
text("H", 50, height-10);
text("M", 125, height-10);
text("S", 320, height-10);
//Labels the bloog drips
}
monicah1-lookingoutward-06
Nothing There by Brendan Dawes, 2004
Nothing There is a computational work made from the soundtrack within the movie, The Man Who Wasn’t There. In the piece, each element is dictate by the amount of sound present during that movie frame. The piece is a representation of silences and pauses within the film.
I is interested in the seemingly not organized, randomness, of this piece, is actually generated from a specific movie and specific timing within the movie. It is powerful to concise a movie silences and pauses frames visually in one piece. The black and white color choice add into to topic of silence. Looking at each element closely and standing back and look them as one piece of work, I do feel the pauses and silences that the Dawes want to represent. It is interest to see the precise informations generating the sense of randomness in the piece.
hdw – Project 6 – Abstract Clock
//Helen Wu
//hdw@andrew.cmu.edu
//Project 6
//Section A
function setup() {
createCanvas(480, 480);
angleMode(DEGREES);
}
function draw() {
var rSpring = 180
var gSpring = 299
var bSpring = 123
var rSummer = 255
var gSummer = 224
var bSummer = 114
var rFall = 255
var gFall = 191
var bFall = 135
var rWinter = 255
var gWinter = 107
var bWinter = 107
var season = month()
//set colors of tree outline to month
if (season == 3 || 4 || 5){
var r = rSpring;
var g = gSpring;
var b = bSpring;
}
if (season == 6 || 7 || 8){
var r = rSummer;
var g = gSummer;
var b = bSummer;
}
if (season == 9 || 10 || 11){
var r = rFall;
var g = gFall;
var b = bFall;
}
if (season == 12 || 1 || 2){
var r = rWinter;
var g = gWinter;
var b = bWinter;
}
//background changes with respect to hour.
//from = color(206, 242, 255), to = color(255, 198, 220)
var proportion = hour()/60;
background(206+49*proportion,242-44*proportion,255-35*proportion);
//draw trees
tree1(-35,115,200,r,g,b)
tree3(115,115,200,r,g,b)
tree2(-185,115,200,r,g,b)
tree2(265,115,200,r,g,b)
tree1(width-190,height-200,100,r,g,b);
tree2(width-340,height-200,100,r,g,b);
tree3(width-490,height-200,100,r,g,b);
}
//set strokeWeight 's'
var s = 3
//falling leaf pattern 1
function tree1(x,y,a,r,g,b) {
push();
translate(x,y);
//tree outline is mapped with respect to minutes.
strokeWeight(s);
var minutes = minute();
if ((minutes+3)%3==1){
noFill();
stroke(r, g, b);
//stroke(180,229,123)
} else {
noFill();
stroke(255,255,255);
}
ellipse(a,a-a*50/240, a*300/240, a*350/240);
//tree branches.
stroke(255, 255, 255);
strokeWeight(s)
line(a, a/3, a, a*400/240);
line(a, a*187/240, a+a/3, a*100/240);
line(a, a*294/240, a-a/3, a*200/240);
//falling leaves are drawn; color and position changes with seconds.
noStroke();
var seconds = second();
var r = a/5-a/24
//right side leaves
if ((seconds+4)%4==0){
fill(180, 229, 123);
arc(a+a/3, a*10/24, r, r, 240, 20);
}
if ((seconds+4)%4==1){
fill(255, 224, 114);
arc(a+a/3+a/24, a*200/240, r, r, 340, 120);
}
if ((seconds+4)%4==2){
fill(255, 191, 135);
arc(a+a/3-a/8, 5*a/4, r, r, 60, 200);
}
if ((seconds+4)%4==3){
fill(255, 107, 107);
arc(a+a/3, a*400/240, r, r, 340, 120);
}
//left side leaves
if ((seconds+3)%3==0){
fill(180, 229, 123);
arc(a-a/3, a*200/240, r, r, 160, 300);
}
if ((seconds+3)%3==1){
fill(255, 191, 135);
arc(a-a/3+a/8, a*300/240, r, r, 340, 120);
}
if ((seconds+3)%3==2){
fill(255, 107, 107);
arc(a-a/3-a/48, a*400/240, r, r, 340, 120);
}
pop();
}
//falling leaf pattern 2
function tree2(x,y,a,r,g,b) {
push();
translate(x,y);
//tree outline is colored with respect to minutes.
strokeWeight(s);
var minutes = minute();
if ((minutes+3)%3==2){
noFill();
stroke(r, g, b);
//stroke(180,229,123)
} else {
noFill();
stroke(255,255,255);
}
ellipse(a,a-a*50/240, a*300/240, a*350/240);
//tree branches.
stroke(255, 255, 255);
strokeWeight(s)
line(a, a/3, a, a*400/240);
line(a, a*187/240, a+a/3, a*100/240);
line(a, a*294/240, a-a/3, a*200/240);
//falling leaves are drawn; color and position changes with seconds.
noStroke();
var seconds = second();
var r = a/5-a/24
//right side leaves
if ((seconds+4)%4==1){
fill(180, 229, 123);
arc(a+a/3, a*10/24, r, r, 240, 20);
}
if ((seconds+4)%4==2){
fill(255, 224, 114);
arc(a+a/3+a/24, a*200/240, r, r, 340, 120);
}
if ((seconds+4)%4==3){
fill(255, 191, 135);
arc(a+a/3-a/8, 5*a/4, r, r, 60, 200);
}
if ((seconds+4)%4==0){
fill(255, 107, 107);
arc(a+a/3, a*400/240, r, r, 340, 120);
}
//left side leaves
if ((seconds+3)%3==1){
fill(180, 229, 123);
arc(a-a/3, a*200/240, r, r, 160, 300);
}
if ((seconds+3)%3==2){
fill(255, 191, 135);
arc(a-a/3+a/8, a*300/240, r, r, 340, 120);
}
if ((seconds+3)%3==0){
fill(255, 107, 107);
arc(a-a/3-a/48, a*400/240, r, r, 340, 120);
}
pop();
}
//falling leaf pattern 3
function tree3(x,y,a,r,g,b) {
push();
translate(x,y);
//tree outline is mapped with respect to minutes.
strokeWeight(s);
var minutes = minute();
if ((minutes+3)%3==0){
noFill();
stroke(r, g, b);
//stroke(180,229,123)
} else {
noFill();
stroke(255,255,255);
}
ellipse(a,a-a*50/240, a*300/240, a*350/240);
//tree branches.
stroke(255, 255, 255);
strokeWeight(s)
line(a, a/3, a, a*400/240);
line(a, a*187/240, a+a/3, a*100/240);
line(a, a*294/240, a-a/3, a*200/240);
//falling leaves are drawn; color and position changes with seconds.
noStroke();
var seconds = second();
var r = a/5-a/24
//right side leaves
if ((seconds+4)%4==2){
fill(180, 229, 123);
arc(a+a/3, a*10/24, r, r, 240, 20);
}
if ((seconds+4)%4==3){
fill(255, 224, 114);
arc(a+a/3+a/24, a*200/240, r, r, 340, 120);
}
if ((seconds+4)%4==0){
fill(255, 191, 135);
arc(a+a/3-a/8, 5*a/4, r, r, 60, 200);
}
if ((seconds+4)%4==1){
fill(255, 107, 107);
arc(a+a/3, a*400/240, r, r, 340, 120);
}
//left side leaves
if ((seconds+3)%3==2){
fill(180, 229, 123);
arc(a-a/3, a*200/240, r, r, 160, 300);
}
if ((seconds+3)%3==0){
fill(255, 191, 135);
arc(a-a/3+a/8, a*300/240, r, r, 340, 120);
}
if ((seconds+3)%3==1){
fill(255, 107, 107);
arc(a-a/3-a/48, a*400/240, r, r, 340, 120);
}
pop();
}
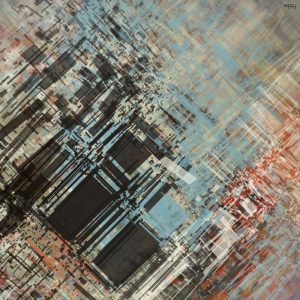
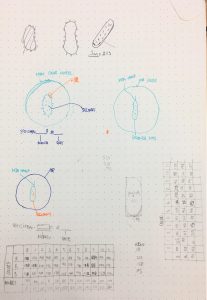
I chose to represent time with a forest. The leaves fall to seconds, the background color is mapped to hours of the day, and the tree outline rotates by minutes. The color of the trees correlate with seasons. At first I struggled with how to make this piece dynamic because my movement was very simple, so I created a recursion and repeated different tree patterns.
mmiller5-Project-06
//Michael Miller
//Section A
//mmiller5@andrew.cmu.edu
//Project-06
//Coordinates for pandas
var pandaX = [30, 90, 150, 210, 270, 330, 390, 450,
30, 90, 150, 210, 270, 330, 390, 450,
30, 90, 150, 210, 270, 330, 390, 450];
var pandaY = [298, 298, 298, 298, 298, 298, 298, 298,
455, 455, 455, 455, 455, 455, 455, 455,
200, 200, 200, 200, 200, 200, 200, 200];
function setup() {
createCanvas(480, 480);
frameRate(1);
noStroke();
}
function draw() {
//relates time to ratio of circular motion for sun and moon
var hourRat = ((hour() + (minute() / 60)) / 24) * 2 * PI;
var bambooX = [];
var bambooY = [];
//darkens during night, brightens during day
var bgCol = color(49, 49, constrain(160 + 120 * -cos(hourRat), 49, 200));
background(bgCol);
//sun
fill(255, 255, 0);
ellipse(width / 2 - sin(hourRat) * 200, height / 2 + cos(hourRat) * 200,
150, 150);
//moon
fill(230);
ellipse(width / 2 + sin(hourRat) * 200, height / 2 - cos(hourRat) * 200,
100, 100);
fill(bgCol);
ellipse(width / 2 + sin(hourRat + .2) * 200,
height / 2 - cos(hourRat + .2) * 200,
75, 75);
//midground
fill(116, 116, 55);
rect(0, 2 * height / 3 - 100, width, 2 * height / 3 - 100);
//foreground
fill(154, 116, 55);
rect(0, 2 * height / 3, width, 2 * height / 3);
//time tracking mechanics
bambooFall(width / 2, 2 * height / 3);
//every hour, a new panda comes to feast on the accumulated bamboo
for(var i = 0; i < hour(); i ++) {
panda(pandaX[i], pandaY[i]);
}
bambooGrow(width / 2, 2 * height / 3);
}
//central bamboo grows one stalk per second, making happy pandas
function bambooGrow(x, y) {
for(var sec = 0; sec < second(); sec ++) {
fill(120, 180, 56);
rect(x, y - 4 * sec, 3, 3);
fill(128, 75, 35);
rect(x, y - 4 * sec - 1, 3, 1);
}
}
//when bamboo gets too tall, it falls in a half circle, stacking up every minute
function bambooFall(x, y) {
for(var min = 0; min < minute(); min ++) {
fill(177, 200, 60);
push();
translate(x, y);
rotate(radians(2 + (min / 60) * 176));
rect(0, 0, 180, 3);
pop();
}
}
//panda and its body parts
function panda(x, y) {
pandaBody(x, y);
pandaHead(x, y - 40);
}
function pandaHead(x, y) {
fill(255);
ellipse(x, y, 50, 50);
fill(0);
ellipse(x - 20, y - 20, 15, 15);
ellipse(x + 20, y - 20, 15, 15);
ellipse(x - 10, y, 10, 10);
ellipse(x + 10, y, 10, 10);
ellipse(x, y + 7, 8, 6);
fill(255);
ellipse(x - 9, y - 1, 2, 4);
ellipse(x + 9, y - 1, 2, 4);
}
function pandaBody(x, y) {
fill(255);
ellipse(x, y, 55, 50);
fill(0);
ellipse(x - 18, y - 12, 20, 25);
ellipse(x + 18, y - 12, 20, 25);
ellipse(x - 19, y + 13, 25, 23);
ellipse(x + 19, y + 13, 25, 23);
}
Yep, more bamboo. Why? I was inspired by the exceptional speed at which bamboo grows, but then I thought, “Now what if it grew super fast?” The consequences of lightning bamboo are staggering — potential building material, fuel, and of course, food for pandas! Imagine an infinity ice cream dispenser, except that you never get full (or fat, we’ll ignore that too) — that’s exactly what this is for pandas! I think word of this would spread pretty quickly, but pandas are slow so they take a while to get there (1 hour exactly, actually. Punctual pandas).
Now I don’t actually do all that much art, so my product probably doesn’t look as amazing as it could — the pandas are a buncha colored circles — but I think it works. The coding was pretty fun for this project, and it took me some time to figure out how to make the time countable. I probably would’ve been more comfortable doing something more abstract, but I thought I’d give this a try, and I think it worked out in the end.
sntong-Project-06-Abstract-Clock
//Scarlet Tong
//sntong@andrew.cmu.edu
//Section A
// Project 06 - Abstract Clock
// center of the bacteria
var cx = 240;
var cy = 220;
//radius of the moving "dial" around the color ring
var dotR = 4;
// arrays used for color assignment for each hour on the color ring
var R = [234,225,141,115,242,225,214,238,243,42,98,125];
var G = [218,160,213,100,214,152,88,51,121,165,114,198];
var B = [133,60,230,115,185,146,128,85,105,141,100,127];
// angles used to divide the ring into 12 segements
var angles = [0,30,60,90,120,150,180,210,240,270,300,330];
var nVals = angles.length;
function setup() {
createCanvas(480, 480);
background(0);
}
function draw() {
background(0);
var Min = minute();
// white petri dish background for the bacteria
fill(255);
ellipse(cx,cy,350,350);
// drawing the color rings that will indicate hour
for (var i = 0; i < nVals; i++) {
stroke(R[i],G[i],B[i]);
strokeWeight(10);
strokeCap(SQUARE);
arc(cx,cy,350,350,angles[i]-105,angles[i+1]-105);
push();
translate(240,220);
rotate(-90);
var eX = cos(angles[i])*170;
var eY = sin(angles[i])*170;
ellipse(eX,eY,10,10);
pop();
}
// make bacteria rotate each minute
push();
translate(cx,cy);
angleMode(DEGREES);
var mappedMin = map(Min,0,60,0,360);
rotate(mappedMin);
bacteria();
pop();
// isolate the "seconds" dot and the text from other fill and stroke statements above
push();
dot();
textAlign(CENTER);
text("Specimen : #",190,430);
text(month(),240, 430);
text("-" , 260,430);
text(day(), 270,430);
text("-", 280,430);
text(year()-2000,295,430);
pop();
}
//bacteria at the middle of the petri dish
function bacteria(){
var H = hour();
// introduce some jitter because bacteria are always moving
var jitterX = random(-.8,.8);
var jitterY = random (-.7,.7);
// body of the bacteria
rectMode(CENTER);
strokeWeight(5);
stroke(0);
strokeCap(ROUND);
// because the color ring only has 12 colors, the hour() value must be converted to within 12 hrs.
if (H <= 12) {
Hr = hour();
} if(H > 12) {
Hr = hour()-12;
}
// the color assignment corresponds to the color ring and hour it indicates
fill(R[Hr],G[Hr],B[Hr],200);
rect(0+jitterX,0+jitterY,50,150,25);
// little legs around the bacteria
line(0,-75,0+jitterX,-110); // minute hand for time
line(-10,73+jitterY,-13,80);
line(10+jitterX,73,13,85+jitterY);
line(-25+jitterX,50,-35+jitterX,50);
line(-25,-60+jitterY,-30+jitterX,-65);
line(-18,-70+jitterY,-26,-80);
line(18+jitterX,-70,20+jitterX,-73);
line(25,-30+jitterY,30,-30);
line(25,-40,34,-40+jitterY);
// little dots inside the bacterias, the guts
noStroke();
fill(0);
ellipse(10+jitterX,10+jitterY,dotR,dotR);
ellipse(-10+jitterX,-40+jitterY,dotR,dotR);
ellipse(5+jitterX,-30+jitterY,dotR,dotR);
ellipse(-10+jitterX,40+jitterY,dotR,dotR);
ellipse(5+jitterX,55+jitterY,dotR,dotR);
ellipse(-5+jitterX,30+jitterY,dotR,dotR);
ellipse(5+jitterX,-20+jitterY,dotR,dotR);
ellipse(-6+jitterX,13+jitterY,dotR,dotR);
}
// small dot that act as the "dial" for a microscope
// moves along the ring per second
function dot(){
var Sec = second();
var mappedSec = map(Sec, 0,60, 0,360)-90;
var x = cos(mappedSec)*150;
var y = sin(mappedSec)*150;
fill(200);
noStroke();
ellipse(cx+x,cy+y,10,10);
}
For this assignment I imagined as if we are viewing into a microscope to see a small bacteria that is moving around in the petri dish. The longest “leg” on the bacteria is the minute hand. The bacteria changes color according to the hour color that is found on the color ring. The specimen name is the listed as month/date/year, which completes this “clock”. I took a long time to figure out the small adjustments for each element to work together (i.e those extra 90 degree changes and shifting) and align in color, but small sketches and tables help me organize the data before I input them to arrays.