BrandonHyun-LookingOutwards-07

“Musical Buoy in Search Towards a New Shore” (2009), All images courtesy of Nathalie Miebach
The musical score for “Hurricane Noel.”All images courtesy of Nathalie Miebach

Nathalie Miebach is an artist who turns Weather Data into physical artwork just like this “Musical Buoy in Search Towards a New Shore” sculpture and the “Hurricane Noel” musical scores.

Ordinary people would never interpret weather data such as Nathalie Miebach and I find this quite fascinating because this is bringing Art, Music, Science, and Math together as one entity. This artifact could exist in an art gallery, in a science lab, and in a concert hall because these artifacts that she creates fit into these areas of study. Her work is very detailed and accurate that scientists can interpret the data just with the sculpture. The relationship between all the realms of the academic field of art and visuals is so interesting to me and I hope I can tie different academics together with my practice. When she is creating these artworks, she analyzes the weather data and assigns certain patterns of weather with color and objects in the case of her sculptures.

Nathalie Miebach’s Website


rgroves – Looking Outwards-07

History of the World in 100 Seconds is a video by Gareth Lloyd and Tom Martin that uses data from 14,238 Wikipedia Articles. They pulled out every geotagged article and every reference to an event and cross referenced them to find every events with a corresponding location. In the video, a dot appears corresponding to all 14,238 events chronologically and according to location. At the end, the dots start appearing more and more rapidly like fireworks, and a recognizable map of the world as we know it materializes. The dots also start to resemble how cities look from above as they become more and more clustered. I admire this project both because of how they represented the information graphically, but also for the sheer volume of data they were able to analyze and represent.


https://vimeo.com/19088241

atraylor – Project 07 – Section B

sketch

// atraylor@andrew.cmu.edu
//Project 07
// Section B


var a = 0;


function setup() {
    createCanvas(400, 480);
    noStroke();
}

function draw() {
    background(171, 163, 247);
    scribble();
}

function scribble(i, a, rad2, x, y) { // make the curve
    a = map(mouseX, 0, width, 10, 110); // number of lines in curve by mouse position
    var rad2 = 40; // staring radius

    beginShape();
    fill(203, 90, 243, 10);
    stroke(151, 227, 245);
    translate(width/2, height/2); //center
    for(var i = 0; i < a; i++) {
        var theta = map(i, 0, a/80, 0, TWO_PI); // apply values of i to radians in circle
        var x = rad2 * cos(theta); // x position of vertex
        var y = rad2 * sin(theta); // y position of vertex
        vertex(x, y);
        rad2 *= 1.02; // this makes it a spiral rather than a circle.
    endShape();
    }
}

For this project I used a parametric version of the logarithmic spiral to draw my curves. I played with it so the function would draw various shapes rather than simply growing a spiral when segments were added. There are several areas where you can see the near perfect spiral, and others where it’s simply a mess of lines. Its interesting to see the shapes that are spirals but have clear sides so they form stars, triangles, or pentagons. I added a fill to the curve with an alpha channel to emphasize the growth and change of the shape.

kyungak-lookingoutwards-07

(Simon Russell, Audio Geometry: Circles Within Circles, 2016)

Simon Russell is an artist that explores the relationship between sound and shape. He utilizes the program “Houdini” to create and earn audio files produced by collusions of f-curves. Most sounds are created through 3D geometric shapes, and their heights differentiate the pitch of the sounds. After sounds are created in Houdini, they are then exported to Cinema 4D. Additional geometric shapes are rendered afterwards to create visuals that go with the sounds. This project is fascinating because the sound files and the geometric shapes are original. The sound comes from randomly colliding set of geometric shapes, and the sound in return produces a new representing set of geometric shapes. The give and take relationship of these factors seemed very new and interesting to me. The visuals were also very aesthetically pleasing, which is also a plus in terms of artistic sensibilities.

Project-07 Composition with Curves

//Yoonseo(Dave) Choi
//Section B
//yoonseo1@andrew.cmu.edu
//Project 07
var npoints =100; //points for generating curve
function setup() {
    createCanvas(480,480); //canvas size of 480 by 480
    angleMode(DEGREES); //set radian to degree

}

function draw() {
    background(0);//set background to black
    stroke(255); //curve colro tobe white 
    var mx = constrain(mouseX,30,width-30); // return mousex value within constrain
    var my = constrain(mouseY,30,height-30); //return mousey value within constrain
    noFill(); //no fill on geometry
    heart(mx,my); // execute heart function wiggly heart
    heart2(mx,my); //execute heart2 function line following mouse
    nails(mx,my);
}
function heart(rn1,rn2){ //for getting parameter for x,y mouse 
    strokeWeight(0.5); //set stroke size to 0.5
    push() 
    beginShape();
    translate(width/2,height/2) // make it center at middle 
    for (var i =0; i <npoints;i++) { // for loop for creating geometry
    var t = map (i,0,npoints,0,360); // map t value to degree
    var x = 16*sin(t)*sin(t)*sin(t); // x function from the mathworld wolf cam
    var y = 13*cos(t)-5*cos(2*t)-2*cos(3*t)-cos(4*t); //y function from mathworld wolf cam 
    vertex(x*rn1/40+(rn1/50*random(-0.5,0.5)),-y*rn2/40+(rn2/50*random(-0.5,0.5))); //create heart shape with wiggle 
    //as mouse move wiggle gets small or big
    }
    endShape(CLOSE); //end the geomtry
    pop();
}
function heart2(rn1,rn2){
    strokeWeight(0.5);//set stroke size to 0.5
    push();
    
    for (var i =0; i <npoints;i++) { // for generating geometry
    var t = map (i,0,npoints,0,360); // t value to degree
    var c = color (150,0,0); // color to red 
    stroke(c); // set stroke color to red
    var x = 16*sin(t)*sin(t)*sin(t); // heart x
    var y = 13*cos(t)-5*cos(2*t)-2*cos(3*t)-cos(4*t);//heart y 
    line(rn1,rn2,x*rn1/60+width/2,-y*rn2/60+height/2); //create line from heart to mouse position
}
    pop();
}
function nails(rn1,rn2){
    stroke(255,81,51,500-(rn1+rn2)/2) //color alpha change based on the mosue
    strokeWeight(0.4);  //stroke weight 

    push(); 
    beginShape();
    translate(width/2,height/2);
    for (var i =0; i <npoints; i++){
    var t = map (i,0,npoints,0,360); //mapping to dgrees 
    var r = map((rn2+rn1),0,(height+width),0,100); // mapping radius to max 100 based on mouse
    var x = r*cos(t); // circle x
    var y = r*sin(t); //circle y 
    vertex(x*rn1/200,y*rn2/200);//outer line for the vertex
    vertex(x*rn1/150,y*rn2/150);//inner circle for connecting 
  }
    endShape(CLOSE); //close the geometry 
    pop();
}

While I was searching for which curve to play with, I found heart shaped curve. I wanted to express emotion that I was having when the idea came up. I wanted the heart to give unstable look with directional element. At the same time, I look for other curve that could be used to show nail. I wanted to illustrate nails in the heart when heart is small but as it grow, nail starts to disappear. I have used r cos(theta) and r sin(theta) to generate the circular curve that will be used to represent the nail. To show the instability of the heart I used the wiggling motion, and I have used line to move along with the mouse coordinate to show dynamic direction that heart can point to.

Lookingoutwards -07

This is a project from Stamen. Name of the project is Facebook Flowers. The projects starts with George Takei sharing a picture on Facebook. After the initial share, shares that followed generates thread that continues as more shares occur. In the process, popular people are revealed as branching-off points of their own, and the process begins again. It is named flower because the visualization of data resembles the organism.

This project is particularly admiring on a fact that it converted the data that could be represented boring to interesting representation. It was always an interesting idea to record or see how fast and wide can social media spread information abroad. This project proves that social media is one of the fastest way to spread any thing to variety of people.

More dramatic case of sharing

jiaxinw-Project-07-Curves

sketch

var mouse_x;

function setup() {
    createCanvas(480, 480);
}

function draw() {
    background(50);
    var x;
    var y;

    // limit the mouseX only works in canvas
    if(mouseX<width & mouseX >0){
        mouse_x = mouseX;
    } else if (mouseX<=0){
        mouse_x = 0;
    } else{
        mouse_x = width;
    }

    // http://mathworld.wolfram.com/Deltoid.html 
    // mapping the b from 0 to 480 into from 0 to 30,
    // and since b is the radius of the small circle, make it relate to
    //mouse X can change the scale of the curves. 
    var b = map(mouse_x, 0, width, 0, 30);

    for (var i = 1; i <= 20; i++) {
        push();
        //put the whole thing in the center of the canvas and make it shake
        translate(width/2+random(-5,5), height/2+random(-5,5));
        //change mouseX also affect the rotation of the shapes 
        var rotateAng = map(mouse_x, 0, width, 0, TWO_PI)
        //make the rotation more obvious
        rotate(rotateAng + i*3);
        //make the stroke weight become less according to the number of shape
        strokeWeight(8/i);
        noFill();
        //make the stroke color of circles randomlmy change
        stroke(random(20,100),random(10,130),random(50,100)
            ,400/i);
        ellipse(0,0,6*i*b,6*i*b);
        //call the function to draw curves
        DrawCurves(i * b);
        pop();
    }
}

function DrawCurves(R) {
    //map the color change into a range as the mouseX is changing
    var red = map(mouse_x, 0, width, 10, 20);
    var green = map(mouse_x, 0, width, 10, 15);
    var blue = map(mouse_x, 0, width, 10, 20);

    fill(red*random(4, 7), green*random(11,12),blue*random(6,15));
    //draw curves according to the parametric equations
    for (var i = 0; i < 360; i++) {
        var t = radians(i);
        x = 2 * R * cos(t) + R * cos(2 * t);
        y = 2 * R * sin(t) - R * sin(2 * t);
        beginShape(POINTS);
        vertex(x, y);
        endShape();
    }
}

First, I went through the curves and picked out Deltoid (http://mathworld.wolfram.com/Deltoid.html) one to play around.

After I successfully drew our the curve in a static way, I thought about how to make it look more interesting. I tried to draw multiple curves in different scales but found that if they are in the same direction, it looked boring. So I tried to make them rotate and point to different directions. Next step, I used mouseX to control the rotation. And I thought if the scale of the curves can also be changed, it would be interesting! After this was done, I figured out I could also play around with the stroke weight to make curves look different and also colours!

I am glad that I finally got an interesting interactive result 🙂


jiaxinw-LookingOutwards 07

Shipmap.org
by Kiln

Shipmap.org shows commercial shipping movements based on hundreds of millions of data points from throughout 2012. It was created by created by Kiln based on data from the UCL Energy Institute (UCL EI). UCL EI took data showing location and speed of ships and cross-checked it with another database to get the vessel characteristics. With this information, they were able to compute the CO2 emissions for each observed hour, following the approach laid out in the Third IMO Greenhouse Gas Study 2014. The designer took the resulting dataset and visualized it with WebGL on top of a specially created base map. The most impressive thing about this website is that it shows a high level of interaction with datas — such as you can select different time, ship categories and zoom in or out — and at the same time the map maintains the elegant visual appearance by using simple colors and movements.

For more information, please go to https://www.shipmap.org/

Jonathan Perez Project 6

sketch

//Jonathan Perez
//Section B
//jdperez@andrew.cmu.edu
//Project-6


function setup() {
    createCanvas(480, 480);
    background(255);
}

function draw() {
    var y1 =-50
    var y2 = -200
    var dy1 = random(-1, 1);
    var dy2 = random(-1, 1);
    var irisColor = 0 //lower bound on random greyscale for second hand
    var irisColor2 = 10 //upper bound on random greyscale for second hand
    var irisFill; // iris coloring
    var brightCap; // max greyscale value iris color can be

    //iris darkness caps
    if(hour() >= 0 & hour() < 7) { //almost black at night-time
        brightCap = 100
    } else if(hour() >= 7 && hour() < 8) { //light grey during sunrise
        brightCap = 200
    } else if(hour() >= 8 && hour() < 19) { //light grey to white during the day
        brightCap = 300
    } else if (hour() >= 19 && hour() < 20) { //same as sunrise
        brightCap = 200
    } else { //same as night-time
        brightCap = 100
    }

    push();
    translate(width/2, height/2);


    push();
    rotate(minute() * TWO_PI/60);
    stroke(0);
    strokeWeight(1);
    line(0, 0, 0, -height); //minute hands
    pop();

    //pupil detail
    push();
    if(hour() <= 12) {
        rotate(hour() * TWO_PI/12);
    } else {
        rotate(hour() * TWO_PI/12 + TWO_PI/24); //offsets to continue creating more vertices
    } 
    stroke(0);
    fill(0);
    rect(-30, -30, 60, 60); //stacked squares to create a star-pupil shape
    pop();


    //iris detail
    push();
    rotate(millis() * TWO_PI/60000);
    for(i = 0; i < 80; i++) {
    if(irisColor2 < brightCap) { 
        irisColor += 3.5
        irisColor2 += 3.5
    }
    irisFill = random(irisColor, irisColor2);
    strokeWeight(2);
    fill(irisFill);
    point(0, y1); //inner detail
    point(0, y2); //outer detail
    if(y1 + dy1 < -120) {
        dy1 = random(1.5); //max range is 120
    } else if(y1 + dy1 > 0) {
        dy1 = random(-1.5);
    }
    if(y2 + dy2 < -200) { //max range is 200
        dy2 = random(1.5);
    } else if(y2 + dy2 > -100) {
        dy2 = random(-1.5);
    }
    y2 += dy2;
    y1 += dy1


    }

    pop();
}

For this project, I wanted to mimic the circular shape of the traditional clock in something organic. Incidentally, while playing around with some random behavior, I stumbled across the human eye as inspiration.

This project feels pretty incomplete, and I would like to implement some changes relating color to time. For instance, perhaps the color of the iris could mimic the color of the sunset or something.

Nayeon-Project06-Abstract Clock

nayeonk1

//Na-yeon Kim
//15-104, B section
//nayeonk1@andrew.cmu.edu
//Project-06 (Abstract clock)


var x = [];
var y = [];

function setup() {
    createCanvas(400, 480);
    frameRate(15);
    angleMode(DEGREES);
}

function draw() {
    background(20, 40, 60);
    noStroke();

//variables for times
    var H = hour();
    var M = minute();
    var S = second();

    var mappedH = map(H, 0, 23, 120, 300);
    var mappedS = map(S, 0, 59, 0, 30);

//small stars
    fill(250);
    for (var i = 0; i < x.length; i++) {
        var ex = x[i];
        var ey = y[i];
        ellipse(ex, ey, 5, 5);
    }

//wall
    fill(80, 65, 30)
    rect(0, 350, width, 130)

//moon
    fill(250, 255, 90)
    ellipse(120, 80, 100, 100);

//moon eclipse by hours
    fill(10, 30, 50);
    ellipse(mappedH, 80, 100, 100)

//star
    fill(230, 230, 30);
    var a = [250, 260, 280, 270, 270, 250, 230, 230, 217, 240];
    var b = [138, 157, 163, 180, 202, 193, 202, 180, 163, 157];
    var nPoints = a.length;

    beginShape();
    for (var i = 0; i < nPoints; i++) {
        var px = a[i] + random(-1, 1);
        var py = b[i] + random(-1, 1);
        //star goes down by minutes
        vertex(px, py + M);
    }
    endShape(CLOSE);

//window
    push();
    strokeWeight(50);
    stroke(0, 115, 130);
    noFill();
    rect(0, -25, width, 350)
    pop();

//table
    fill(80, 28, 10);
    arc(370, 440, 400, 150, 0, 180, CHORD);
    fill(150, 78, 60);
    ellipse(370, 440, 400, 100);

//ashtray shadow
    push();
    rotate(5);
    translate(300, 420)
    fill(80, 28, 10);
    ellipse(0, 0, 130, 50)
    pop();

//ashtray
    fill(80, 100, 100)
    arc(250, 430, 100, 30, 0, 180, CHORD)
    rect(200, 410, 100, 20)
    fill(100, 120, 120);
    ellipse(250, 410, 100, 20)
    fill(50, 60, 60);
    ellipse(250, 410, 80, 10)

//cigarretts
    push();
    rotate(20);
    translate(310, 300)
    fill(230, 230, 230);
    rect(0, 0, 50, 10);
    fill(200, 200, 50);
    rect(30, 0, 20, 10);

//cigarrett smoked by seconds
    fill(0);
    rect(0, 0, mappedS, 10)
    fill(250, 20, 20);
    rect(mappedS, 0, 2, 10);
    pop();

//smokes come up by seconds
    fill(250, 250 - 7 * S);
    ellipse(170, 370 - S, mappedS + 10, mappedS + 15)
    ellipse(190, 390 - S * 1.5, mappedS + 15, mappedS + 10)
    ellipse(180, 375 - S, mappedS, mappedS)
    ellipse(200, 380 - S * 3, mappedS + 10, mappedS)
    ellipse(200, 385 - S * 2, mappedS + 10, mappedS + 10)
    ellipse(190, 383 - S * 3.5, mappedS + 30, mappedS + 30)

//flower pot
    fill(120, 50, 10)
    quad(50, 250, 150, 250, 130, 300, 70, 300)
    rect(45, 230, 110, 30)

//flower patel shows up every 5 min
    push();
    fill(230, 100, 100)
    translate(100, 180)
    var i = (M - (M % 10))/5;
    for (var f = 0; f < i + 1; f++) {
      ellipse(0, -20, 10, 30);
      rotate(30);
    }
    pop();

//hours text
    fill(240);
    text("hour : " + H, 30, 400);
    text("Minute : " + M, 30, 420);
    text("Second : " + S, 30, 440);
}

//small stars show up when click
function mousePressed() {
  x.push(mouseX);
  y.push(mouseY);
}

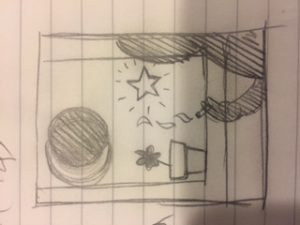
My favorite time of the day is smoking at very late night while watching stars and moon. During the day, it’s too busy to feel the time. But night, every smokes from cigarett tells me of every moment of time.