afukuda-LookingOutwards-08


Eyeo 2015 – Theo Watson & Nick Hardeman

Theodore Watson and Nick Hardeman are the key figures of the creative studio Design IO LLC (based in Cambridge, Massachusetts), specializing in the design and development of innovative, interactive installations. Watson – the Creative Director w/ a BFA Design & Technology from Parsons School of Design – is an artist, designer and experimenter whose work strives to invite people to play. Hardeman – Minister of Interactive Art – is a new media artist, designer and experimenter who enjoys combining traditional means of art medium with emerging technologies.

The studio blends design and technology, creating innovative, interactive installations and galleries for the people to enjoy. I admire their progressive mindset; applying current technological capabilities into traditional means of art. Growing up, interactive installations were not common (if they even existed); yet in today’s museum galleries – especially the children section – there are so many variety of interactive installations. I think this fosters the children’s growth more and that is why I admire how Design IO has contributed so many of these installations. Out of all their work, the Living Library my favorite project. Growing up I always enjoyed the interactive books like Eric Carl; it engages children more. And I think that the Living Library pushes this concept effectively through the use of technology.

Their presentation skill is pretty orthodox; they begin with introduction of the speakers, and they transitioned to the precedent which inspired the project they are talking about. Their presentation organization was very basic yet appreciated for its logical flow and simplicity.


Video showcasing Living Library project by Design IO (favorite work by them)

Link | http://design-io.com/ – Design IO website
http://design-io.com/projects/LivingLibrary/ – Living Library project page

Project-07 Curve Thomas Wrabetz

sketch

//Thomas Wrabetz
//Section C
//twrabetz@andrew.cmu.edu
//Project-07

var CVAR = 45;
var prevX = 100;
var prevY = 100;

function cubic( x )
{
   return ( x - mouseX / 25 ) * ( x + mouseY / 25 ) * ( x + ( mouseX - width / 2 ) / 25 + ( mouseY - height / 2 ) / 25);
}

function setup()
{
    createCanvas( 480, 480 );
    noStroke();
}

function draw()
{
    
    if( prevX == mouseX & prevY == mouseY ) return;
    background(220);
    prevX = mouseX;
    prevY = mouseY;
    circX = width / 3 + mouseX / 3;
    circY = height / 3 - mouseY / 5;
    fill(255);
    for( var i2 = 0; i2 < 480; i2 += random(10,14) )
    {
        i = i2;
        for( var j = 0; j < 480; j += random(10,14) )
        {
            if( j < (height / 2) - cubic( (i - 240)/10 ) / 100 ) fill( random(0,CVAR), 100 + random(0,CVAR), 175 + random(0,CVAR) );
            else fill( random(0,CVAR), 150 + random(0,CVAR), random(0,CVAR) );
            if( ( j - circY ) * ( j - circY ) + ( i - circX ) * ( i - circX ) < 1250 ) fill( 175 + random( 0, CVAR ), 175 + random( 0, CVAR ), random(0, CVAR) );
            
            ellipse( i, j, 18, 21 );
            i = random( i2-2, i2+2 );
        }
    }
}

I used a cubic function to make a hill. The sun is also there.

I used a grid of points with small random offsets and determined their color based on their relation to the equation; their color also varies slightly to create a pointillism-like effect.

aerubin-Project-06-Curves

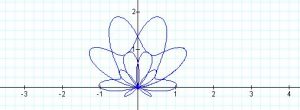
For this project, I was inspired by the polar curves we learned in calculus. I remember drawing them on the graphing calculator and adding them together to make cool designs. This polar curve reminds me of part of a flower, so I rotated it around itself to create one. The flower grows when the mouse is moved from left to right, and the number of petals change when the mouse is moved from top to bottom. In addition, I also added a bee that bounces around to establish the flower design. The bee can also be hidden behind the flower if the mouse is far enough to the right.


Equation to the polar curve pictured above and utilized to make the petals for the flower.

sketch

//Angela Rubin
//Section C
//aerubin@andrew.cmu.edu
//Project-07-Curves

var turn = 0;
var beeX = 200; //x position of bee
var beeY = 200; //y position of bee
var xvel = 0;
var yvel = 0;

function setup() {
    createCanvas(400, 400);
    xvel = random(-4,4); //x velocity of bee
    yvel = random(-4,4); //y velocity of bee
    frameRate(5);
}

function draw() { 
    background(178, 216, 203);

    //moves bee
    push();
    translate(beeX-200, beeY-200);
    makeBee();
    pop();

    beeX+= xvel;
    beeY+= yvel;

    //makes bee bounce off edges
    if (beeX<35 || beeX>375) {
        xvel = -xvel;
    }

    if (beeY<50 || beeY>375) {
        yvel = -yvel;
    }

    //makes the curve repeat around itself to make a flower
    fill(249, 212, 222);
    stroke(255);
    push();
    translate(width/2, height/2);
    //mouseY controls the number of times the curve is repeated
    for (var rot = 0; rot < 360; rot+= 45-mouseY/40) {
        makeFlower(rot);
    }
    pop();
}

function makeFlower(turn) {
    //mouseX controls the size of the flower
    var a = 10 + mouseX/4;
    beginShape();
    rotate(radians(turn));
    for(var t = 0; t < 2*TWO_PI; t+= .01) {
        //equation for curve
        var r = a*sin(t)+(a*sin(5*(t/2)));
        //polar curve to x,y plane equation
        var x = r*cos(t);
        var y = r*sin(t);
        vertex(x, y);
    }
    endShape();
}

function makeBee() {
    strokeWeight(1);
    stroke(0);

    //wings
    push();
    fill(228-20, 242-20, 251-10);
    rotate(radians(-20));
    ellipse(120, 230, 20, 40);
    pop();

    push();
    fill(228, 242, 251);
    rotate(radians(20));
    ellipse(200+50, 230-140, 20, 40);
    pop();

    //body of bee
    fill(253, 190, 44);
    ellipse(200, 200, 50, 40);

    //stinger of bee
    fill(0);
    triangle(175, 195, 175, 205, 165, 200);

    //eye
    ellipse(220-7, 198, 7, 7);

    //stripes
    noFill();
    strokeWeight(3);
    stroke(0);
    arc(160, 210-8, 70, 70, 12, 13);
    arc(160+10, 210-7, 70, 70, 12-.1, 13);
    arc(160-10, 210-7, 70, 70, 12+.1, 13-.1);

    //smile
    strokeWeight(2);
    arc(220, 210-8, 20, 20, 1.5, 2.5);

    //antennae
    arc(220+5, 210-20, 20, 20, 3.7, 4.5);
    arc(220+5+3, 210-20+2, 20, 20, 3.7, 4.5);

    //legs
    arc(220-30, 210+20-6, 20, 10, 12.7-.5, 13.5-.7);
    arc(220-30+6, 210+20-6, 20, 10, 12.7-.5, 13.5-.7);
    arc(220-30-6, 210+20-6-2, 20, 10, 12.7-.5, 13.5-.7);
    arc(220-30-12, 210+20-6-4, 20, 10, 12.7-.5, 13.5-.7);
}

sijings-lookingoutwards-07

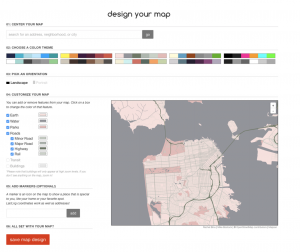
ManyMaps is one of the custom software created by Rachel Binx. She is currently working at Netflix, with the content Science & Algorithms team in Los Angeles. She is an American data visualizer, developer, and designer. She is the co-founder of Meshu and Gifpop, two companies that create physical objects, such as maps and animated GIFs, from social data. For this particular project, it is a site for designing our own map prints. The site is built on Shopify, and Rachel Binx made the site end-to-end, including concept, frontend and backend code, visual design, and photography. It is made possible by OpenStreetMap, which is the largest open-source mapping community in the world. The individual data tiles come from Mapzen, an open-source mapping company. All of the posters and canvas prints are made in the USA.


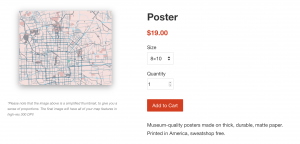
Overall, I really enjoyed this software/website as I am able to create my own design of the place I like. For example, the place I chose there is Beijing, China where is my hometown. By selecting my favorite colors with the important location, I was able to build a connection with the place even though I am not physically there.

The design page for the users creating their dream map | updated 2017
The poster I designed for my hometown
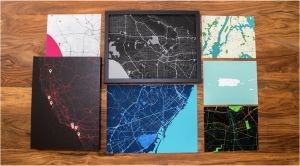
The samples/art works presented on the website

MANYMAPS official website

ikrsek-SectionC-Project-07-Curves

http://mathworld.wolfram.com/SphericalSpiral.html

sketch

//Isadora Krsek
//Ikrsek@andrew.cmu.edu
//Section C
//Project 07: Curves

var x; 
var y; 
var z; 

function setup() {
    createCanvas(400, 400);
    noStroke();
}
 
function draw() {
    background(0);
    //adjusting placement & size of curves
    translate(width/2, height/2);
    scale(150)
    limit = (map(mouseX, 0, width, 2, 8)); //caps the # of loops
    limit2 = (map(mouseY,0,height,20, 80)) //caps the # of loops
    push();
    scale(3,3)
    rotate(radians(90));
    push();
    rotate(mouseY,0,height,0,360)
    drawLoxoB();
    pop();
    drawLoxo();
    pop();
}


function drawLoxo() {
  //a controls how many strokes there are in terms of representing the loxodrome
    for (var a=.4; a<limit; a+=.2) {  
    //color change mapped to a
      var rValue = (map(a, 0.4, 4, 0, 360))
      fill(rValue);
      beginShape(QUADS);   
      for (var t = -20; t <limit2; t+=.1) {
        x = ((cos(t))/(sqrt(1+pow(a,2)*pow(t,2))));
        y = ((sin(t))/(sqrt(1+pow(a,2)*pow(t,2))));
        vertex(x, y);
      }
      endShape();
    } 
}

function drawLoxoB() {
  for (var a=.4; a<limit; a+=.2) { 
    var rValue = (map(a, 4, 0.4, 0, 360)) 
    fill(rValue);
    beginShape(QUAD_STRIP);   
    for (var t = -20; t <limit2; t+=.1) {
      x = ((cos(t))/(sqrt(1+pow(a,2)*pow(t,2))));
      y = ((sin(t))/(sqrt(1+pow(a,2)*pow(t,2))));
      vertex(x, y);
    }
    endShape();
  } 
}

I was looking at a few different curves but was most inspired by the loxodrome which I decided to try to replicate 2-dimensionally.

I wanted to create something a little haunting, but still somewhat visually exciting in the spirit of October, and as a result this is what I came up with. It brings to mind for me, the headlight of a train as it’s running towards you inside of a tunnel.


aerubin-LookingOutwards-07-Section-C

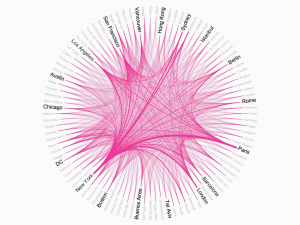
Airbnb is a hospitality service that enables people to rent a place to stay in a multitude of locations around the world. This service is much less expensive than hotels and can be more accommodating to needs as it is renting another individual’s room, home, or even an igloo instead of a single costly hotel room. The data from all of the online transactions was recorded and Rachel Binx turned it into a work of art.

This represents Airbnb’s top 50 markets, with the thickness of the lines corresponding to the relative volume of travels between each pair.

Rachel Binx is an American data visualizer, developer, and designer. She has worked at Stemen Design and NASA and is also a co-founder of Meshu and Gifpop. While working at Stemen, she was assigned to create a visual representation of all places people have traveled to and from utilizing Airbnb. Her design utilized data from Airbnb’s top 50 markets listed in a circular pattern. Lines were then drawn in between locations with the thickness of the lines being dependent on the number of travels between each pair of locations.

Originally only designed to be on a presentation by Airbnb’s CEO, it turned into this abstract design that is both visually pleasing and informational. I really admire her design as it shows data in an interesting and intuitive manor. The data taken from the travels between areas could have easily been written out in an uninteresting fashion with places listed next to their given volume of travel. This would make it difficult to quickly examine the places with the highest/lowest volume of travel between each pair. She did not only turn the data into a easily legible design, but she turned it into artwork.

http://rachelbinx.com/Airbnb

sijings-project07-Composition with Curves

sijings-07


//Clair(sijing) Sun
//session C
//sijings@andrew.cmu.edu
//Assignment-06-compositionwithCurve

var t=0;
var r=60;
var curveP1;
var curveP2;
var color1=141;
var color2=141;

function setup() {
  createCanvas(480, 480);
}
 
function draw() {
  var t=map(mouseY, 0, height/4, height/2, height/4);//constrain it between hieght/2 and height/3
  background(156,170,164);
  noStroke();  
  var limit;//curve for determining how many times we want to rotate
  if (mouseX<width/2){
    limit=map(mouseX,0,width/2,0,16);
  }else{
    limit=map(mouseX, width/2, width,16,0);
  }
  for (var num=0;num<limit;num++){//set limit as our limit for iteration
    //leafs
    angleMode();
    fill(200,195,167);
    arc(50, 50, 140, 140, 180, 270,CHORD);//all used chord becuase we need to create
    arc(50, 80, 140, 140, 200, 270,CHORD);//a effect of leaves
    arc(width-50, height-50, 140, 140, 180, 270,CHORD);
    arc(width-50, height-80, 140, 140, 200, 270,CHORD);
    fill(104,103,78);
    arc(50, 70, 160, 140, 30, 0,CHORD);
    arc(60, -90, 260, 240, 190,40, CHORD);
    arc(width-50, height-30, 160, 140, 30, 0,CHORD);
    arc(width-50, height-90, 260, 240, 190,40, CHORD);
    fill(203,169,111,70);
    arc(30, -40, 260, 240, 190,40, CHORD);
    arc(20, 70, 140, 140, 180, 270,CHORD);
    arc(55, 115, 140, 140, 200, 270,CHORD);
    arc(width-150, height-90, 260, 240, 190,40, CHORD);
    arc(width-20, height-70, 140, 140, 180, 270,CHORD);
    arc(width-55, height-115, 140, 140, 200, 270,CHORD);
    fill(212,202,144);
    arc(50, 120, 240, 240, 200, 270,CHORD);
    arc(width-115, height-120, 240, 240, 200, 270,CHORD);
    fill(104,103,78,100);
    arc(-20, 90, 160, 140, 30, 0,CHORD);
    arc(20, -90, 260, 240, 190,40, CHORD);
    arc(width-80, height-90, 160, 140, 30, 0,CHORD);
    arc(width-80, height-90, 260, 240, 190,40, CHORD);

  //inner loop for drawing the actual curve
    for (var i=0;i<670;i++){
      r=mouseX/5;//set the radius to continue change
      if (num%4==0){//set different conditions for determing which direction we want
        var x=r*cos(t)*(1+cos(t));
        var y=r*sin(t)*(1+cos(t));
      }
      if (num%4==1){
        var x=r*cos(t)*(1-cos(t));
        var y=r*sin(t)*(1-cos(t));
      }
      if (num%4==2){
        var x=r*sin(t)*(1+cos(t));
        var y=r*cos(t)*(1+cos(t));
      }
      if (num%4==3){
        var x=r*sin(t)*(1-cos(t));
        var y=r*cos(t)*(1-cos(t)); 
      }
      t+=0.97;
      curveP1=width/2+num*2+x-12;//circles position x
      curveP2=height/2+num+y;//circles position y
      if (mouseX<width/2){
        var color1=map(mouseX, 0, width/2, 200, 74);//set conditions for changing color
        var color2=map(mouseX, 0, width/2, 121, 36);
      }else{
        var color1=map(mouseX, width/2, width, 80,200);
        var color2=map(mouseX, width/2, width, 35,121);
      }

      rotate(PI/5.0);//for rotating shape
      fill(255,color1,color2,255-mouseX/3);
      var size=map(mouseX,width/2,width,2,10);//also constrain size
      ellipse(curveP1,curveP2,size,size);
    } 

  }
  

}


sketch before starting the project

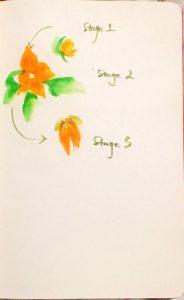
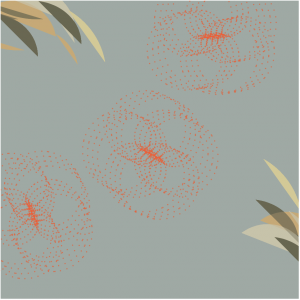
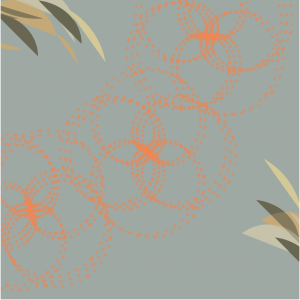
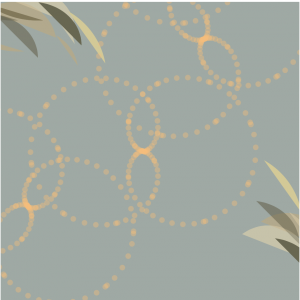
For this project, I wanted to express the idea a flower is blooming and then dying based on our mouse movement from left of the canvas to the right. So we can see there are changes of the number of petals (increase when mouseX approaching to the center of the canvas) and decreases when mouseX leaving the center of the canvas and going to the edge. With this movement, there are also changes in color, opacity, size, and the position of each dots. The audience can play this interactive work by rotating the flower and seeing how they can transform a flower from born to death. There are also some leaves being created for decoration. Here are some screenshots of the different states of the flower.

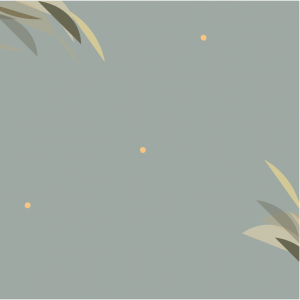
when the flower first appear, color-light orange
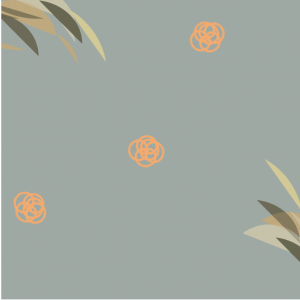
When flowers get bigger and curves appear, color becomes darker orange
when flower bloom and become orange red

The final state of the curves, which will be reduced to fewer curves

eeryan-Project07-Curves

sketch

function setup() {
  createCanvas(400, 400);
  frameRate(10);
}


function draw() {
  background(245, 252, 99);
  // draw the frame
  fill(0);
  noStroke();
  stroke(1);

  // draw the curve
  push();
  translate(width / 2, height / 2);
  drawNeoid();
  pop();
}

function drawNeoid(){
  var x;
  var y;
  var ac = mouseX/50;
  var a = constrain(ac, 0.4, 80);//constrains variable to keep curve from scrunching too small
  var b = mouseY/100;
  noFill();
  stroke(0,0,255);
  strokeWeight(2);
  beginShape();
  for(var i = 0; i < width; i+=5){
    var t = map(i, 0, -10, 10, TWO_PI);//maps theta so curve expands and contracts smoothly
    x = cos(t) * (a * t + b);//parametric equation for neoid
    y = sin(t) * (a * t + b);//parametric equation for neoid
    vertex(x,y);
  }
  endShape(OPEN);
}

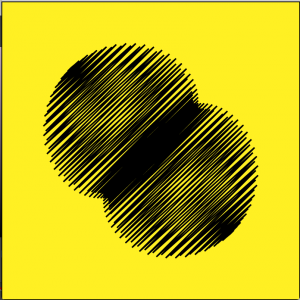
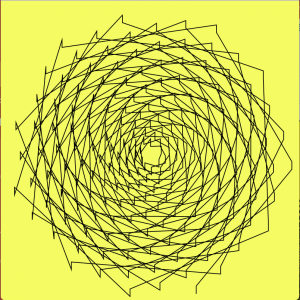
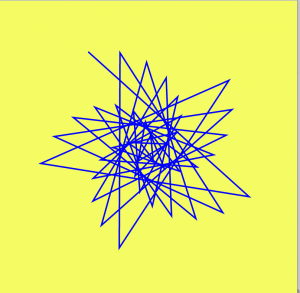
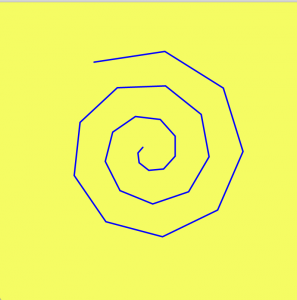
I started by playing with the epichondroid curve example code. By using the vertex command twice with differently ordered variables, I was able to render the curves in interesting ways. I then moved to playing around with a neoid curve, and by adjusting the for loop I was able to achieve the curve I ended up with.

These are examples of what the curve would have looked like if my for loop had added 5, 10, and 15 to i.

LookingOutward-07

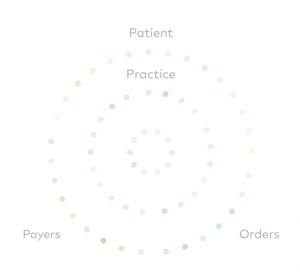
For this weeks project, I chose a project with athenahealth. Fathom, a design firm focused on creating visuals that show data, partnered alongside athenahealth to create a visual showing how patients move through their healthcare network. The application divides patients’ interaction into four parts: practice, patient, orders, and payers.

Four parts of patient interaction with healthcare network.

Practice includes initial patient exchanges with caregivers, patient includes the patient’s individual interaction with the online health portal, orders include orders and lab transactions, and payers include payer transactions like processing of insurance claims.

When in action, the application has a series of dots that appear and float around the screen between the various groups, changing colors according to the category and where it is.

I find this application very visually pleasing and creative compared to many other data displaying applications. It’s easy to revert to a graphical display of data, but this application uses a much more original visual. Standing alone, the application can easily catch peoples eyes and be a work of art. However, in reality it displays data in a way that shows relationships and connections between various areas of the healthcare network.

https://fathom.info/athenahealth/

JDBROWN – Project 7 – C U R V E S

Curve

// Joshua Brown
// Jdbrown@andrew.cmu.edu
// Project 7: Curves
// Section C

function setup () {
    createCanvas (480, 480);
    background (0);
}

function mousePressed () {
    background (0);
}


function draw () {

    stroke (255);
    strokeWeight (2.5);

    // defining variables for drawing line-heavy shapes;
    // linking x variables with the mouseX parameter;

    var x1 = mouseX;
    var y1 = 40;
    var x2 = mouseX;
    var y2 = 440;
    var xMid = width / 2;
    var yMid = height / 2;

    // drawing the spikey, Masonic symbol thing;

    stroke (mouseX / 2 + 20, mouseX / 2, mouseY / 3);
    line (x1, yMid, x2, yMid);
    line (xMid, yMid / 4 - 30, xMid, yMid - 40);
    line (xMid, yMid - 40, xMid - 180, yMid + 180);
    line (xMid, yMid - 40, xMid + 180, yMid + 180);
    line (xMid, yMid - 210, xMid + 180, yMid + 180);
    line (xMid, yMid - 210, xMid - 180, yMid + 180);
    line (x1, yMid, xMid, yMid - 150);
    line (x2, yMid, xMid, yMid - 150);
    line (x1, yMid, xMid, yMid - 80);
    line (-x2 + 480, yMid, xMid, yMid - 80);

    // drawing the inverse (upside-down version);

    stroke (mouseY / 2, 0, mouseX / 3);
    line (x1, yMid, x2, yMid);
    line (xMid, yMid / 4 - 30, xMid, yMid + 40);
    line (xMid, yMid + 40, xMid + 180, yMid - 180);
    line (xMid, yMid + 40, xMid - 180, yMid - 180);
    line (xMid, yMid + 210, xMid - 180, yMid - 180);
    line (xMid, yMid + 210, xMid + 180, yMid - 180);
    line (-x1 + 480, yMid, xMid, yMid + 150);
    line (-x2 + 480, yMid, xMid, yMid + 150);
    line (-x1 + 480, yMid, xMid, yMid + 80);
    line (x2, yMid, xMid, yMid + 80);
    fill (255);

    ellipse (width/2, height/2, 30, 30);

    // drawing the circles which comprise the central diamond shape;

    push();

    translate (width/2, height/2);
    rotate (radians (mouseX));

    fill (255, 25);
    ellipse (-240, -240, 600, 600);
    ellipse (-240, height - 240, 600, -600);
    ellipse (width - 240, -240, 600, 600);
    ellipse (width - 240, height - 240, 600, 600);

    pop ();

    // drawing circles on the fringes, to increase dimensionality;

    push ();

    translate (width/2, height/2);
    rotate (radians (mouseY));

    fill (0, 25);
    ellipse (-240, -240, 300, 300);
    ellipse (-240, height - 240, 300, -300);
    ellipse (width - 240, -240, 300, 300);
    ellipse (width - 240, height - 240, 300, 300);

    pop ();

    // drawing smaller fringe circles to increase trippiness;

    push ();

    translate (width/2, height/2);
    rotate (radians (mouseX));

    fill (0, 25);
    ellipse (-240, -240, 150, 150);
    ellipse (-240, height - 240, 150, -150);
    ellipse (width - 240, -240, 150, 150);
    ellipse (width - 240, height - 240, 150, 150);

    pop ();

    // small white circles! Why not!

    push ();

    translate (width/2, height/2);
    rotate (radians (mouseX));

    fill (255);
    ellipse (-240, -240, 80, 80);
    ellipse (-240, height - 240, 80, -80);
    ellipse (width - 240, -240, 80, 80);
    ellipse (width - 240, height - 240, 80, 80);

    pop ();

}


I was interested in the petal-ish curve shapes, since I didn’t quite understand how to translate a lot of the more complicated algebraic maths into code.