LO: Information Visualisation

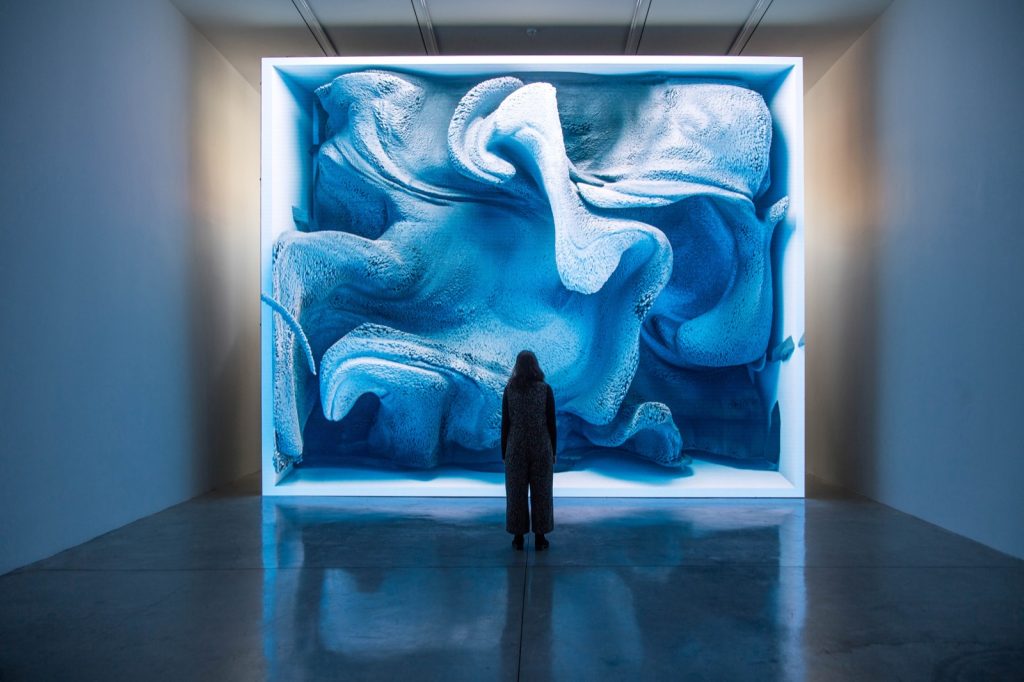
For this weeks blog, I chose to analyze a project called “Melting memories – Drawing neural mechanisms of cognitive control” by Refik Anadol Studios. This project revolves around visualizing brain activity of participants when they were asked to recall a specific childhood memory. This childhood memory is not mentioned but it’s really interesting to think how different elements of these memories will have visually different representations. The technical workings of how these memories were displayed in a visual way are quite complex and it was hard for me to understand but the basics is that researchers took EEG data from the participants brains and converted that data into 3D models that we see. This sort application of data visualization can have en enormous on our society in different fields like healthcare, education etc.

Link to the project – https://www.creativeapplications.net/vvvv/melting-memories-drawing-neural-mechanisms-of-cognitive-control/

Visualization of brain activity

Project 7: Composition with Curves

sketch

var x1;
var y1;
var x;
var y;
var a;
var t;
var r;
var g;
var b;
var bcolor;

function setup() {
    createCanvas(480, 480);
    let j = 700
    while (j > 0) {
        strokeWeight(0);
        j = j - 10
        bcolor = map(j, 700, 0, 0, 255);
        fill(bcolor);
        circle(240, 240, j);
    }
}

function draw() {
    stroke(r, g, b);
    strokeWeight(3);
    beginShape();
    for (var i = 0; i < 100; i++) {
        a = map(mouseX, 0, 480, 0, 100);
        t = map(mouseY, 0, 480, 0, 100);
        x1 = a * sin(t);
        y1 = a * sin(t) * cos(t);
        x = 240 + x1 * -1
        y = 240 + y1 * -1
        vertex(x, y);
        print(y);
    }
    endShape(CLOSE);
}

function mousePressed() {
    r = random(0, 255);
    g = random(0, 255);
    b = random(0, 255);
}

As I started working on this project, I wanted the viewer to be able to “draw” the curves themselves. As MouseX changes, the size of the curve changes. As MouseY changes, different points are added on the curve. When the canvas is clicked, the color of the points change. If you manipulate the mouse in a certain way, you can make concentric figure 8s of varying colors. When I finished coding the curves and their mouse interaction, it still felt a little bland, so I added a circular gradient to the background to focus the eye gaze on the center of the canvas.

LO 7: Information Visualization

Juan Francisco Saldarriaga’s CitiBike Rebalancing Study is a investigation and subsequent data visualization to assist CitiBike with maintaining the equilibrium of their bike stations throughout different locations and times of day. The matrix is organized on those two axes, location and time of day, to establish patterns of usage. The imbalance of bikes is demonstrated by color, blue and orange, while the overall usage is characterized by the brightness of the color. This visualization makes it immediately apparent which stations are consistently depleted or overloaded daily. The analysis of this data will allow CitiBike to partially automate their system of organization, significantly cutting labor and expenses from the inefficient old system, which was based almost randomly on urgent need.

LO: Information Visualization

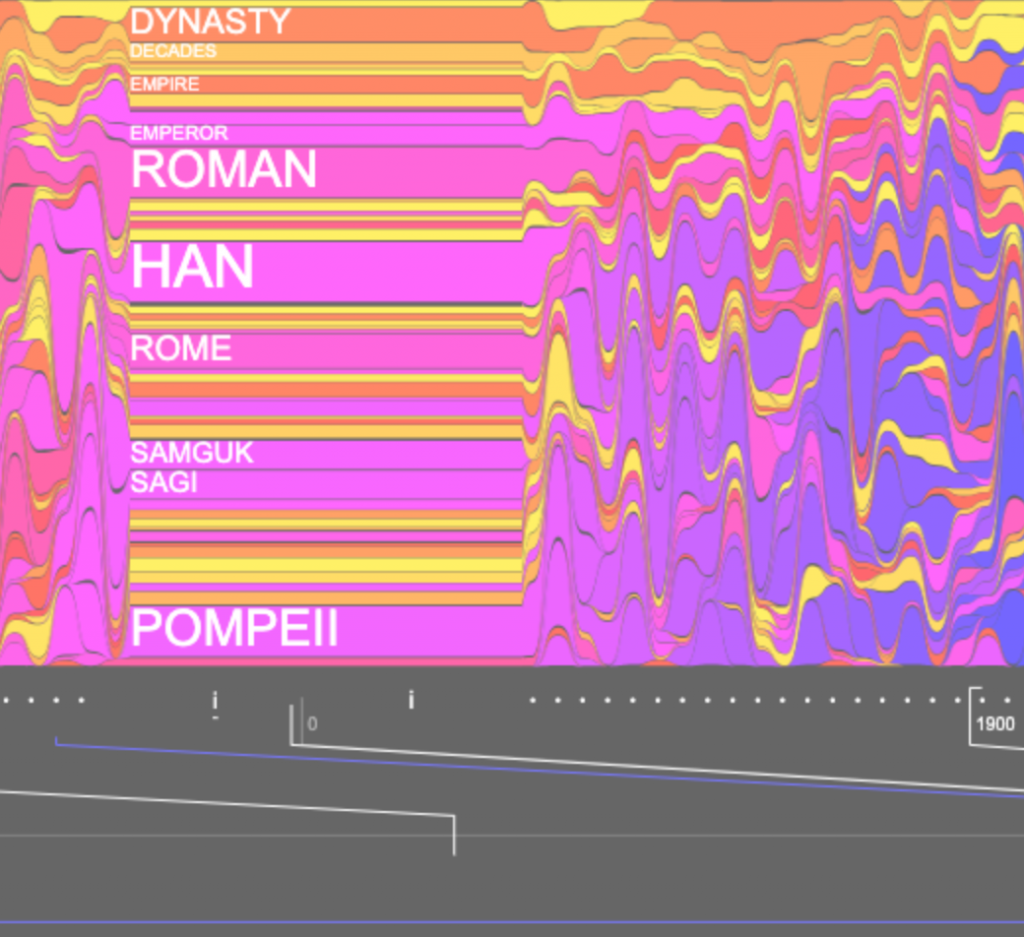
I looked at Santiago Ortiz’s work for this week’s blog, and I admired his History Words Flow project. John B. Sparks’s Histomap in 1931 inspired Ortiz to create this interactive project. The project depicts a colorful background and a timeline at the bottom; when users move the cursor horizontally along the timeline, words that describe that period in history will pop up. Also, when the viewer moves the cursor up and down, the text size changes. I think these features create a more interactive learning experience instead of just reading raw text and data. Ortiz did not share much about his process, except that he selected the words based on Wikipedia’s article list, organized in chronological order. I love how the project is in conversation with previous historical visualizations, which allowed me to see how advancements in technology made different ways of representing information possible. Ortiz’s research in information visualization is an excellent example of how various academic fields can benefit from clear and interactive visualizations.

link

Looking Outwards 6

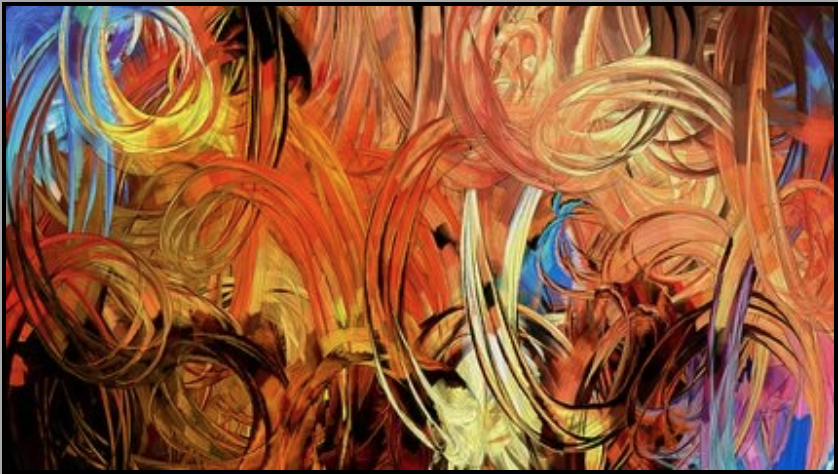
I really enjoyed this work by Patrick Gunderson. The visual complexity created by the ramdomly generated splotches of colour pattern is really visually pleasing. I really enjoy the complementing and in some cases contrasting colour patterns that are created randomly. It many arts it almost looks as if the art is capturing the motion of a specific object. He tries to incorporate imperfections into algorithmic systems the strikes the tension in between order and natural flow. 

https://www.artistaday.com/?p=2812

Curves

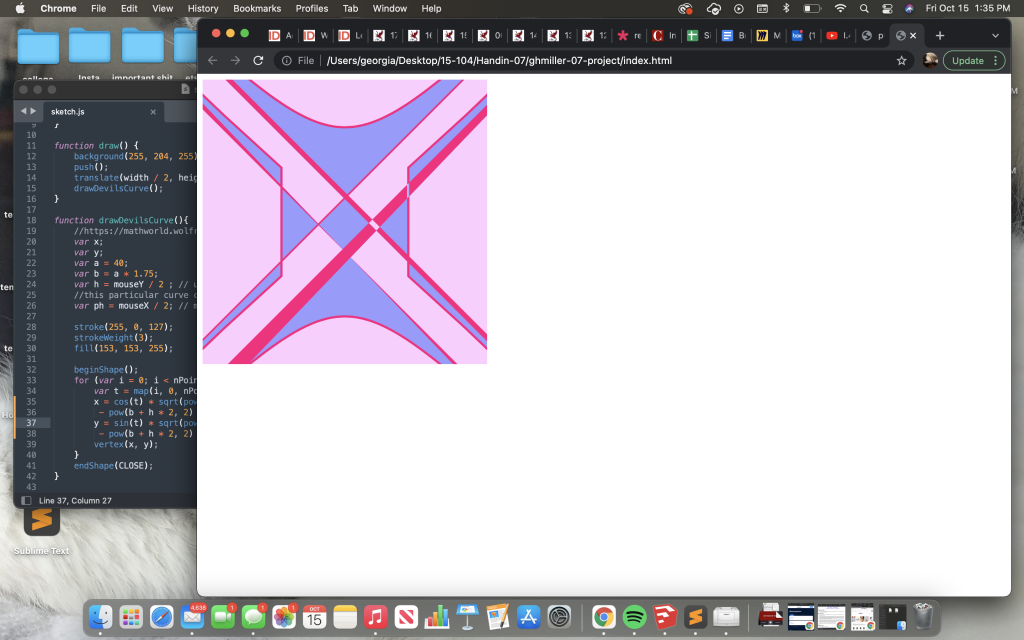
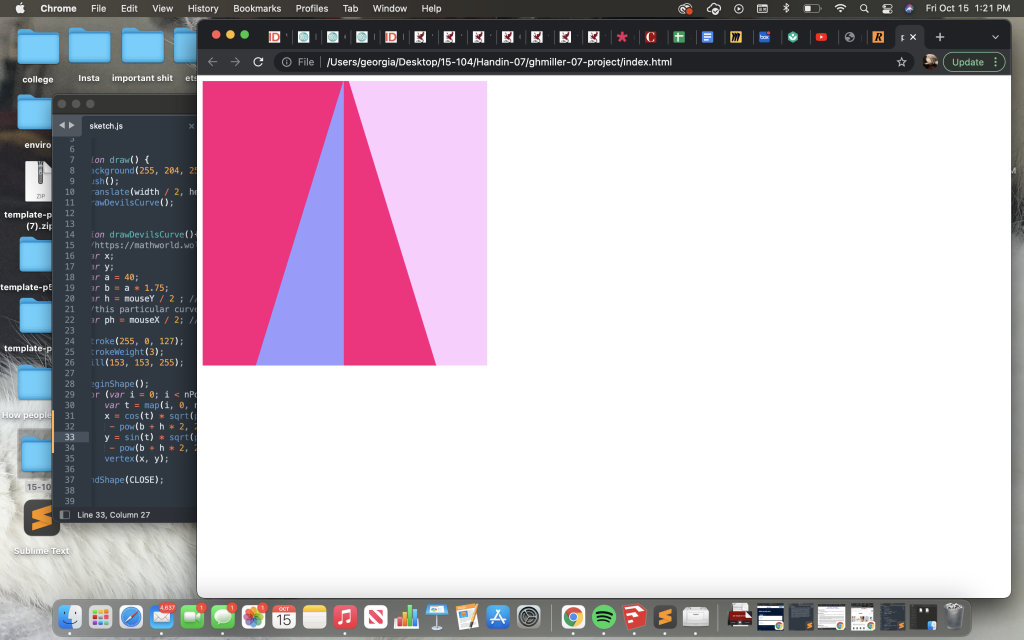
I decided to chose the Devil’s Curve for my project, mostly because I liked the way it looked. It was very hard at first because I have not been in a math class in years, to figure out what each part of my equations did. At first I had a problem where my signs were wrong and only had the crunode show up.

bad ()s
more bad ()s

I got stuck for a bit, but the project seemed simpler than I thought at first. To better understand and to play around with my curve to figure out how I should have it move, I was able to find an example of the curve and move it’s a and b points on desmos. One thing I had already accidentally realized was that if a and b were equal they would make a circle and if a/b was more or less than one rotated the crunode. I thought these properties were interesting so I wanted to attach my b value and a values to movements so that they would be able to both equal each other and be more than and less than. Doing this also allowed my curve to grow and shrink.

The code works so so that mouseX and Y control a and b. They do the same thing to the numbers but depending on the position of the mouse on the page it controls rotation of the crunode and size.

file

//Georgia Miller
//Section D
//15-104

nPoints = 400;
function setup() {
    createCanvas(400, 400);
    frameRate(10);
}

function draw() {
    background(255, 204, 255);
    push();
    translate(width / 2, height / 2);
    drawDevilsCurve();
}

function drawDevilsCurve(){
    //https://mathworld.wolfram.com/DevilsCurve.html
    var x;
    var y;
    var a = 40;
    var b = a * 1.75;
    var h = mouseY / 2 ; // up and down to change crunode
    //this particular curve changes orientation based on if a/b is bigger or larger than 1
    var ph = mouseX / 2; // move mouse to right to grow

    stroke(255, 0, 127);
    strokeWeight(3);
    fill(153, 153, 255);

    beginShape();
    for (var i = 0; i < nPoints; i++){
        var t = map(i, 0, nPoints, 0, TWO_PI); //t = theta
        x = cos(t) * sqrt((pow(a + ph, 2) * pow(sin(t), 2) 
         - pow(b + h * 2, 2) * pow(cos(t), 2)) / (pow(sin(t), 2) - pow(cos(t), 2)));
        y = sin(t) * sqrt((pow(a + ph, 2) * pow(sin(t), 2)
         - pow(b + h * 2, 2) * pow(cos(t), 2)) / (pow(sin(t), 2) - pow(cos(t), 2)));
        vertex(x, y);
    }
    endShape(CLOSE);
}

Information Visualization

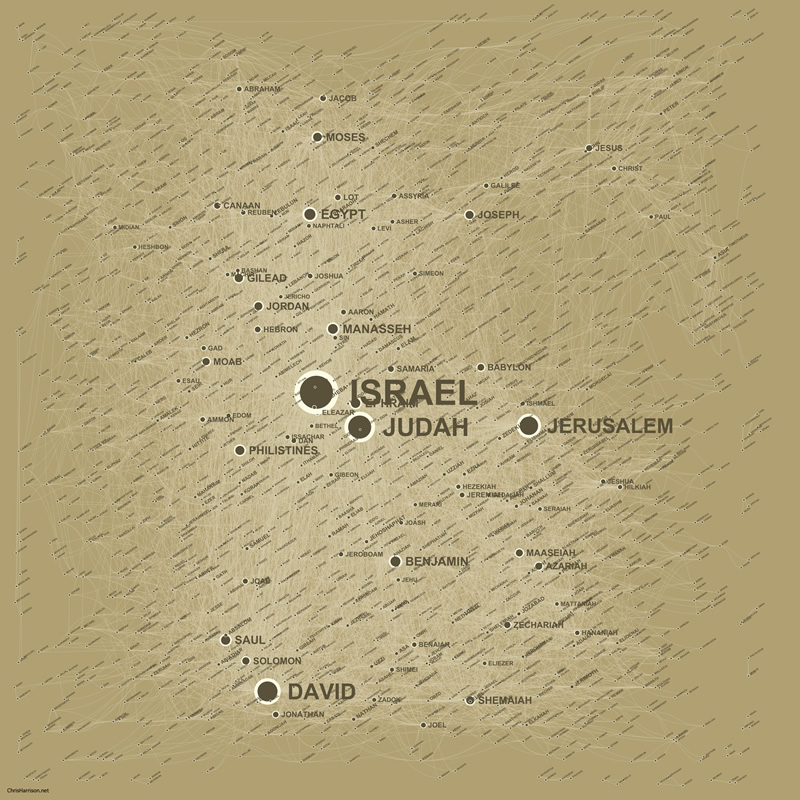
Bible-Cross Reference Visualization

https://www.chrisharrison.net/index.php/Visualizations/BibleViz

As someone who is not particularly interested in reading the Bible I was surprised to find Chris Harrison’s work on Bible Cross-References to be both beautiful and thought provoking. I can imagine this work being done on other novels and creating an equally beautiful result. Harrison and Pastor Christoph Romhild worked together to render the data of over 63,000 cross references in the Bible. The cross-references used in the visualization is from bottom page references, concepts, and locations and people found throughout the text. I found the tracking of people throughout the text to be particularly interesting.

Harrison also created a Social network of the people and places mentioned by using a spatial clustering algorithm. I think it is interesting to have a visualization of where people were spending time and how often they are mentioned.

Project 6: Abstract Clock

Going into this project, I first started thinking about my favorite ways to physically tell time. How does my body determine what time it is? I eventually settled on the changing daylight. From there, I decided that I both wanted to create a landscape and didn’t want to directly show the sun or the moon (that feels overdone). In the end, I like the effect that I got with all the different elements in my desert landscape. I think the bird could be a little more accurate to a buzzard and I think it would have been cool if the tumbleweed could have rotated, but I just didn’t have time to complete either of those. Perhaps I’ll go back into my code later and fix them to be the best version I can get them.

sketch

//Elise Chapman
//ejchapma
//ejchapma@andrew.cmu.edu
//Section D

function setup() {
    createCanvas(480,300);
    rectMode(CENTER);
}

function draw() {
    background(200); //background is white
    //draws a buzzard that flies across the screen every minute
    noStroke();
    var dx=430/60;
    var xPos=dx*second(); //x position of the buzzard
    var yPos=50; //y position of the buzzard
    fill(75);
    ellipse(xPos,yPos,25,15);
    ellipse(xPos+15,yPos,15);
    triangle(xPos+20,yPos-5,xPos+20,yPos+5,xPos+30,yPos);
    //the buzzard will move its wings every second
    if (second()%2==0) {
        triangle(xPos-10,yPos-3,xPos+10,yPos-3,xPos,yPos-20);
    } else {
        triangle(xPos-10,yPos+3,xPos+10,yPos+3,xPos,yPos+20);
    }
    landscape(0,0);
    tumbleweed(0,0);
    sky(0,0);
}

//draws the tumbleweed, that will eventually move
function weed(x,y) {
    push();
    translate(x,y);
    stroke(241,208,160); //beige
    strokeWeight(5);
    line(-15,-20,25,10);
    line(-15,20,20,-15);
    line(-25,0,25,-10);
    line(0,-25,0,25);
    line(-20,10,20,15);
    line(10,20,15,-20);
    line(-10,20,-15,-20);
    line(-20,-10,5,-15);
    pop();
}

//makes the weed tumble, moving every minute
function tumbleweed(x,y) {
    var xPos=0; //x position of tumbleweed
    var yPos=(height/3)+140; //y position of tumbleweed
    var dx=width/60; //how much the tumbleweed moves by
    weed(xPos+(dx * minute()),yPos);
}

//draws the main background
function landscape(x,y) {
    push();
    translate(width/2,height/2);
    noStroke();
    //background plateau
    fill(249,160,63); //orange sand color
    rect(width/4,height/4,100,height,30,30);
    rect(width/4+50,height/3,50,height,30,30);
    rect(width/4+100,height/2.25,100,height);
    rect(width/4-25,height/2.5,100,height,30,30);
    rect(width/4-75,height/1.75,100,height,30,30);
    //even further background plateu
    fill(255,193,100); //lightened orange sand color
    rect(-width/4-50,height/3,75,height,30,30);
    rect(-width/4-10,height/2.25,75,height,30,30);
    rect(-width/4-100,height/1.75,50,height,30,30);
    //foreground
    fill(212,122,19); //red sand color
    rect(0,height/3,width,height/3);
    //cactus
    fill(122,132,80); //green
    rect(-width/5+10,0,30,200,30,30,30,30);
    rect(-width/5+40,0,80,30,30,30,30,30);
    rect(-width/5+65,-20,30,60,30,30,30,30);
    rect(-width/5-20,-40,50,30,30,30,30,30);
    rect(-width/5-35,-70,30,85,30,30,30,30);
    pop();
}

//changes the color of the sky (and ambiance) every hour
function sky(x,y) {
    noStroke();
    if (hour()==0) {
        fill(18,27,103,150);
    } else if (hour()==1) {
        fill(67, 49, 82,150);
    } else if (hour()==2) {
        fill(107, 66, 65,150);
    } else if (hour()==3) {
        fill(146, 84, 48,150);
    } else if (hour()==4) {
        fill(176, 97, 35,150);
    } else if (hour()==5) {
        fill(216, 115, 18,120);
    } else if (hour()==6) {
        fill(255, 132, 1,120);
    } else if (hour()==7) {
        fill(208, 147, 48,90);
    } else if (hour()==8) {
        fill(170, 159, 86,90);
    } else if (hour()==9) {
        fill(113, 177, 142,60);
    } else if (hour()==10) {
        fill(57, 195, 199,60);
    } else if (hour()==11) {
        fill(0, 212, 255,60);
    } else if (hour()==12) {
        fill(23, 186, 235,60);
    } else if (hour()==13) {
        fill(46, 159, 215,60);
    } else if (hour()==14) {
        fill(92, 106, 175,60);
    } else if (hour()==15) {
        fill(115, 80, 155,60);
    } else if (hour()==16) {
        fill(138, 53, 135,60);
    } else if (hour()==17) {
        fill(161, 27, 115,90);
    } else if (hour()==18) {
        fill(183, 0, 95,120);
    } else if (hour()==19) {
        fill(136, 8, 97,120);
    } else if (hour()==20) {
        fill(113, 12, 98,120);
    } else if (hour()==21) {
        fill(89, 16, 99,150);
    } else if (hour()==22) {
        fill(50, 22, 101,150);
    } else if (hour()==23) {
        fill(8, 17, 94,150);
    }
    rect(width/2,height/2,width,height);
}
LO: Randomness

An example of in-game terrain generation from a forest biome to a mountain biome

As a part of my quarantine boredom, I have picked up the game Minecraft again in a serious way, and a good deal of my time in Minecraft is simply spent wandering around the game’s randomly generated terrain. Minecraft has over 60 different types of terrain, each including their own terms of generation (i.e.: a snowy tundra will look very different from a fringe jungle biome). The only uniform constraint is the height limit, y=256, and bedrock y=0. I admire the sheer variety of terrains in Minecraft, and how much work goes into creating them. They are all instantly recognizable and yet always unique. Before 15-104, I had never considered the effects of randomness on terrain, but now I can see just how deep it goes. The caves underneath are random, as is the surface land, the nether connected to the overworld, the generated structures, the ores, the trees, the mobs… the list goes on. I think that that’s the beauty of Minecraft: it is an entirely different experience every time, due to the randomness deeply embedded in the game.

Minecraft (released Nov.18, 2011)
https://www.minecraft.net/en-us

Project-06: Abstract Clock

sketchDownload

//Catherine Liu
//Section D
//jianingl@andrew.cmu.edu
//Assignment-06-Project

//an abstract clock where the objects move according to seconds, minutes, and hours

var xPos = []; //array for x position of clouds
var yPos = []; //array for y position of clouds

function setup() {
    createCanvas(480, 400);
    //creates random positions for 60 clouds
    for (i = 0; i < 60; i++) {  
        xPos[i] = random(0,480);
        yPos[i] = random(0,150)
    }
}

function draw() {
    background(155,212,255);
    fill(0,0,102);
    rect(0,height/2, width, height/2);
    //draws a number of clouds according to the current second
    for (i = 0; i <= second(); i++) { 
        clouds(xPos[i], yPos[i]);
    }
    push();
    sunMoon(-150, 0); //calls function that draws the rotating sun and moon
    pop();
    //aliens move closer to each other according to minutes
    print(minute().toString())
    rightAlien(480 - 8 * minute(), height/2); //calls function that draws right alien
    leftAlien(0 + 8 * minute(), height/2); //calls function that draws left alien
}

function rightAlien (x, y) { //draws right alien
    stroke(0,102,51);
    strokeWeight(5);
    //arm waves up and down according to seconds using mod 
    if (second() % 2 == 0) {
        line(x-40, y-60, x-13,y-30); //left arm
    } else if (second() % 2 != 0) {
        line(x-45, y-50, x-13,y-30); //left arm
    }
    line(x+13, y-30, x+30, y-15); //right arm
    line(x, y-50, x, y-30); //neck
    stroke(204, 255, 153);
    line(x-10, y, x-10, height); //left leg
    line(x+10, y, x+10, height); // right leg
    stroke(0,102,51);
    line(x-17, y-70, x-7, y-50); //antennae
    line(x+17, y-70, x+7, y-50); //antennae
    noStroke();
    fill(204, 255, 153);
    ellipse(x, y-50, 30,20); //head
    rect(x-15, y-35, 30,120,10); //body
    fill(0,102,51)
    //eyes look back when the aliens pass each other halfway
    if (minute() < 31) {
        circle(x-10, y-51, 5); // left eye
        circle(x-3, y-51, 5); // right eye
    } else if (minute() >= 31) {
        circle(x+10, y-51, 5); // left eye
        circle(x+3, y-51, 5); // right eye
    }
}

function leftAlien(x, y) { //draws left alien
    stroke(0,102,51);
    strokeWeight(5);
    //arm waves up and down according to seconds using mod 
    if (second() % 2 != 0) {
        line(x+40, y-60, x+13,y-30); //left arm
    } else if (second() % 2 == 0) {
        line(x+45, y-50, x+13,y-30); //left arm
    }
    line(x-13, y-30, x-30, y-15); //left arm
    line(x, y-50, x, y-30); //neck
    stroke(204, 255, 153);
    line(x-10, y, x-10, height); //left leg
    line(x+10, y, x+10, height); //right leg
    stroke(0,102,51);
    line(x-17, y-70, x-7, y-50); //left antennae
    line(x+17, y-70, x+7, y-50); //right antennae
    noStroke();
    fill(204, 255, 153);
    ellipse(x, y-50, 30,20); //left man's head
    rect(x-15, y-35, 30,120,10); //left man's body
    fill(0,102,51)
    //eyes look back when the aliens pass each other halfway
    if (minute() < 31) {
        circle(x+10, y-51, 5); // left eye
        circle(x+3, y-51, 5); // right eye
    } else if (minute() >= 31) {
        circle(x-10, y-51, 5); // left eye
        circle(x-3, y-51, 5); // right eye
    }
}

function sunMoon (x, y) { //sun and moon rotates according to hour, from 0-12 it is sun, from 12-23 it is moon
    translate(width/2, height/2);
    var dx = 30 * hour(); 
    rotate (radians(dx));
    if (hour() > 12 & hour() <=23) {
        fill(255, 243, 176);
        arc(x, y, 100, 100, 0, PI + QUARTER_PI, PIE); //moon
        ellipse(x + 30, y - 30, 5, 10);
        ellipse(x - 30, y + 70, 5, 10);
    } else if (hour() >= 0 & hour() <= 12) {
        fill(255, 128, 0);
        ellipse(x, y, 100, 100); //sun
    }
}

function clouds(x, y) { //draws a cloud at position x, y
    fill(233, 254, 255);
    rect(x, y, 20, 10,30); //cloud
}


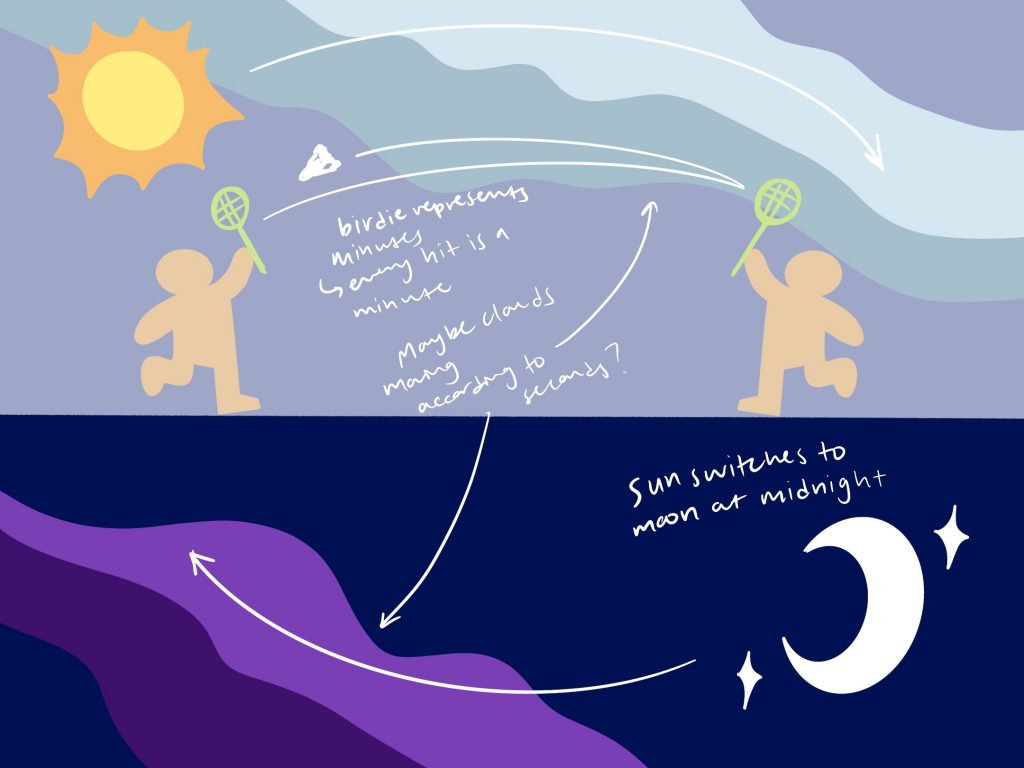
I started off this project by sketching a rough idea of what I wanted to make, which was two people playing badminton, with the shuttlecock moving from one end to the next in minutes. The sun and moon would then rotate according to the hour.

original sketch

However, I came across some coding problems so I changed my idea slightly. Now, they are aliens that can only move with every minute. As they move closer to each other, they are waving and their eyes follow each other. While I kept the sun and moon concept the same, I changed the background clouds to increase numbers according to seconds.