Oscar – final

Title: History City

Description: Your browsing history says a lot about you. What if there was a way to visualize it? Take a look at all the pure (and not so pure) things you’ve been up to in a city-like visualization of your history.

History City layout

What is Your Project: a history visualizer that builds a city based on the type  and frequency of sites you visit.

What Makes Your Project Interesting: we’re never used to looking back at our browsing history because of how its portrays a darker, more secret side of us that we wouldn’t show others. Normally we want to forget/clear our history, but instead of running away from our browsing history, we can now visualize it.

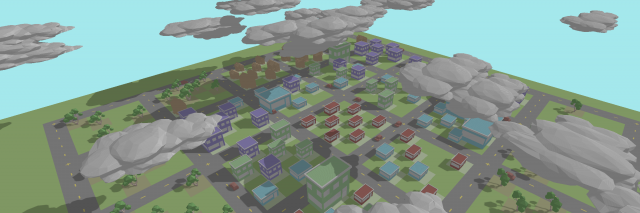
Contextualize Your Work: visually I was inspired by the Three.JS app Infinitown (https://demos.littleworkshop.fr/infinitown) that tried to produce a bright, low-poly city that would stretch on forever. Rather than just random building placement, I wanted to use data to help generate the city.

Evaluate Your Work: The resulting work looks visually impressive, although with more time I would like to focus on city diversity (getting more distinct cities when you input more distinct browsing histories).

Documentation:

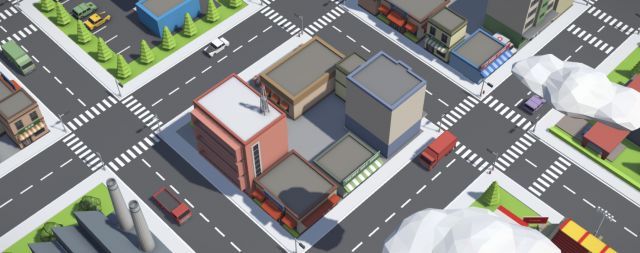
Loading a city with a high pure value.

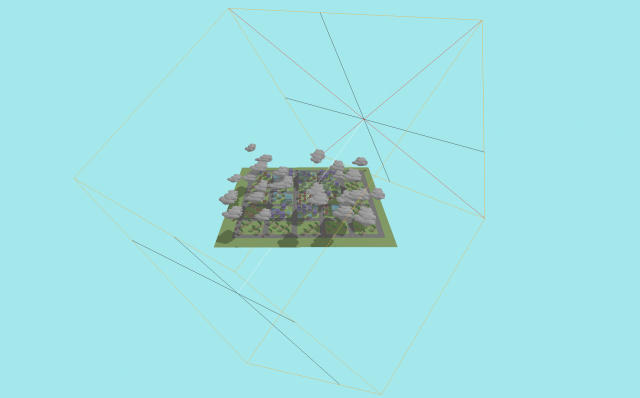
Loading a city with a low pure value.

Clicking on assets to view what sites they are backed by.

The Process:

Given a JSON of a person’s browsing history, the parsing script initially cleans up entries by grouping together link for the same domain name and accumulating site frequency. On a second pass, the script tries mapping each url to an asset type [“building”, “house”,”tree”] depending on the contents of the webpage. The script scrapes the inner html and extracts the top K unique words that frequently occur in the site that don’t occur in other sites. Using these words and a synonym dictionary, the script maps the url to an asset type depending on the connotation of these words:

“building” – corporate, shopping, social media

“house” – personal, lifestyle

“tree” – learning, donating

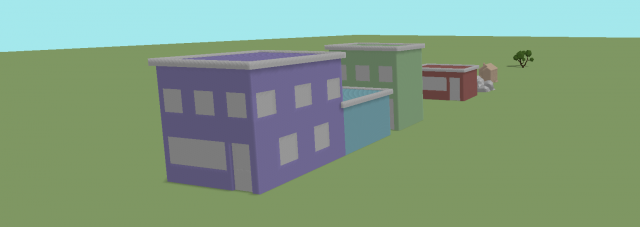
After the mapping is computed, the Three.JS interface loads an instance of each asset. For each url, the corresponding asset is placed, and its size is determined by its frequency. Using Three.JS’s ray-tracer, we can compute the cursor intersection with an asset. On the instance an asset it hovered over, a portion of its material will turn to an orange highlight, and clicking the asset will open a new tab with the url that asset represents.

Building, Cloud, House, and Tree assets.

Roads are generated around 5×5 cell regions. Starting in the center and moving in a spiral motion, each new asset it placed in the initial center 5×5 region while not overlapping with any other asset. If no room exists after a set number of tries, then it moves to the next 5×5 region. This continues to expand the city the more url’s there are to load.

A purity variable captures the ratio of buildings + houses to trees. A more pure city will have no clouds/pollution and no cars on the road polluting. A non-pure city will be dark and have a lot of polluting cars on the road with a lot of dark clouds covering the sky.

Lighting computed using directional lighting, with a range visible by the wireframe. Every material has accept and receive shadows enabled.


Final Project – Slime Language

Slime Language (2020)

Slime Language is an ongoing multi-part gestural performance and video series creating slang sign language from hip hop lyrics. These alternative signs are meant to visualize and decipher a spoken phrase and transform them into a signed idiom.

This idea began in 2019 while I was trying to create a photo series on the black fugitive image and coded languages by using poses influenced by sign language.

(3 out of 26 images from the original “Slime Language” series)

However, I did not consider this as the final rendition of the idea; since, I felt like I captured the fugitive image aspect but not the coded language concept. For the Person in Time assignment for this class, I chose to revisit this series to work on balancing out the coded language aspect. This resulted in a QWERTY like system for your hands using latex gloves based on finger phalanx sections and letter frequency in English.

The project became a speaking system using a cross of the English alphabet, sign language, a Ouija board, tattoos, and gang signs.

The phalanx sections of the fingers (proximal, middle, and distal) were used to plot the English alphabet on the hand. By pivoting and pointing with the thumb, words and sentences could be formed to create silent and performative communication between individuals. The placement of the letters were determined by its frequency in the language and accessibility on the hand.

Yet again, I was not content with the rendition of the concept. The movements were awkward and slow. I also tried to do machine learning with Google Teachable Machine but the movements were too small for it to detect changes. By using the Teachable Machine, I also realized that having your hands straight out in front of you for the messages you form to be read was an uncomfortable positioning in general. Most importantly, the execution felt as if the concept strayed from my body of work.

I then began looking into Christine Sun Kim and her work with sign language and music. By using the movements in signing, she created these drawings/diagrams and I knew this was more of the direction I wanted to go. My work as a whole deals with black culture and hip hop, and the most recent rendition of “Slime Language” just did not have those parts of my work. I then began looking into sign language slang and sign language translators for concerts. After this round of research, I decided to turn Slime Language into a series of movements creating slang/idioms signs based off of lines in songs. As of now the series has 30 installments.

(Full Video: 3 minutes 45 seconds, 30 segments)

(10/30 Segments)

Developing this project made me subconsciously develop a structure for the language that was based more than an exact gesture representation for each word. For instance, a clawed “heart pumping gesture” was used to indicate life and a rolling hand gesture indicate continuing time. Most gestures contained 3 parts: the main action, a disruption to the action, and an ending to the action. This 3 part “syntax” aided in creating a fluid movement as well as a shortened signed idiom.

Joyce-final

a momentary stay

Snap shots of a person’s transient, solitary body in her quarantine home. 

This work lives on this webpage.

In these snap shots, my body is keyed out to create windows, where two videos of the same view in different time scales are overlaid.

Story

During the first a month and a half of quarantine, I stayed in a friend’s apartment. I was originally living in a dorm, stuck in a small, half-basement room with a terrible kitchen. It was miserable so I asked to stay at my friend’s empty apartment while she was with her family in another city.

My friend’s home was full of her personality. When I first arrived, it was as if she just left — there were dishes drying on the rack, clothes in the hamper, and snacks in the fridge. I lived carefully, knowing that in a few weeks, I would leave, and hopefully I would not leave many traces behind. There was a sense of friction between the space and my body, because I was a guest here without the host. I wanted my presence to be brief and light, but as time went by, I blended with the space and felt more and more at home. It really was a cozy apartment! The friction became more of a warm touch.

In this project, I lean into the distance between my body and my temporary home. In the snap shots, my keyed-out body creates windows that allow for juxtaposition between the same space in two different time scales.

Process
  • Taking videos of myself in green suit doing mundane things
  • Overlay videos in After Effect
  • Convert video to gifs using ezgif.com/video-to-gif
  • Create basic webpage to present the gifs (plain html+CSS+javascript; Link to Github repo)

Inspirations

In Search of Lost Time, novel by Marcel Proust
“The Figure A Poem Makes” by Robert Frost
4/51 Dolna St and Headache by Aneta Grzeszykowska

Three Transitions (1973) by Peter Campus

Next steps:
  • gif compression using ffmpeg


Final Project Update 2

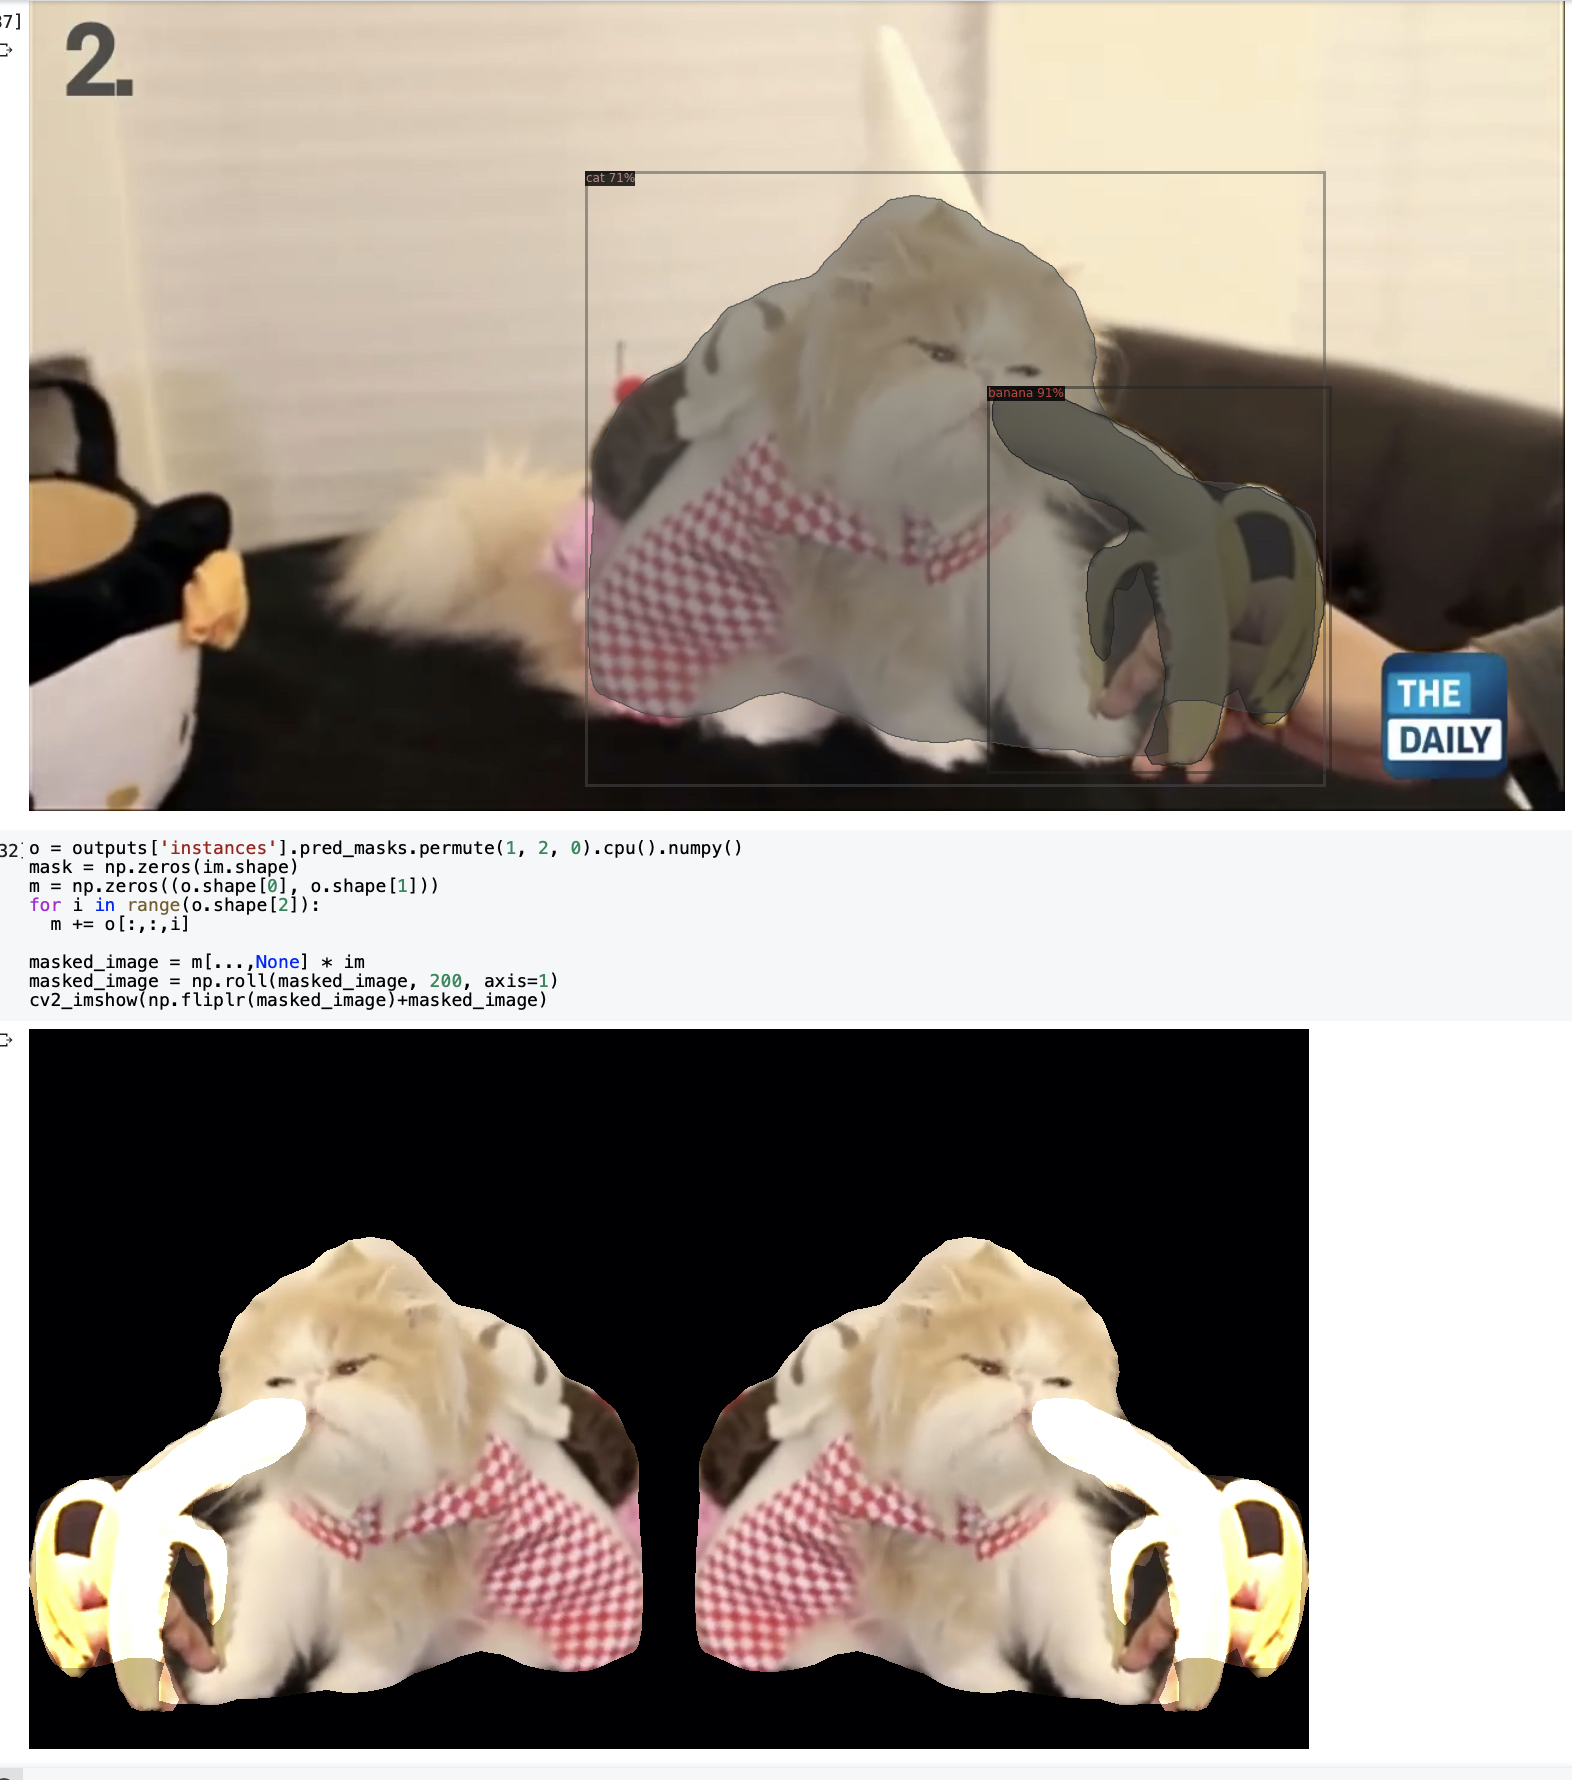
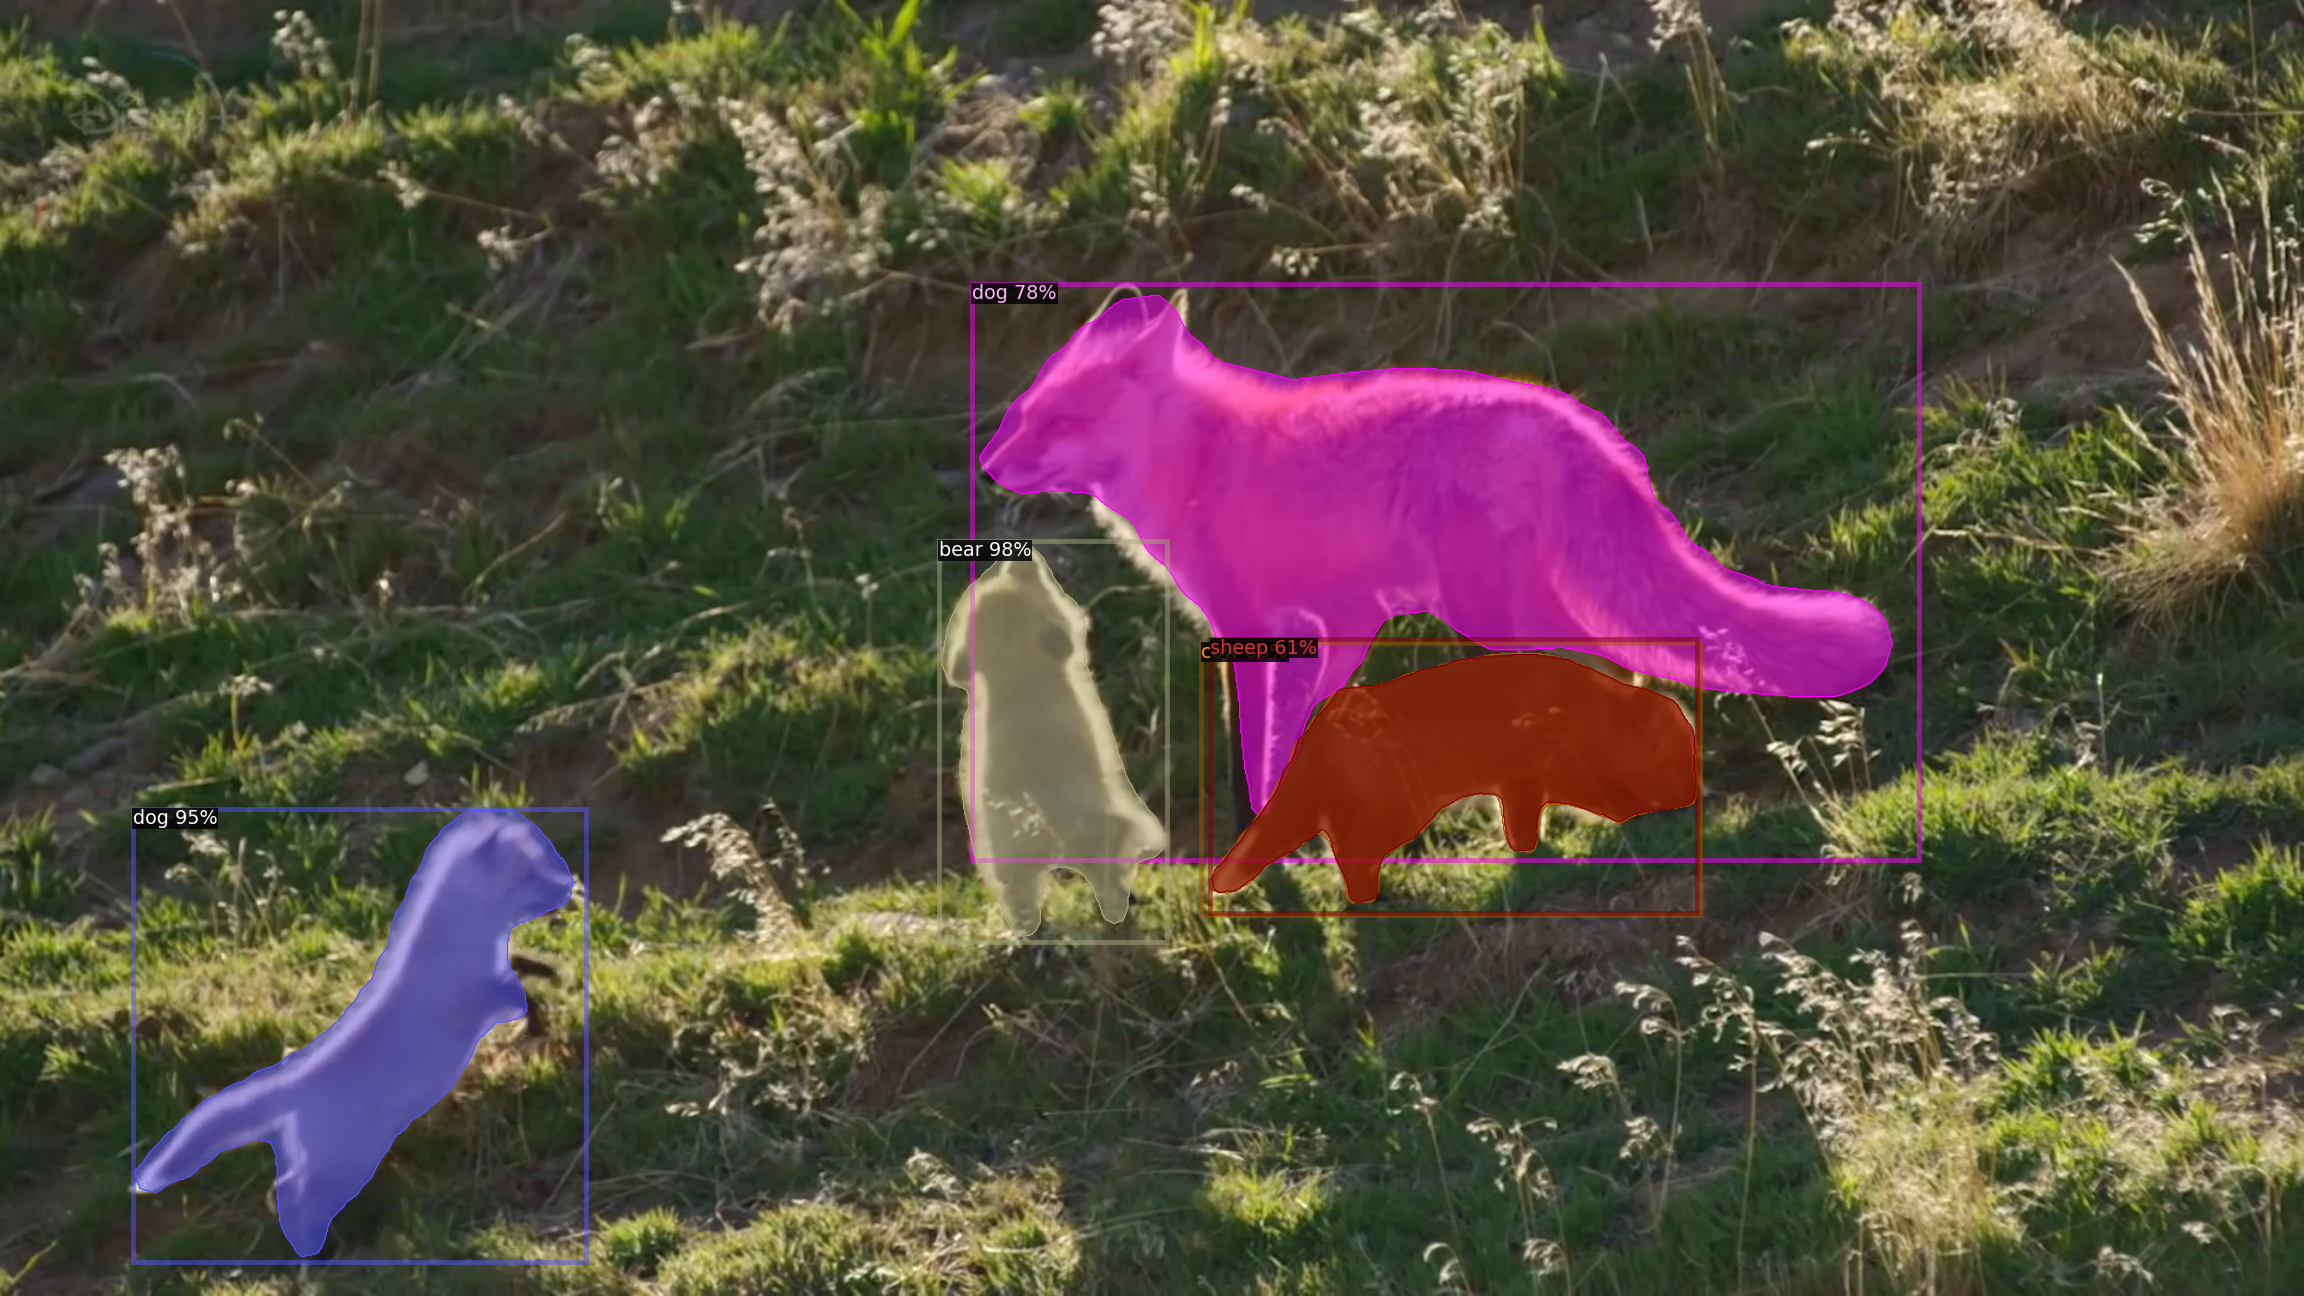
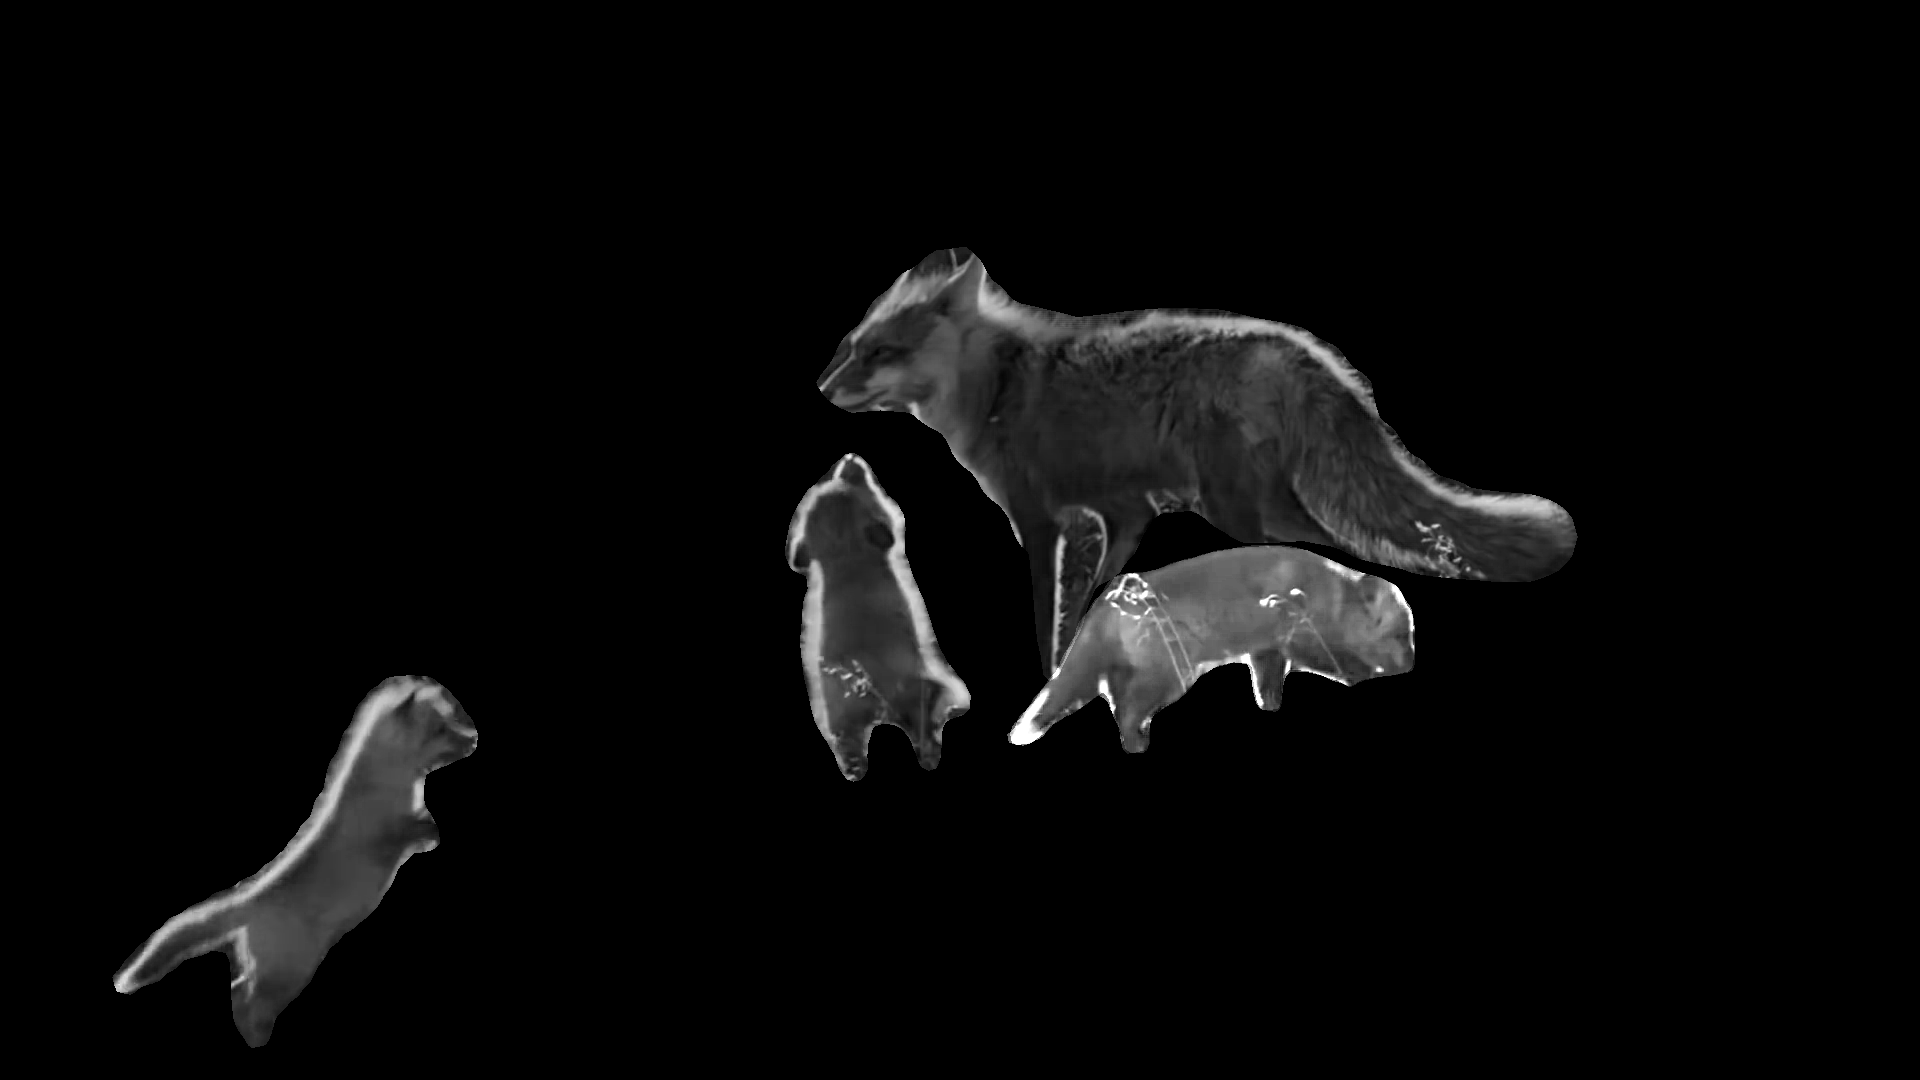
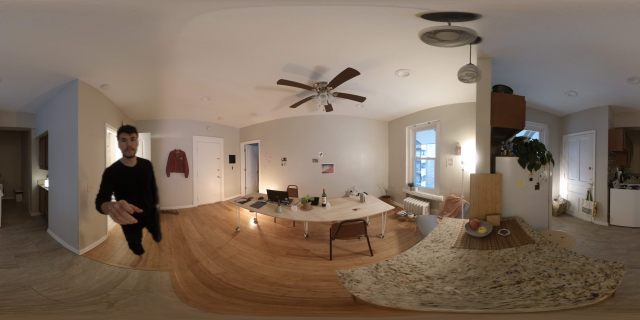
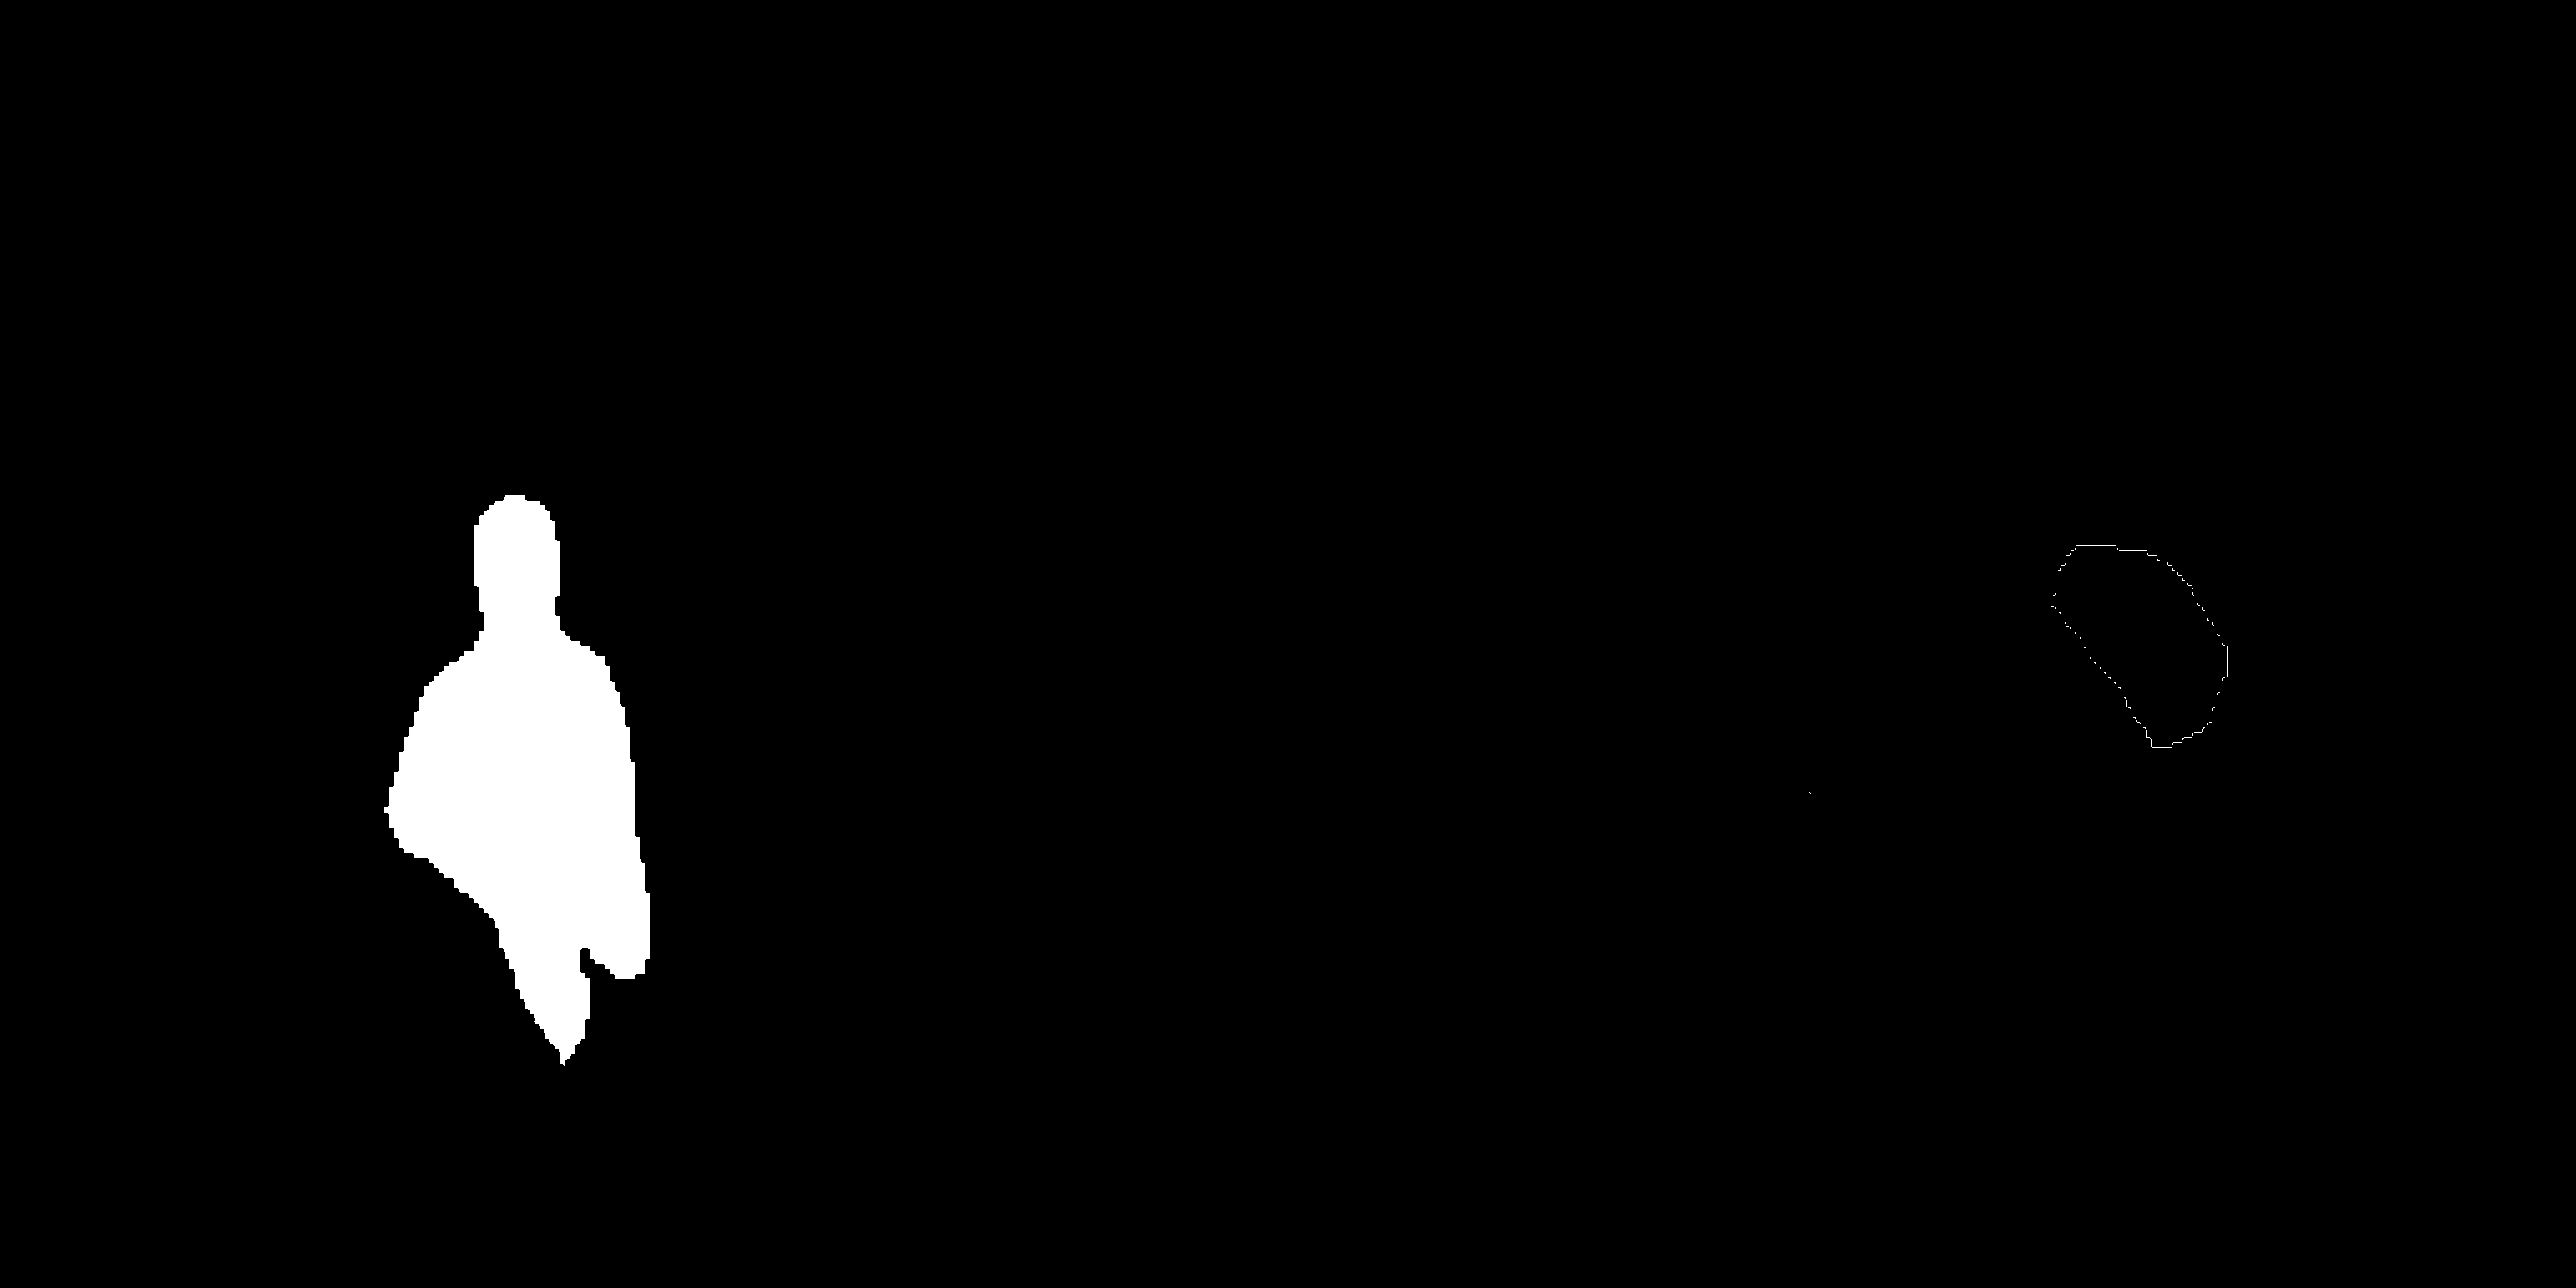
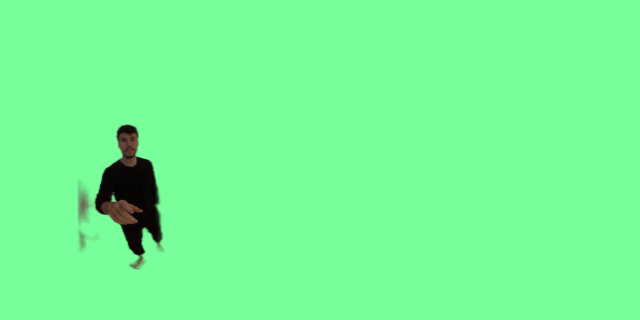
I’ve managed to segment with color and can also export the images with alpha data. It exports images with a given tag to look for (using the COCO dataset). The plan now is to take the images into something like PIL and collage them there. I can also move towards being more selective about frames chosen.

Spaces Of Quarantine – Project Info

The Project:

The goal of this project is to create a tiled map of our spaces of quarantine using photogrammetry and high resolution 3d renderings. A ‘spaces of quarantine’ is a 4 walled area where you’ve spent a ton of time during this crisis. This instructional page will walk you through the steps to generate and share a model of your space. If you have any questions at all feel free to reach out to me via email or any other means.

Examples:

Photogrammetric scan of my space of quarantine:

High resolution rendering of my space from above:


What to do:

  1. Download and get to know the display.land app
    1. Download app
    2. Watch Intro Video
  2. Do some test scans. Below are some key pointers for photogrammetry
    1. Try to prevent shift in light, like shadow and fast moving light sources
    2. Do many sweeps of an object
    3. Move the camera around an object or over a surface — we want to get as many angles as possible on stuff
    4. Try to capture texture — the algorithm needs do be able to differentiate between points in the image, texture and variation in surface helps
    5. Avoid reflective surfaces — this really confuses things
    6. Be patient! It can take between 45 min to 5 hrs to process a model
  3. Scan your space of quarantine – this is the specific 4 walled space where you feel you’ve been spending a ton of time during this crisis.
  4. Share the model. Below are instructions on how to do this in app
    1. Hit share
    2. Press share 3d mesh
    3. Chose OBJ format
    4. Share via email with me (dbperry@andrew.cmu.edu)


Final Project Update

This project started out with the idea of using a fax machine to capture people’s experiences in quarantine. It’s shifted a little bit, so the direction I’m taking it now is to fax people a daily task that is generated by an AI. To generate these tasks, I’m using GPT-2.

So far, I’ve trained a GPT-2 algorithm off of a dataset of 101 sample questions I wrote. So far, I’ve experimented with a number of variables to try to tweak the text generator, but it’s only spitting out questions directly from the source material.

a subsection of the sample questions I wrote.


An example of output from GPT-2. All of these questions are lifted in full from my 101 sample questions.


Where I’m going from here:

I need to continue tweaking the GPT-2 to get new questions output from it. After that, I need to work on automating faxes so that I can send these questions out.

WIP

A house ghost trying to pass time.

Questions

  • What should be the format of presentation?
    • A video essay, or video poem? Spoken words and ambient sound accompanying the videos?
    • An interactive web game?

Work In Progress April 21st

I have been experimenting with different ways of implementing the 3D rolling shutter effect using the Intel RealSense depth camera. So far I’ve been able to modify an existing example file, which allows you to view live depth feed using the Python library.

The following is what the output looks like raw from the camera. As you can see it displays a point cloud of the recorded vertices.

From here I wrote a function to modify the vertices being displayed in the live view. Vertices from each new frame get positioned in a queue based on their distance from the lens, and the live view only shows points at the beginning of the queue. After each frame this queue gets shifted so that vertices farther from the camera get fed to the live view a little while after the vertices that are right in front of it.

This video shows the adjustments made to the 3D vector array, which isn’t reflected by the color map, resulting in this interference color pattern. In this example the sampling is reversed so that farther vertices appear sooner than closer vertices.

The main issue I’ve come across is the memory usage of doing these computations live. This clip was sped up several times to get that fluidity of motion because of the dropped frame rate. The next thing I plan on doing is getting the raw data into Unity to make further changes with the previous code I wrote.