Jonathan Perez Looking Outwards 7

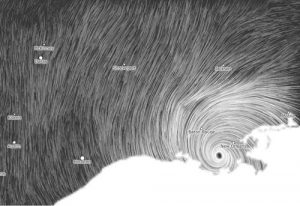
wind map of hurricane isaac

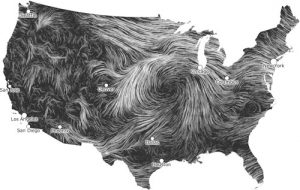
This is a project called Wind Map, by Martin Wattenburg. It takes in surface wind data from the National Digital Forecast Database once per hour, and generates these images based off of that information.

What I enjoy about this project is how it bridges the gap between informational and emotionally representative. Looking at these images, I can both see what the wind patterns were like in that moment and feel the emotion of that wind.


I believe that, when representing information, there is an opportunity to represent much more than just numbers. I almost feel like saying there is a humane obligation to representing more than just numbers… information has real impact in peoples lives, and thus has an emotional quality to it on some scale. Maybe a good example (though maybe a bit extreme) is death counts. Seeing a bar graph of death counts in different wars takes all of the humanity out of that information.

SaveSave

hannahk2-Project-07

sketch

//Hannah Kim
//Section A
//hannahk2@andrew.cmu.edu
//Project-07

var nPoints = 100;
var EPITROCHOID = 0; // Cartesian Parametric Form  [x=f(t), y=g(t)]
var CRANIOID = 1; // Polar explicit form   [r =f(t)]
var curveMode = EPITROCHOID;

var numObjects = 10;
var centerX;
var centerY;
var angle = 0;
var distance = 100;

function setup() {
// creates canvas
createCanvas(500, 500);
centerX = width/2;
centerY = height/2;
noStroke();
ellipseMode(CENTER);
}

function draw() {
background(0, 0, 0, 20);
// draw the frame
fill(0); 
stroke(255, 0, 0, 40);
noFill(); 
rect(0, 0, width-1, height-1); 

// draw the curve and rotate at different angles
push();
translate(width / 2, height / 2);
drawecurve();
rotate(PI/3.0);
drawecurve();
rotate(2*PI /3.0);
drawecurve();
pop();

//function to draw the curve
function drawecurve() {
    var x;
    var y;
  
    var a = 70.0;
    var b = a / 2.0;
    var h = constrain(mouseY / 20.0, 0, b);
    var ph = mouseX / 80.0;
    
    beginShape();
    for (var i = 0; i < nPoints; i++) {
        var t = map(i, 0, nPoints, 0, TWO_PI);
        
        x = (a + b) * cos(t) - h * cos(ph + t * (a + b) / b);
        y = (a + b) * sin(t) - h * sin(ph + t * (a + b) / b);
        vertex(x, y);
    }
    endShape(CLOSE);
}

var angleObject = 360/numObjects;
	//creates for loop which creates ellipses
	for (var i=0;i<numObjects ;i++) {
	angle = frameCount;
	//makes the distance between the ellipses change according to mouseX
	distance = sin(radians(mouseX))*150;
	var posX = centerX + distance *cos( radians(angleObject*i + angle) );
	var posY = centerY + distance *sin( radians(angleObject*i + angle) );
		//creates different curves and lines
		//makes one curve grow in width depending on mouseY
		//changes size of curves based on var posX and posY
		fill(255, 0, 0, 0);
		ellipse(posX, posY, 10, 10);
		stroke(255, 0, 0, 40);
		strokeWeight(1);
		line(centerX, centerY, posX, posY);
		line(centerX, centerY, posX-100, posY-100);
		line(centerX, centerY, posX+100, posY+100);
	 	//ellipse(posX, posY, mouseY, 100);
		ellipse(posX, posY, 200, 200);
	}
}

I really enjoyed making this project and playing with the different parameters of the curves. I tried to make something resembling a rotating planet/orb.

Ziningy1 – section c – looking outward 07


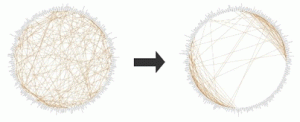
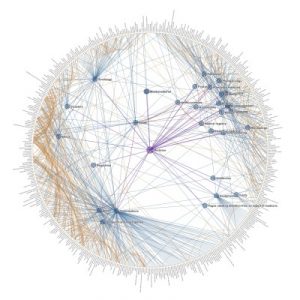
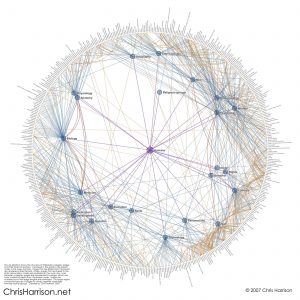
Chris Harrison, CMU HCII professor, is one of the professors I admired in CMU. While I always stalking the projects he lead of the Future Interface Group, I was surprised to find out about some of his amazing data visualization project. The Cluster Ball project is a data visualization he made to represent the structure and interconnection of wikipedia pages. Centered in the graph is a parent node. Pages that are linked from this parent node are rendered inside the ball. Finally, pages that are linked to the latter (secondary) nodes are rendered on the outer ring. Links between category pages are illustrated by edges, which are color coded to represent their depth from the parent node. I found it very intriguing that how Prof Harrison managed to create order and structure out of the extremely chaotic wikipedia pages. The way of visualization not only shows how topics are forming topics groups and the degree of linkages, but also reflect the way people organize informations through seeing where the fields diverge and intersect. The visualization can also presented which area of topics may have more concern from the public(more linkages), and which topics may be omitted(less clustered).

keuchuka – project – 07

project7

//Fon Euchukanonchai
//15-104 Section A
//keuchuka@andrew.cmu.edu
//Project-07

var nP = 100;

var colorR;
var colorG;
var colorB;

var add = 0;
var plus = 0
var value = 0;


function setup() {
    createCanvas(400, 400);

}


function draw() {
	
	//random color values for background
	var rColor1 = random(150, 255)
	var rColor2= random(200, 255)

	// mapping colors to mouseX for the three blobs and blobs that radiate
   	var mC = map(mouseX, 0, 400, 0, 300)

   	var bOne = map(mC, 0, 400, 80, 90) 
	var bTwo = map(mC, 0, 400, 45, 48)
	var bThree = map(mC, 0, 400, 90, 100)

	var bBehind = map(mC, 0, 200, 0, 100)

	//setting background to random colors
    background(255, rColor1, rColor2, mouseX/50);
    
    // blobs that radiate
	Curve(bBehind, 0+value, 255, 0+value, 255, 10+add, 0, 0, 300, mouseY/130);
	Curve(bBehind, 255, 255,0+value, 255, 10+add, 0, 150, 0, mouseY/170);
	Curve(bBehind, 0+value, 255, 255, 255, 10+add, 0, 400, 250, mouseY/150);

	//blobs 
	Curve(bOne, 255-value, 255, 255-value, 255, 100-plus, 0, 0, 300, mouseY/140);
	Curve(bTwo, 255, 255, 255-value, 255, 100-plus, 0, 150, 0, mouseY/170);
	Curve(bThree, 255-value, 255, 255, 255, 100-plus, 0, 400, 250, mouseY/150);

	//if mouse is pressed, the whites and colors are flipped
	if (mouseIsPressed){
		plus = 70;
		value = 255
		add = 10

		} else {
		plus = 0 
		value = 0 
		add=0
	}


}


//function to build blob

function Curve(a, colorR, colorG, colorB, Scolor, trans, sW, mX, mY, ph) {

    var x;
    var y;
    
    // setting variables to change size, blob shape, and rotation
    var b = a / 2.0;
    var k = constrain(mouseX, 0, 400)
    var h = map(k, 0, width, 0, b-10);

    strokeWeight(sW);
    stroke(Scolor);

    //colors are parametric
    fill(colorR, colorG, colorB, trans);
    
    // blobs are variable in size, blob shape, rotation, and location
    beginShape();
    for (var i = 0; i < nP; i++) {
        var t = map(i, 0, nP, 0, TWO_PI);
        
        x = (a + b) * cos(t) - h * cos(ph + t * (a + b) / b);
        y = (a + b) * sin(t) - h * sin(ph + t * (a + b) / b);
        vertex(mX+ x,  mY+ y);
    }
    endShape();   
}

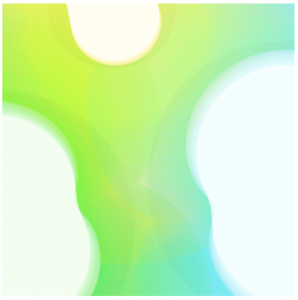
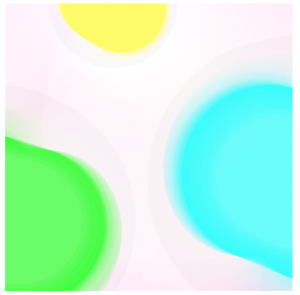
With this project, I wanted to create “blobs” that move in subtle ways. The example that looked like some bacteria inspired this sort of movement, therefore I decided to go with polar curve for my project. I realize that the few parameters I could work with were rotation, size, color, location, and the small changes of the shape. I have the mouse react to some of these parameters so they look like they are changing but in a very subtle, bacteria like way. These blobs also had potential coming together, so I had them change in size to look like they “radiate” color to mix and become a gradient. The last layer was to have the colors flip when the mouse is clicked, but otherwise it works the exact same way. The two states I captured were the colors, as I think this is the main change, most obvious change. But the change of the curve is what gives the sensibility to the whole project.
Jonathan Perez Project 7

sketch

//Jonathan Perez
//Section B
//jdperez@andrew.cmu.edu
//Project 7

var a = 100 // inner asteroid diagonal radius
var b = 100 // second inner asteroid diagonal radius
var a2 = 200 //outer astroid diagonal radius
var b2 = 200 //second outer astroid diagonal radius
var lineArrayX = [a, a, a, a, a, a, a, a, a, a, a, a, a, a, a, a, a]
var lineArrayY = [0, 0, 0, 0, 0, 0, 0, 0, 0, 0, 0, 0, 0, 0, 0, 0, 0]
var lineLength = 30
var lineSize = 5
function setup() {
    createCanvas(480, 480);
    background(255);
}

function draw() {
    background(255);
    mouseDistX = dist(mouseX, height/2, width/2, height/2); //X distance from center
    mouseDistY = dist(width/2, mouseY, width/2, height/2); //Y distance from center
    a = map(mouseDistX, 0, 240, 0, 150) //maps X distance from center to max a value
    b = map(mouseDistY, 0, 240, 0, 150); //maps Y distance from center to max b value
    a2 = map(mouseDistX, 0, 240, 0, 300); //maps X distance from center to max a2 value
    b2 = map(mouseDistY, 0, 240, 0, 300); //maps Y distance from center to max b2 value
    traceAstroid(height/2, width/2, a, b);
    drawAstroid(height/2, width/2, a2, b2);
}


//drawing line asteroid
function traceAstroid(x, y, a, b) {
    asteroidX =  a * pow(cos(millis()/1000), 3);// x parametric for an astroid x = acos^3(t)
    asteroidY =  b * pow(sin(millis()/1000), 3);// y parametric for an asteroid y = asin^3(t)
    push();
    translate(x, y);
    for(i = 0; i < lineArrayX.length; i++) {
        fill(255 - i*255/lineArrayX.length); //fades line into background
        noStroke();
        if(i < lineArrayX.length - 1){ //if not the leading point
            //trails behind the leading point
            lineArrayX[i] = lineArrayX[i+1] 
            lineArrayY[i] = lineArrayY[i+1]
        } else { //if the leading point
             //next X and Y coordinates
            lineArrayX[i] = asteroidX
            lineArrayY[i] = asteroidY
        }
        ellipse(lineArrayX[i], lineArrayY[i], lineSize, lineSize);
        ellipse(-lineArrayX[i], -lineArrayY[i], lineSize, lineSize);
    }
    pop();
}


//outer asteroid
function drawAstroid(x, y, a2, b2) {
    push();
    translate(width/2, height/2);
    rotate(TWO_PI/8); //eighth rotation so that inner astroid touches the inside walls
    for(i = 0; i < 472; i++) { // 472 stops the astroid exactly halfway down the vertical sides
        asteroidX2 = a2 * pow(cos(i/200), 3); // x parametric for an astroid x = acos^3(t)
        asteroidY2 = b2 * pow(sin(i/200), 3); // y parametric for an asteroid y = asin^3(t)
        fill(0);
        noStroke();
        ellipse(asteroidX2, asteroidY2, lineSize, lineSize);
        ellipse(-asteroidX2, -asteroidY2, lineSize, lineSize);
    
    }
    pop();
}

I thought this project was super fun… I haven’t had the chance to do any sort of geometry or math in a while, and this was a nice way to sort of flex those old muscles.

To start off, I just clicked around on the geometry site provided for us. I was just looking for a curve that both looked feasible to implement (with out smoke coming out of my ears) and aesthetically interesting. Eventually I stumbled across the astroid, and decided, sure, let’s use that.

After that, I just started playing around with how I could draw the shape and modify it. I knew right off the bat that I wanted to do something with a trailing point… so that was actually the first part I coded. After that I added the second rotated astroid (to make the whole image an astroid evolute).

On their own, these shapes aren’t super exciting. Originally, since the astroid is a hypocycloid, I was going to play around with the number of points in the curve (instead of just four points). Instead, I went a rotation direction instead. Well, I say rotation, but nothing is truly rotating in the image. In the code, the distance between diagonal points is being altered, to create the illusion of rotation. I thought that was pretty cool, especially with the trailing point moving around. To me this animation feels like a card turning around on one point.

Ziningy1-Section C- Project 07 Curves

In this project, I chose the Astriod and Deltoid curve equations. I was originally trying to combine the two curves, yet I found it visually too clustered. So I made it alternating when mouse is pressed. Basically, the mouse movement will determine the the rotation speed, the size and form of the curves. I also modified the transparency so that the curves will be brighter when it is bigger in shapes and darker when is smaller, which I intended to create a sense of perspective in the space.

sketch

//Zining Ye 
//15104 lecture 1 recitation C
//ziningy1@andrew.cmu.edu 
//Project-07

var t=1; 
var state; //set state for changes when mouse pressed 

function setup() {
    createCanvas(480, 480) 

    state = 1; //start with state 1 
    
}

function draw() {
    background (0);
    var offset=0; 

    translate(width/2, height/2-offset); //move curve to center 
    angleMode(DEGREES);

    t+=1+(mouseX+mouseY)/40;  //change rotation speed according to mouse position
    rotate(t); //rotate around center 
    pattern(); // call pattern function and draw the shape
   
   
}


function hypocycloid(){
    var a= 30; 
    var points=500; 


    var n = map(mouseX,0,width,70,150); //map the changing ranges  
    

    noFill();
    stroke(255,255,255,(mouseX+mouseY)/8); // change opacity with mouse movement 

    beginShape();
    
    for (var i=0; i<points; i++){

        //map angle changing range to 0-360 degree
        var t=map(i, 0, points, 0, 359);

        //curve equation 
        var x=1/3*n*(2*cos(t)+cos(2*t));
        var y=1/3*n*(2*sin(t)-sin(2*t));


        vertex(x,y);
    }

    endShape(CLOSE); 
}

function astroid(){

    var points=500; 

    var a=map(mouseX,0,width,5,40); //map the size change range 


    noFill();
    stroke(255,255,255,(mouseX+mouseY)/8); //change opacity with mouse movement 


    beginShape();
    for (var i=0; i<points; i++){

        //map angle changing range to 0-360 degree 
        var t=map(i, 0, points, 0, 359);
        
        //curve equation 
        var x=3*a*cos(t)-a*cos(3*t);
        var y=3*a*sin(t)-a*sin(3*t)

    
        vertex(x,y);

    }
    endShape(CLOSE);
}


function pattern(){


    for(var i=0; i<100; i++){ 
        
        //set x,y position that it goes in draw the shapes in a circle
        var x=5*cos(3.6*i);
        var y=5*sin(3.6*i);

        translate(x,y) //change postiion to draw shapes 


        //determine which curve to present 
        if (state == 1){
            hypocycloid();
        } else {
          astroid();  
        }
    }
}


function mousePressed(){

    //when mouse pressed, the state changes, so the curve chaneges. 
    if (state == 1){
    state = 2;
    } else {
        state = 1;
    }
}


hqq – LookingOutwards-07

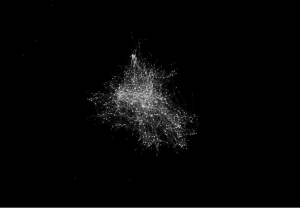
Above: Zoomed and static network visualization of Twitter connections by Santiago Ortiz.

Santiago Ortiz, founder of Moebio Labs, is a visual scientist and designer, whose work uses expressive network theory to demonstrate physical and metaphorical connections between people and their surroundings. Ortiz believes that data visualization is most effective not in the form of static charts and graphs, but as fluid, moving pieces of art. Ortiz’s analysis of connections on Twitter between different followers in different locations exemplifies this belief perfectly. The analysis considers a variety of metrics to highlight important information on who is tweeting, who they connect with, how often they connect, and even why they connect the way they do. The visualization uses a series of nodes and lines to create webs between different users who connect with each other. Subtle nuances such as line thickness and node size highlight other important statistics such as the amount of communication and popularity. Moreover, the analysis is fluid. From the webpage, you can zoom in, click, and slide metrics to reveal more information.

ljkim project 07

sketch

function setup() {
    createCanvas(480, 480);
    frameRate(10);
}

function draw() {
    background("#9CE2F7");
    fill(255, 255, 255, 64);
    translate(width/2, height/2); //moves lines to center of the canvas

    
    // draw the circle as a starburst
    push();
    for (var i = 0; i < 20 ; i++) {
        var theta = map(i, 0, 20, 0, TWO_PI);
        var px = 50 * cos(theta);
        var py = 50 * sin(theta);
        line(0, 0, px, py);
    }
    pop();
}

Project 07 – Yugyeong Lee


sketch

//Yugyeong Lee
//Section B
//yugyeonl@andrew.cmu.edu
//Project-07

var nPointsA= 600;
var nPointsB= 200;
var nPointsC= 800;
var x;
var y;
var constrainX;

function setup() {
    createCanvas(480, 480);
}

function draw() {
	//ghosted background changing color based on mouseX
	var constrainX = constrain(mouseX, 0, width); //constraining mouseX in the page
	var r = map(constrainX, 0, width, 100, 39);
	var g = map(constrainX, 0, width, 43, 15);
	var b = map(constrainX, 0, width, 107, 54);
    background(r, g, b, 40);
    //Hypotrochoid & Ellipse
    push();
    translate(width/2, height/2);
    drawHypotrochoid();
    drawEllipse();
    pop();
    //Ranunculoid (only appears if mouseX is on left three quarter of page)
    if (constrainX < 3*width/4) {
   		push();
    	translate(width/2, height/2);
    	//mapping the angle of rotation based on mouseX
    	var angle = map(constrainX, 0, width, 0, 4 * TWO_PI);
		rotate(angle);
    	drawRanunculoid();
    	pop();
    }
}

function drawHypotrochoid() {
    constrainX = constrain(mouseX, 0, width); //constraining mouseX in the page
	var n = map(constrainX, 0, width, 0, .5);
    var a = 225;
    var b = n*a;
    var h = constrain(mouseY/2, 0, b);

    noFill();
    //change strokeWeight based on mouseX
    var s = map(constrainX, 0, width, .1, 2);
    //change stroke color based on mouseX
    var c = map(constrainX, 0, width, 255, 100);
    stroke(c)
    strokeWeight(s);
	beginShape()
		for (var i = 0; i < nPointsA; i++) {
			var t = map(i, 0, nPointsA, 0, 6*TWO_PI);
			x = (a - b)*cos(t) + h*cos((a - b)/b*t);
			y = (a-b)*sin(t) + h*sin((a-b)/b*t);
			vertex(x, y);
		}
	endShape(CLOSE);
 }

 function drawRanunculoid() {
    constrainX = constrain(mouseX, 0, width); //constraining mouseX in the page
    var a = 30;
    noStroke();
    //change fill oppacity based on mouseX
    var opacity = map(constrainX, 0, width, 10, 50);
    fill(255, 255, 255, opacity);
	beginShape()
		for (var i = 0; i < nPointsB; i++) {
			var t = map(i, 0, nPointsB, 0, TWO_PI);
			x = a*(6*cos(t)-cos(6*t));
			y = a*(6*sin(t)-sin(6*t));
        	ellipse(x, y, 5, 5); //ellipse at each points
		}
	endShape(CLOSE);
 }

function drawEllipse() {
    constrainX = constrain(mouseX, 0, width); //constraining mouseX in the page
    var a = 270;
    var b = 270;
    noFill();
	beginShape()
		for (var i = 0; i < nPointsC; i++) {
			var t = map(i, 0, nPointsC, 0, 6*TWO_PI);
			x = a*cos(t);
			y = b*sin(t);
			//ellipse at random position x and y range
        	ellipse(x+random(-50, 50), y+random(-50, 50), 3, 3);
		}
	endShape(CLOSE);
 }

I used three different curves for this interactive design: hypotrochoid, ranunculoid, and ellipse. The final product is interactive in that not only does the design react to position Y of the mouse location, the curves, the angle it rotates, stroke weight, stroke color, stroke opacity and background color all react to position X of the mouse location. Because of the circular movement of the other two curves, I wanted to create a “night-sky-with-blinking-stars” effect through creating an ellipse in which points are randomly positioned within a limited range with white blinking circles. The color palette was also chose to reflect the night sky atmosphere.

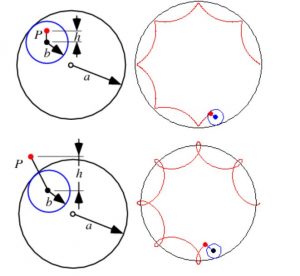
how Hypotrochoid & Ranunculoid works

aerubin-Project-06-Curves

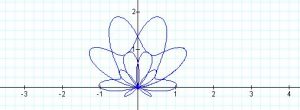
For this project, I was inspired by the polar curves we learned in calculus. I remember drawing them on the graphing calculator and adding them together to make cool designs. This polar curve reminds me of part of a flower, so I rotated it around itself to create one. The flower grows when the mouse is moved from left to right, and the number of petals change when the mouse is moved from top to bottom. In addition, I also added a bee that bounces around to establish the flower design. The bee can also be hidden behind the flower if the mouse is far enough to the right.


Equation to the polar curve pictured above and utilized to make the petals for the flower.

sketch

//Angela Rubin
//Section C
//aerubin@andrew.cmu.edu
//Project-07-Curves

var turn = 0;
var beeX = 200; //x position of bee
var beeY = 200; //y position of bee
var xvel = 0;
var yvel = 0;

function setup() {
    createCanvas(400, 400);
    xvel = random(-4,4); //x velocity of bee
    yvel = random(-4,4); //y velocity of bee
    frameRate(5);
}

function draw() { 
    background(178, 216, 203);

    //moves bee
    push();
    translate(beeX-200, beeY-200);
    makeBee();
    pop();

    beeX+= xvel;
    beeY+= yvel;

    //makes bee bounce off edges
    if (beeX<35 || beeX>375) {
        xvel = -xvel;
    }

    if (beeY<50 || beeY>375) {
        yvel = -yvel;
    }

    //makes the curve repeat around itself to make a flower
    fill(249, 212, 222);
    stroke(255);
    push();
    translate(width/2, height/2);
    //mouseY controls the number of times the curve is repeated
    for (var rot = 0; rot < 360; rot+= 45-mouseY/40) {
        makeFlower(rot);
    }
    pop();
}

function makeFlower(turn) {
    //mouseX controls the size of the flower
    var a = 10 + mouseX/4;
    beginShape();
    rotate(radians(turn));
    for(var t = 0; t < 2*TWO_PI; t+= .01) {
        //equation for curve
        var r = a*sin(t)+(a*sin(5*(t/2)));
        //polar curve to x,y plane equation
        var x = r*cos(t);
        var y = r*sin(t);
        vertex(x, y);
    }
    endShape();
}

function makeBee() {
    strokeWeight(1);
    stroke(0);

    //wings
    push();
    fill(228-20, 242-20, 251-10);
    rotate(radians(-20));
    ellipse(120, 230, 20, 40);
    pop();

    push();
    fill(228, 242, 251);
    rotate(radians(20));
    ellipse(200+50, 230-140, 20, 40);
    pop();

    //body of bee
    fill(253, 190, 44);
    ellipse(200, 200, 50, 40);

    //stinger of bee
    fill(0);
    triangle(175, 195, 175, 205, 165, 200);

    //eye
    ellipse(220-7, 198, 7, 7);

    //stripes
    noFill();
    strokeWeight(3);
    stroke(0);
    arc(160, 210-8, 70, 70, 12, 13);
    arc(160+10, 210-7, 70, 70, 12-.1, 13);
    arc(160-10, 210-7, 70, 70, 12+.1, 13-.1);

    //smile
    strokeWeight(2);
    arc(220, 210-8, 20, 20, 1.5, 2.5);

    //antennae
    arc(220+5, 210-20, 20, 20, 3.7, 4.5);
    arc(220+5+3, 210-20+2, 20, 20, 3.7, 4.5);

    //legs
    arc(220-30, 210+20-6, 20, 10, 12.7-.5, 13.5-.7);
    arc(220-30+6, 210+20-6, 20, 10, 12.7-.5, 13.5-.7);
    arc(220-30-6, 210+20-6-2, 20, 10, 12.7-.5, 13.5-.7);
    arc(220-30-12, 210+20-6-4, 20, 10, 12.7-.5, 13.5-.7);
}