Looking Outwards-07-ssontag-Selfiecity

This work by Moritz Stefaner compiled 3200 selfies taken by people from around the world to analyze the selfie phenomenon of our generation. They “Rich media visualizations (imageplots) assemble thousands of photos to reveal interesting patterns.” There are many parts of this project that analyze different aspects of each selfie and how each selfie was taken. Some of these demographics include, place taken, age of the selfie takers, and gender of the selfie takers. They also analyzed each photo to see how the photo was taken. Whether the person is looking up, down, left or right. It also analyzed their emotions, the tilt of their head, how open their mouth was, and whether or not they are wearing glasses. All of this information was then stored and graphically represented beautifully with sheets of infographics.

The Documentation

Here is a video that compiled their work.

nayeonk1-LookingOutwards-07

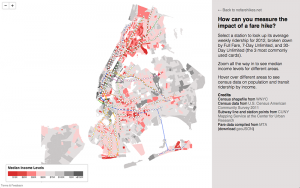
Ingrid Burrington is awesome writer, artist and computational information visualizer. I admire her brilliant works including writings and arts besides that fact that she’s also a computer data researcher. she writes about computers, politics, and art. Some of her works use data to creates images and others are computer generated arts that comes with various forms such as installation art or graphic design.
she creates a cloud as of networked infrastructure with her writings. She thinks about how the internet works and a lot of pieces of material infrastructure that goes into creating our fantasy of the cloud as nowhere and everywhere at the same time.

Measuring The Impact of A Fare Hike
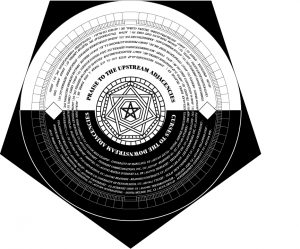
The Realm of Rough Telepathy

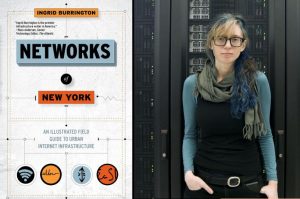
She has published a book called ‘Networks of New York’ which sketches the physical extrusions of the internet into New york City’s streets and buildings, and makes especial note of how much of that infrastructure has been built as aprt of the post 9/11 surveillance network that NYC has erected over the past 15 years.

You can check more of her works here
Ingrid Burrington Website

adev_LookingOutwards_07_data_visualisation

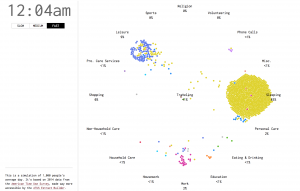
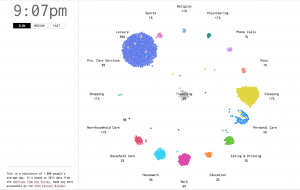
A Day in the Life of Americans

A Day in the Life of Americans
by NATHAN YAU, Flowing Data

I really love this data visualisation because its really dynamic, aesthetic and informative. It also has this interesting bird’s eye view of people and how they live their lives. It has this sense of removal and perspective. It really is about people just being people in their daily activities and movement. It’s also really interesting to see rush hours where activity rapidly changes like 9:00 am or 5:00 or 6:00 pm; there literally is a visual rush of little dots across the page.

Its so fascinating because the designer has managed to make everyday activities and mundane movements extremely engaging. It also has this strange voyeuristic quality to it, where you literally watch people do very normal things. I feel like I could watch this for hours and never be bored. It is satisfying and yet makes me want to know more about these individual trends and movements.

gyueunp – Looking Outwards 07

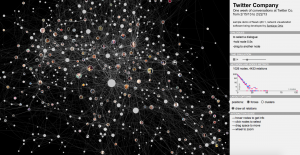
This is a sample demo that was created using Newk, a browser-based application for Networks Visualization. It is currently being developed by Santiago Ortiz with the aim of presenting a visualization of the network of Twitter conversations of the company’s employees.

To the right of the network visualization are sections that provide information for the viewers, such as “network and nodes metrics.” There is also an interaction guide that succinctly outlines the instructions on how to obtain information through the visualization. The intersecting lines are joined by nodes, which are photos of employees. They change colors as the cursor hovers over the nodes, displaying the interaction among the employees in a single glance.

This example is fascinating in that it presents us with information that could be personal to the employers. The fact that this seemingly complex network is only a week of conversations makes me rethink about the significance of our online conversations that we often take for granted, due to its simple accessibility.

ljkim looking outward 07

http://https://www.vam.ac.uk/bigglassmic/
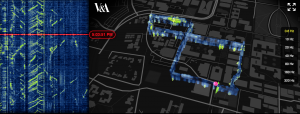
Image of Big Glass Microphone

Big Glass Microphone looks at infrastructure in ways that our eyes can’t see. By visualizing the vibrations in a five kilometer long fiber optic cable buried underneath the campus of Stanford University. Fiber optic cables are used to send signals from one another. I’m assuming an algorithm is used to read the vibrations then to interpret it to visuals. In the image above, you can see a building of Stanford. I appreciate this use of computational information visualization because it’s use of fiber optic in unconventional ways. The beauty of re-using resources in different ways is now more than crucial in a resource-depleting time period.

danakim-Project-07

sketch

//Dana Kim
//danakim@andrew.cmu.edu
//Section D
//Project-07

var nPoints = 30;

function setup() {
  createCanvas(480, 480);
}

function drawCurve() {
  var cx = constrain(mouseX, 100, 400);
  var cy = constrain(mouseY, 100, 400);

  noFill();
  beginShape();
  for(var i = 0; i < nPoints; i++){
    strokeWeight(random(.5,3.5));
    var t = (i/1.5)*500; //determines the angle of the vertexes
    var a = (cx/.5); //determines the scale of curve
    var px = (1/cos(t)+(a*cos(t)))*cos(t);
    var py = (1/cos(t)+(a*cos(t)))*sin(t);
    stroke(cx, 0, cy);
    ellipse(px, py, 5, 5); //creates ellipses along points of curve
    stroke(0, cx, cy);
    vertex(px*1.5, py*1.5); //creates curves
  }
  endShape(CLOSE);
}

function draw() {
  drawCurve();
}

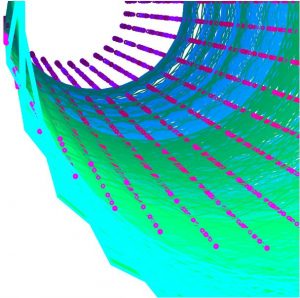
I used the Conchoid of de Sluze roulette curve for this project. I made two different, yet connected, objects within the drawing with this curve. One of the set of curves was written to be made of ellipses that are placed on points along the curve. The second set just draws the curves as they are. The scale and colors were set to change as the mouseX and mouseY changes.

rkondrup-project-07-Composition-with-Curves

sketch

// ryu kondrup
// rkondrup@andrew.cmu.edu
// section D
// project-07-Composition-with-Curves


// http://mathworld.wolfram.com/DevilsCurve.html
function setup() {
    createCanvas(480, 480);
    frameRate(20);
    //dark grey bg
    background(40);
    stroke(255);
    fill(40);
}

function draw() {
    //to move object to center and rotate
    push();
    translate(width / 2, height / 2);
    rotate(2*PI*mouseX/480)
    drawDevilsCurve();
    pop();
}

function drawDevilsCurve() {
        var bigRange = 100;
        var t = map(i, 0, bigRange, 0, 100);
        var b = map(mouseY, 100, height-100, 0, 50);
        var a = map(mouseX, 100, height-100, 0, 200);

//to draw actual devil's curve
    fill(40);
    beginShape();
    for (var i = 0; i < bigRange; i++) {
        var t = map(i, 0, bigRange, 0, 2*PI);
//x and y for parametric equation
        var x = cos(t)*sqrt((sq(a)*sq(sin(t))) - sq(b)*sq(cos(t))/(sq(sin(t))-sq(cos(t))));
        var y = sin(t)*sqrt((sq(a)*sq(sin(t))) - sq(b)*sq(cos(t))/(sq(sin(t))-sq(cos(t))));
        // change value with mouseposition
        fill(mouseX/2, mouseX/2, mouseX/2);
        // make outline slightly lighter than fill
        stroke(mouseX/2+20, mouseX/2+20, mouseX/2+20)
        //to draw each frame
        vertex(x, y);
    }
    endShape(CLOSE);

}

function mousePressed() {
    //to reset background on click
    background(40);
}

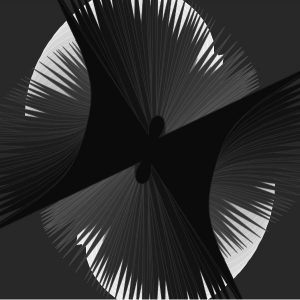
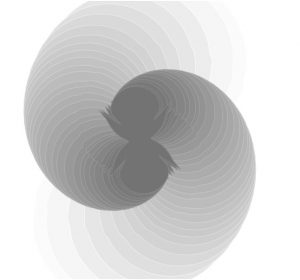
Before starting this project I assumed it would be relatively easy. Upon starting, however, I had an unexpectedly difficult time getting my code to display. After I finally did get it to display, it turned out that the curve I had chosen was not of the highest aesthetic quality, i.e. it looks like a chunky spider. Nevertheless, I decided to work with it, and ended up choosing a monochromatic color scheme as an experiment with changing gradients.

hyt-Project-07: Infinity Curve Composition

hyt-07-project

// helen tsui
// 15-104 section d
// hyt@andrew.cmu.edu
// project-07-composition-waves


function setup() {
    createCanvas(480, 480);
    background(44, 66, 81, 100);
}


function draw() {
    drawcochleoid();

}

function drawcochleoid() {
    // Eight Curve
    map(mouseX, 0, width, 0, 200);
    beginShape();
    //stroke(209, 104, 104); //red
    stroke(100 + mouseX / 2.5);
    strokeWeight(0.5);
    //fill(204 - i * 2, 46, 32);
    fill(0);
    //infinity
    translate(width / 2, height / 2);
    for(var i = 0; i < mouseX / 2; i += 0.5) {
        var a = 1.9 * i; 
        var t = 6 * i;
        var x1 = a * sin(t);
        var y1 = a * sin(t) * cos(t);
        var y2 = a * sin(t);
        var x2 = a * sin(t) * cos(t);
        vertex(x1, y1);
    }
    endShape();

    // vertical shape
    beginShape();
    for(var i = 0; i < mouseX / 2; i += 0.5) {
    var a = 0.9 * i; 
    var t = 12 * i;
    var y2 = a * sin(t);
    var x2 = a * sin(t) * cos(t);
    vertex(x2, y2);
    }
    endShape();
}


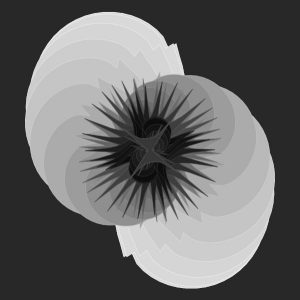
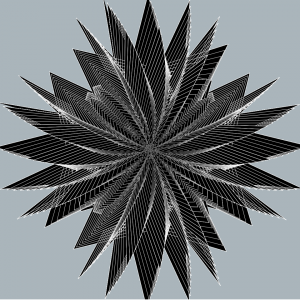
For this project, I browsed on the internet in search for parametric equations that could be embedded within the code, and after some search found the “infinite loop” sign that I was able to use. To create some dimensionality, I altered the color values in order to change the greyscale. Also, for the background part I happened to change values and created a similar “noise effect” as the background.

I also experimented with different proportions that led to different results, such as this one. If I had more time I wish to play with the details more to achieve a better landscape-like picture.

Nayeon-Project07-Curves

nayeonk1

//Na-yeon Kim
//15-104, B section
//nayeonk1@andrew.cmu.edu
//Project-07 (Composition with Curves)

//draw canvas
function setup() {
    createCanvas(480, 480);
}

//map the r, g, b color
function draw() {
    var r = map(mouseX, 0, width, 100, 255);
    var g = map(mouseY, 0, height, 0, 150);
    var b = map(mouseX, 0, width, 0, 255);
    noFill();
    background(0);

//Hypotrochoid changing color based on mouse cursor
    push();
    stroke(r, g, b, 50);
    strokeWeight(0.5);

    translate(width / 2, height / 2);
    drawHypotrochoid();
    pop();

//hypocycloid changing color based on mouse cursor
    push();
    stroke(b, r, g);
    strokeWeight(0.2);

    translate(width / 2, height / 2);
    drawHypocycloid();
    pop();
}

function drawHypotrochoid() {
//draw hypotrochoid
//http://mathworld.wolfram.com/Hypotrochoid.html
    var x;
    var y;
    var h = 400;
    var a = map(mouseX, 0, width, 0, 5);
    var b = map(mouseY, 0, height, 0, 1);
//x = (a - b) * cos t + h cos(((a - b) / b) * t)
//y = (a - b) * sin t - h sin(((a - b) / b) * t)
    beginShape();
      for(var i = 0; i < 500; i ++) {
        var angle = map(i, 0, 200, 0, 360);
        x = (a - b) * cos(angle) + h * cos(((a - b)) * angle);
        y = (a - b) * sin(angle) - h * sin(((a - b)) * angle);
        vertex(x, y);
      }
    endShape();
}

function drawHypocycloid() {
//draw hypocycloid
//http://mathworld.wolfram.com/Hypocycloid.html
    var x;
    var y;
    var a = map(mouseX / 2, 0, width, 0, 200);
    var b = map(mouseY / 2, 0, height, 0, 200);
//x = ((a - 1) * cos t) + ((a - 1) * cos t)
//y = ((a - 1) * sin t) - ((a - 1) * sin t)
    beginShape();
    for (var i = 0; i < 300; i ++) {
      var angle = map(i, 0, 100, 0, 6);
      x = ((a - 1) * cos(angle / 2)) + ((a - 1) * cos(angle * b));
      y = ((a - 1) * sin(angle / 2)) - ((a - 1) * sin(angle * b));
      vertex(x, y);
    }
    endShape();
}

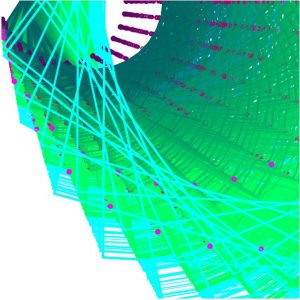
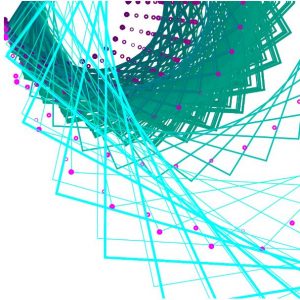
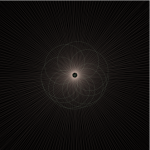
For this assignment, I looked through the Mathworld curves site first. And I realized that It’s been a while(I mean.. really….) to study any math so I need to start from very simple math stuff. I also got little help from some friends who are familiar with math to build a equation for this. After long time struggle, I finally managed to build a curves, and then I played it with fun! It was very hard to think about draw something with math, but after knowing the formula it was fun to play with numbers!
Here are some screenshot images from composition curves that I made.

NatalieKS-Project-07

This project was pretty difficult for me since I hadn’t worked with trig functions and parametric equations in over a year. Most of the time spent on this was just trying to figure out what the equations actually did when implemented in p5js, and understanding what i needed to change in order to get my desired result. I wanted to draw a little picture, and when I saw the ellipse evolute, it reminded me of the stars from Peter Pan. The star changes size and color as you move the mouse. I would’ve liked to try to create some kind of glow around the stars, and I tried using filter() and blur(), but both functions messed with the frame rate in a way that I didn’t know how to fix, so I abandoned the idea. I tried to reference this image, just because I liked the colors and shape. 

sketch2

//Natalie Schmidt
//nkschmid@andrew.cmu.edu
//Section D
//Project-07

//taken from examplde code
var nPoints = 100;
var R; //for color "r"
var G; //for color "g"
var B; //for color "b"

function setup() {
    createCanvas(300, 480);
    frameRate(20);
}

function draw() {
//draw the two stars
    background(22, 42, 67);
    push();
    translate(width - 70, height-400);
    drawLargeEllipseEvolute();
    pop();
    push();
    translate(width- 120, height - 350);
    drawLargeEllipseEvolute();
    pop();

    fill(255);
    textSize(24);
    text("Second star to the right", 25, 420);
    text("and straight on til morning!", 10, 450);
    //draw small random stars
    //modified code from
    //http://alpha.editor.p5js.org/nanou/sketches/rJ-EMpxa
    fill(255);
    var star = {x : 100, y : 50};
    star.x = random(0, width);
    star.y = random(0, height);
    ellipse(star.x, star.y, 4, 4);
    ellipse(star.x, star.y, 4, 4);
    //draw Peter Pan!
    drawPeter();
}

function drawLargeEllipseEvolute() {
//modified version of the example code
    var x;
    var y;
    var a = constrain(mouseX, 0, width);
    //map the value so it only expands a little
    var a1 = map(a, 0, 300, 0, 15);
    var b = constrain(mouseY, 0, height);
    //map the value so it expands only a little
    var b1 = map(b, 0, 300, 0, 15);
    //change colors with mouse
    R = map(mouseX, 0, width, 138, 255);
    G = map(mouseX, 0, width, 153, 255);
    B = map(mouseX, 0, width, 196, 255);

    fill(R, G, B);
    stroke(61, 80, 112);
    beginShape();
    for (var i = 0; i < nPoints; i++) {
        var t = map(i, 0, nPoints, 0, TWO_PI);

        x = ((sq(a1) - sq(b1))/a1) * pow(cos(t), 3);
        y = ((sq(b1) - sq(a1))/b1) * pow(sin(t), 3);
        vertex(x, y);
    }
    endShape(CLOSE);
}

function drawPeter() {
//draw Peter Pan!
    fill(0);
    //head
    ellipse(125, 225, 20, 20);
    push();
    //body
    translate(113, 252);
    rotate(35);
    ellipse(0, 0, 20, 40);
    pop();
    //left leg
    push();
    translate(98, 270);
    rotate(35);
    ellipse(0, 0, 7, 25);
    pop();
    //right leg
    push();
    translate(110, 275);
    rotate(35);
    ellipse(0, 0, 7, 25);
    pop();
    //left foot
    ellipse(91, 278, 8, 8);
    //right foot
    ellipse(107, 286, 8, 8);
    //left arm
    push();
    translate(102, 236);
    rotate(90);
    ellipse(0, 0, 8, 25);
    pop();
    //right arm
    push();
    translate(130, 250);
    rotate(90);
    ellipse(0, 0, 8, 25);
    pop();
    //peter pan hat!
    triangle(118, 216, 123, 196, 133, 221);
    //feather on hat
    stroke(4);
    line(120, 215, 115, 198);
}