mmirho – Project 07 – Curves

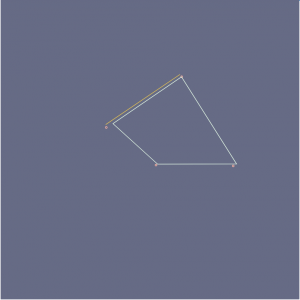
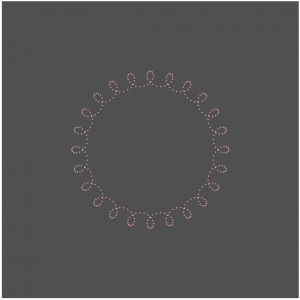
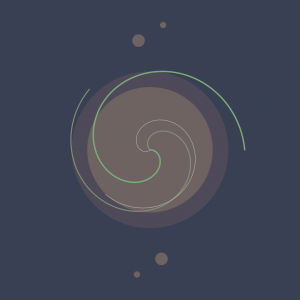
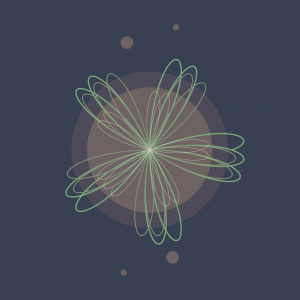
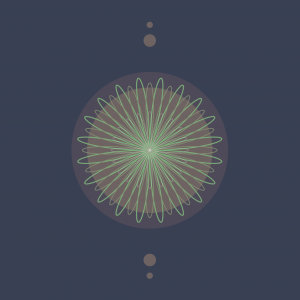
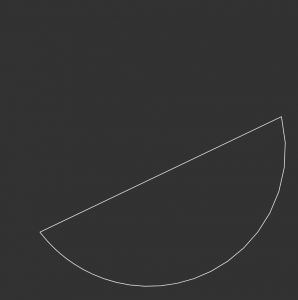
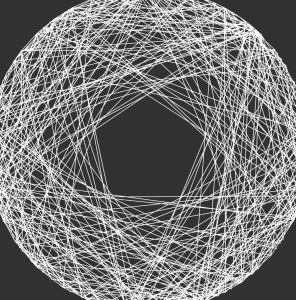
I fiddled with the math for a while, trying to identify a form I liked and eventually settled on a sort of an hourglass figure.

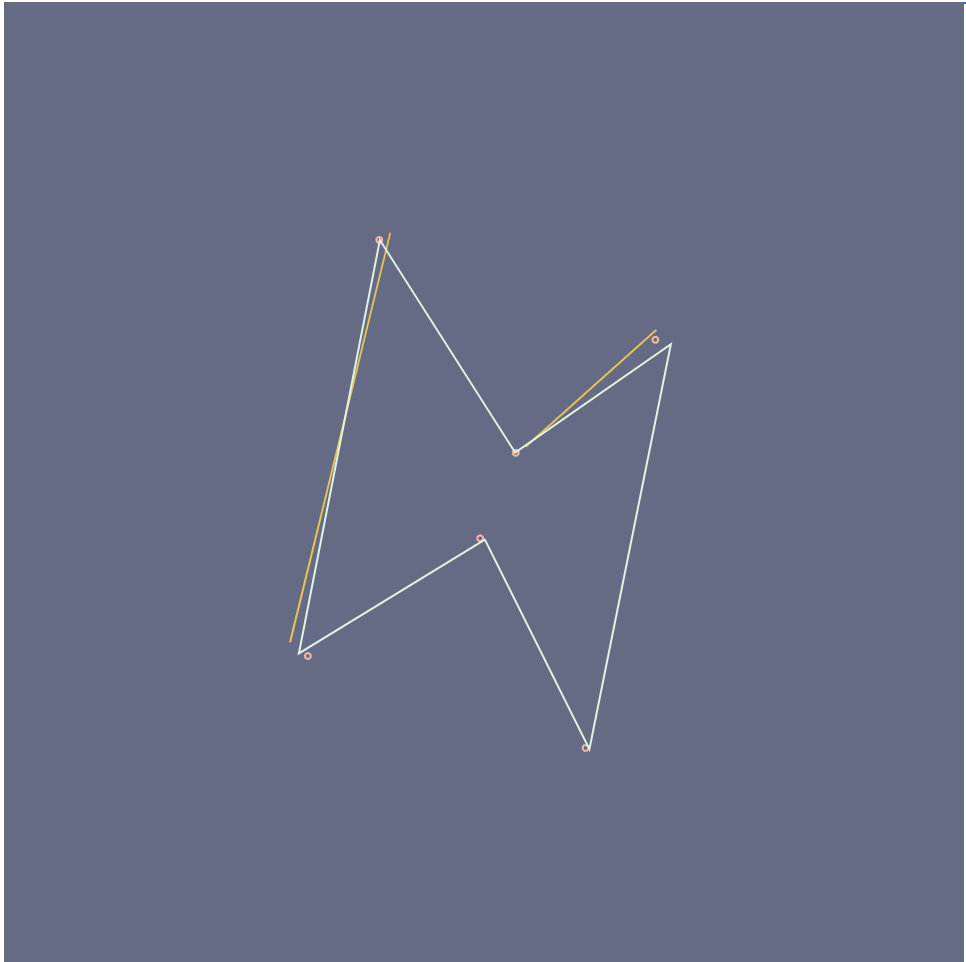
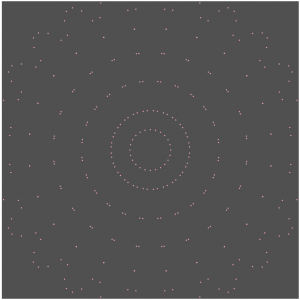
I connected lines from every point on the hourglass to the center of the figure to create a visually central effect, and then varied the rotation of the figure and the size of the figure on the X and Y coordinates of the mouse.

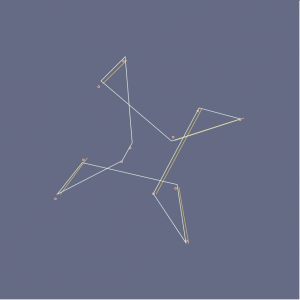
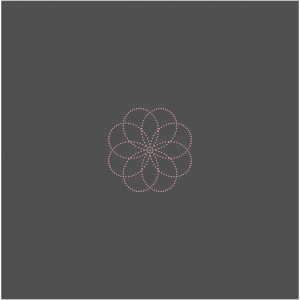
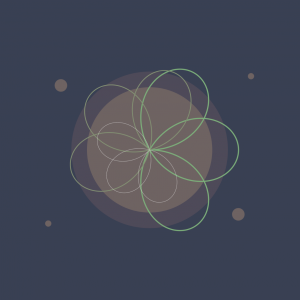
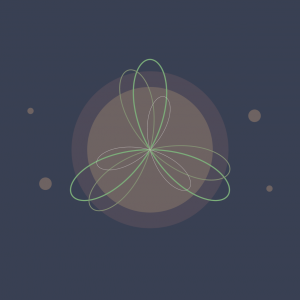
I then looped the figure to splay out at different speeds when rotating, to layer the image on top of itself in a simple and satisfying way. If you drag the rotation around enough, it starts to look like a clover!

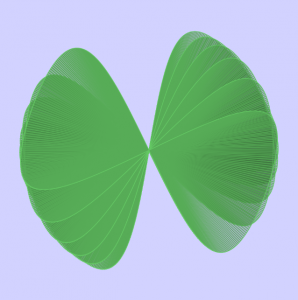
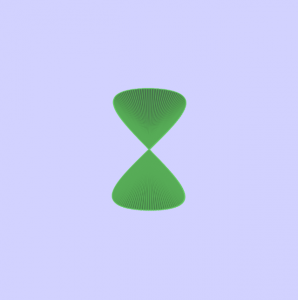
The rotating pairs of cloverleafs also create an even more central effect on the overall image.

sketch

function setup() {
    createCanvas(480, 480);
    frameRate(30);    
}

function draw() {
    
    stroke(100,200,100);

    background(210, 210, 255);
    fill(50, 100, 50, 70);

    for (var q = 500 ; q > 200 ; q -= 50) {

        push();
        translate(width/2, height/2);
        //Puts the hourglasses at the center of the canvas

        rotate(mouseY/q);
        //Rotates the individual hourglasses at a contantly
        //Increasing rate, so they seperate from each other

        hourglass();
        //Draws the hourglass
        pop();
    }
}

function hourglass() {

    beginShape();
    for (var i = 0; i < mouseX; i++) {

        var t = map(i, 0, mouseX/1.5, 0, TWO_PI);
        var a = i*4;

        var x = (a*sin(t)*cos(t))/t;
        var y = (a*sin(sin(t)))/t;
        //The mathematical equation needed to create the
        //reversing hourglass curve

        vertex(x,y);
        line(x,y,0,0);
        //Draws a line from the center of the figure to
        //Every point on the curve, creating a web-ish
        //effect that draws your eyes to the middle
        
        
    }
    endShape(CLOSE);
}

heeseoc-LookingOutwards-07

I chose this graph named Name Voyager which was developed in 2005 by Martin Wattenberg, which I thought was interesting and also practical. It basically generates a graph using people’s names, having it take more space based on their popularities. The user can type in a specific name and see how popular it was and is depending on the time period, and the interesting point is that as we type, the visualization shows, letter by letter, the overall popularity of the letters we’ve entered so far. It is interesting to observe what names get out of trend and what names get more popular. I feel like the algorithm here should be pretty simple, collecting the number data depending on names and placing them on a corresponding coordinate on a graph. I wouldn’t say that it has the most aesthetically pleasing visual, but I think it is good enough for something that has been developed in 2005.

http://www.babynamewizard.com/voyager

elizabew – Project – 07 – Composition with Curves

sketch

//Elizabeth Wang
//Section E
//elizabew@andrew.cmu.edu
//Project 07: Composition with Curves

var nPoints;
var angle;

function setup() {
  createCanvas(480, 480);
  angleMode(DEGREES);
  frameRate(15);
}

function draw() {
  background(102,106,134);

  angle = map(mouseX, 0, mouseY, 0, 360);

  translate(width/2, height/2); //keeps shape centered

  push();
  rotate(angle);
  drawAstroidCurve(); //calls to function drawShape
  pop();
}


function drawAstroidCurve(){

  var a = map(mouseX, 20, mouseY, 20, 30);
  nPoints = map(mouseX, 0, mouseY, 0, 20);

  beginShape(); //prevents object from adding on top of itself
  for (i = 0; i < nPoints; i++){
  var xr;
  var yr;
  var qx;
  var qy;
  var t = map(i, 0, nPoints, 0, 360);
  //http://mathworld.wolfram.com/Astroid.html
  var x = a*pow(cos(t), 3); //astroid curve's parametric equations
  var y = a*pow(sin(t), 3);
  //http://mathworld.wolfram.com/AstroidRadialCurve.html
  xr = x + 12*a*cos(t)*pow(sin(t), 2); //quadrifolium of astroid curve
  yr = y + 12*a*pow(cos(t), 2)*sin(t);

  noFill();
  strokeWeight(1);
  vertex(xr + (-10, 5), yr + random(-10, 5)); //keeps the shape "shaking"
  stroke(255,180,162);
  ellipse(xr + (-10, 5), yr + random(-10, 5), 3,3); //shaking ellipses
  stroke(223,243,227);

  if ((i % 2 == 0) & (i > 1)) { //dotted line
            stroke(232,197,71);
            line(qx, qy, xr, yr);
        }
        qx = xr;
        qy = yr;

  }
   endShape(CLOSE);
}

Still images:

Reflection

For my curve, I ended up choosing the quadrifolium of the astroid radial curve. When I started, I had a lot of trouble with radians and ended up accidentally translating my entire shape to move around a circle. Finally when I figured out what I did wrong and changed radians to angle, I wanted to make my shape not only “shake”, but to make it more dynamic; so I added a “backdrop” of dotted lines to give my shape more depth while also adding shaking dots. Overall I’m really happy with how it turned out and it reminds me of installations that demonstrate the vibrations of sound and/or music.

Project-07-Chickoff-Checkered Shape

sketch

//Cora Hickoff
//Section D
//chickoff@andrew.cmu.edu
//Project-07

var nPoints = 100;
var CYCLOID = 0; 

var titles = ["<><><><><><><><><><><><><><><><><><><><>"];
var curveMode = CYCLOID;


function setup() {
    createCanvas(400, 400);
    frameRate(10);
}

function draw() {
    background(224, 200, 197, 90);

      for (var y = 0; y < height; y += 5) {
        for (var x = 0; x < width+25; x += 50) {
            fill(255, 240, 250, 20);
            ellipse(x, y, 10, 5);
        }
    }
    
    // draw the frame
    fill(200, 0, 0); 
    noStroke();
    text(titles[curveMode], mouseX / 3, mouseY / 3);
    stroke(0);

    fill(200, 0, 0); 
    noStroke();
    text(titles[curveMode], mouseX / 3, mouseX / 2);
    stroke(0);

    noFill(); 
    strokeWeight(0);
    rect(0, 0, width-1, height-1); 

    // draw the curve
    push();
    translate(width / 2, height / 2);
    switch (curveMode) {
    case CYCLOID:
        drawCycloidCurve();
        break;
    }
    pop();
}

//--------------------------------------------------
function drawCycloidCurve() {
    // Cycloid:
    // http://mathworld.wolfram.com/Cycloid.html

    var a = 9.0;
    var b = a / 3.0;
    var h = constrain(mouseY / 20.0, 80, b);
    var ph = mouseX / 50.0;
    
    fill(205, 20, 20, 90);
    strokeWeight(1);
    beginShape();
    for (var i = 0; i < nPoints; i++) {
        var t = map(i, 0, nPoints, 0, TWO_PI);
        
        x = b - 4 + (t - sin(t)) - h * sin(ph + t * (a * b) / b);
        y = b + (1 - cos(t)) - h * cos(h + t * (a + b) / b);

        //places curve in middle of canvas
        vertex(x - 12, y - 20);
    }
    endShape(CLOSE);

    var a = 9.0;
    var b = a / 6.0;
    var h = constrain(mouseY / 20.0, 80, b);
    var ph = mouseX / 50.0;
    
    fill(205, 160, 160, 200);
    noStroke();
    beginShape();
    for (var i = 0; i < nPoints; i++) {
        var t = map(i, 0, nPoints, 0, TWO_PI);
        
        x = b - 4 + (t - sin(t)) - h * sin(ph + t * 2 * (a * b) / b);
        y = b + (1 - cos(t)) - h * cos(h + t * (a + b) / b);

        //places curve in middle of canvas
        vertex(x - 12, y - 20);
    }
    endShape(CLOSE);
    
}

In this project, I wanted to make the final product very soothing to look at, as well as aesthetically pleasing. My process with this was to play around with color and shape until I got this result which uses the same shape twice but changes some attributes such as color, opacity, strokeWeight (or lack thereof).

jknip-Project-07-curves

sketch

/*Jessica Nip
Section A
jknip@andrew.cmu.edu
Project-07
*/

 //-------------------------
function setup() {
    createCanvas(480,480);
}
 
 //-------------------------
function draw() {
    background(80);

//draw hypotrochoid curve
//define parametric variables, map and constrain mouseX and Y 
    var h = map(mouseY, 0, height/4, height/2, height/4);
    var a = constrain(mouseX, 0, width/4);
    var b = 5;

//set visual variables
    stroke(255,165,175);
    fill(255,165,175);

//set up for loop to consider all 360 degrees
    for (var t = 0; t < 360; t++) {
        //convert parametric equation of curve
        var x = width/2 +((a-b)*cos(radians(t)))+h*cos(((a-b)/b)*(radians(t)));
        var y = height/2 + ((a-b)*sin(radians(t)))-h*sin(((a-b)/b)*(radians(t)));
        //create tiny ellipses that repeat parametrically and create interactive collage
        ellipse(x, y, 1, 1);
    }  
}


Inspired by the hypotrochoid, I enjoyed looking at its ‘drawing’ mechanism that considers a smaller circle rolling around the inside of a bigger circle and the form of curves it draws. I wanted to recreate it through fireworks-inspired specks, that form both typical geometric forms (e.g. circle) and its exploded perspectives — I also wanted this relationship to be mapped with the movement of mouseX and mouseY, which I have mapped and constrained to smaller sections of the canvas. The aesthetics of the project was also inspired by this minimalist ‘flicker’ of the supposedly ‘specks’  of the form, so I used two colors that drew a distinct contrast.

creyes1-Project-07-Curves

creyes1 Project-07

//Christopher Reyes
//Section D
//creyes1@andrew.cmu.edu
//Project-07 (Composition with Curves)

var nPoints = 10000;

function setup() {
    createCanvas(480, 480);
    background(57, 64, 83);
}

function draw() {
    background(57, 64, 83);
    noStroke();

    //Darker circle
    fill(78, 74, 89);
    ellipse(width/2, height/2, 250, 250);

    //Lighter inner circle
    fill(110, 99, 98);
    ellipse(width/2, height/2, 200, 200);

    //Orbitals
    orbiter(0, 360, 200, 10);
    orbiter(0, 360, -200, 10);
    orbiter(360, 0, 175, 20);
    orbiter(360, 0, -175, 20);

    //Biggest, green rose
    push();
    translate(width/2, height/2);
    roseCurve(50, 200, 0, 10,
              [124, 174, 122],
              map(mouseY, 0, height, 1, 2.5));
    pop();

    //Medium rose
    push();
    translate(width/2, height/2);
    angleMode(DEGREES);
    rotate(180+45);
    angleMode(RADIANS);
    roseCurve(50, 180, 0, 10,
              [131, 144, 115],
              map(mouseY, 0, height, .5, 2));
    pop();

    //Smallest, white rose
    push();
    translate(width/2, height/2);
    angleMode(DEGREES);
    rotate(180-45);
    angleMode(RADIANS);
    roseCurve(0, 140, 0, 10,
              [255, 255, 255, 150],
              map(mouseY, 0, height, .1, .8));
    pop();

}

//Draws a rose curve where a and b values are determined by mouse position
function roseCurve(amin, amax, bmin, bmax, col, thickness) {
    var x;
    var y;
    var r;

    //Determines size of petals
    var a = map(mouseY, 0, height, amin, amax);
    //Determines number of petals
    var b = map(constrain(mouseX, 0, width), 0, width, bmin, bmax);

    noFill();
    stroke(col);
    strokeWeight(thickness);
    beginShape();
    for (var i = 0; i < nPoints; i++) {
        var t = map(i, 0, nPoints, 0, TWO_PI);

        r = a*sin(b*t);

        x = r * cos(t);
        y = r * sin(t);
        vertex(x, y);
    }
    endShape();
}

//Draws an ellipse that rotates around center according to mouse position
function orbiter(angleMin, angleMax, y, size) {
    push();
    translate(width/2, height/2);
    angleMode(DEGREES);
    rotate(map(mouseX, 0, width, angleMin, angleMax));
    noStroke();
    fill(110, 99, 98);
    ellipse(0, y, size);
    angleMode(RADIANS);
    pop();
}

I had forgotten how much I liked math and playing around with graphs, so I really enjoyed the time I spent with this project. Before I started my code, I explored and experimented a lot with Desmos, an online graphing calculator, and manipulated different variables of each equation to see what kind of movement I could get.

I ultimately went with the rose curve, a polar graph that’s visually interesting in not only its form, but in the way that the curve is drawn and generated. The main variables in the curve determine both the rose’s size and the amount of petals on it, so I decided to map both those variables to the mouse’s position and see what came out of it.

I’m definitely pleased with the final result, although I had initially wanted to make the orbitals travel in a sine wave around the circle, but it began to take a toll on the program’s ability to run smoothly, and ultimately settled on having it rotate without depending on a formula.

kyungak-project-07-curves

sketch

//Kyunga Ko
//15104B
//kyungak@andrew.cmu.edu
//Project 07

var cenX;
var cenY;
var numO = 100;
var dis = 100;

function setup() {
    createCanvas(480, 480);
    cenX = (width / 2);
    cenY = (height / 2);
}

function draw() {
    background(0);

    for (var i = 0; i < numO; i++) {

        //constraining mouseX range + mouseX changes size of posX & posY
        var m = map(mouseX,0,480,0,100); 
        var control = (m+10);

        //framerate changes according to mouseY
        var frame = (frameCount*i)/mouseY;

        //position X + circular movement
        var posX = cenX + control * cos(radians(30 * i + frame)); 

        //position Y + circular movement
        var posY = cenY + control * sin(radians(30 * i + frame));

        //for loop of ellipses
        strokeWeight(1);
        noFill();
        stroke(255,255,255,100);
        ellipse(posX,posX,posY,posY); 

    }

}

For this project, I wanted to make a series of translucent ellipses that continuously rotated. I wanted this continuous rotation to illusion the individual objects to be seen as a whole. Although the result didn’t yield a perfectly symmetric object to the traditional X and Y line, it is still partly symmetric to the y=x line. When the mouseX moves across the canvas, the object gets bigger. When mouseY moves, the frame rate changes. The result turned out to be much more fascinating than I thought. It was a last minute decision to give a variation to frameCount, and I am very glad I did it. The aesthetics were very satisfying. Although figuring out the sin and cosine rules were a bit challenging, I feel like I learned a lot by completing this project.

daphnel-Project07-Curves

Heart

var nPoints=300;

function setup() {
    createCanvas(480, 480);

}
function draw() {
    background(255, 230, 238, mouseX);
    var angle = mouseX/300;
    //draws the curve
    for(i=1; i<4; i++){
        push();
        translate(width/2,height/2);
        rotate(angle*mouseY/100);
        drawHeartCurve();
        //http://mathworld.wolfram.com/HeartCurve.html
        pop();
    }
}

function drawHeartCurve(){
    var x;
    var y;
    var a = constrain(mouseX/100,0,width);

    fill(255, 230, 238);
    stroke(255, 179, 204);
    strokeWeight(2);

    beginShape();
    for(var i = 0; i<nPoints; i++){
        var t= map(i,0,nPoints,0,TWO_PI);
        x =a * (16 * sin(t)* sin(t)* sin(t));
        y =a * ((13 * cos(t))-(6*cos(2*t))-(2*cos(3*t))-cos(4*t));
        vertex(x,y);
        vertex(x*i*a,y*i*a);
    }
    endShape(CLOSE);
}

I first spent a while trying to find curves that I was interested in. I thought about making a Quadrifolium but after looking around more, I found the Heart Curve. I tried fiddling around with it a little and then got the heart to show up. I then tried to add some other things to it which resulted in the lines next to the heart.

ghou-Project-07-Curves

sketch

//Grace Wanying Hou
//15-104 Section D
//ghou@andrew.cmu.edu
//Assignment 07


//global vars
var points;
var angle;


function setup() {
    createCanvas(480, 480);
    angleMode(DEGREES);
    frameRate(70);
}

function draw() {
    background(50);
    //curves changing w mouse
    points = map(mouseX, 0, width, 0, 300);
    angle = map((mouseX+mouseY/2), 0, width, 0, 360);
    
    
    //flickering colourful shadows
    stroke(random(230,255),random(230,255),random(230,255));
    drawCurve(width/2 + random(-5,5), height/2 + random(-5,5));
    
    stroke(random(200,240),random(200,240),random(200,240));
    drawCurve(width/2 + random(-10, 10), height/2 + random(-10, 10));
    
    stroke(random(180,220),random(180,220),random(180,220));
    drawCurve(width/2 + random(-15, 15), height/2 + random(-15, 15));
    
    stroke(random(150,200),random(150,200),random(150,200));
    drawCurve(width/2 + random(-20, 20), height/2 + random(-20, 20));
    
    stroke(random(100,180),random(100,180),random(100,180));
    drawCurve(width/2 + random(-30, 20), height/2 + random(-30, 20));
    
    stroke(random(80,150),random(80,150),random(80,150));
    drawCurve(width/2 + random(-30, 20), height/2 + random(-30, 20));
    
    //main shape
    stroke(255);
    noFill();
    drawCurve(width/2, height/2);
}

function drawCurve(posX, posY) {
  var x;
  var y;
  var b = map(mouseY, 0, 480, 60, 80);

  strokeWeight(1);
  noFill();

  push();
  translate(posX, posY);
  rotate(angle);
  //variation on fermat's spiral
  beginShape();
  for (var i = 0; i < points; i++) {
    x = 3*cos(2*i*.1*i)*b;
    y = 3*-sin(2*i*.1*i)*b;
    vertex(x, y);
      
  }
  endShape(CLOSE);
  pop();
}

After forgetting math I did in high-school I had to do a lot of studying and research on the different functions to create this interactive curve.

I was looking at spirals when I came across my concept. My variation generates lines to create a polygon in the shape of a circle and connects lines through the vertices through the polygon.

These are the “basic” shapes that my code generates. I created some shadow forms behind it to make it look more aesthetic.

LookingOutwards-07-Chickoff

Platts is a data visualization project created by U.K. designer Brendan Dawes in 2017 which visualizes “the journey of over 3000 ships created from five months of historical shipping data.”It was created for the Igloo 360 degree wrap-around projection system. The map of the world in this piece is created with little dots that grow over the course of the video. I find it fascinating to see how connected the world is in terms of the way we exchange products and exports, but also realize how disconnected I feel I am to that same world.

This project reminds me a lot of the travel and migration patterns of animals. I love this visualization of ship routes because it reduces human life to a simpler, objective level. The ship moves from Country A to Country B while experiencing some weather difficulties along the way. No opinion is needed with simple facts like these. And so I find it comforting to see the life in this way because it shows how insignificant and small humans are, even if we sometimes act like we’re the universe’s royalty.