Project-07-Curves

sketch.js

//Hanna Jang 
//Section B 
//hannajan@andrew.cmu.edu 
//Project-07

var numberPoints=200; 

function setup() {
	createCanvas(420, 420); 
	frameRate(15); 
}

function draw() {
	 
//map the color background changes using r, g, b  and mouse
	var r=map(mouseX, 0, width, 0, 255); 
	var g=map(mouseY, 0, height, 0, 90); 
	var b=map(mouseX, 0, width, 0, 250); 
	background(r, g, b, 30); 
	
	//stroke
	stroke(240, 174, 231); 
	strokeWeight(0.3); 
	
	translate(width/2, height/2); 
	drawEpitrochoid(); 
}

function drawEpitrochoid() {
	var x; 
	var y; 
	var h=100; 
	var theta; 
	
//variables to help modify change using mouse 
	var a=map(mouseX, 0, width, 0, 20); 
	var b=map(mouseY, 0, height, 0, 40); 
	
//draw outer epitrochoid 
	beginShape(); 
	for(var i=0; i<numberPoints; i++) {
		theta=map(i, 0, width/2, 0, 360); 
		x = (a + b) * cos(theta) - h * cos(((a + b)/b) * theta);
       y = (a + b) * sin(theta) - h * sin(((a + b)/b) * theta);
 
 vertex(x, y); 
	}
endShape(); 
}

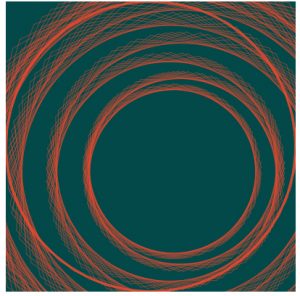
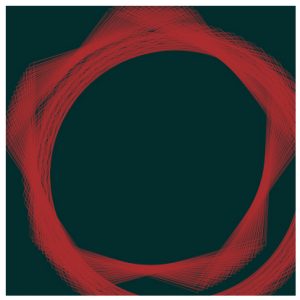
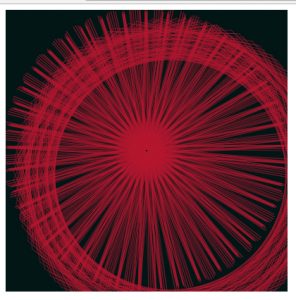
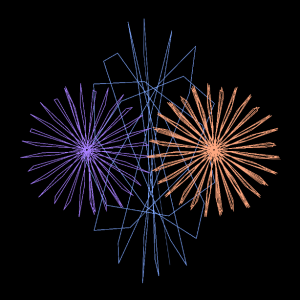
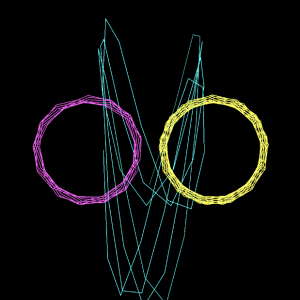
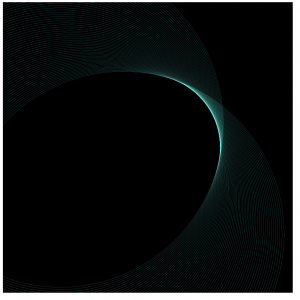
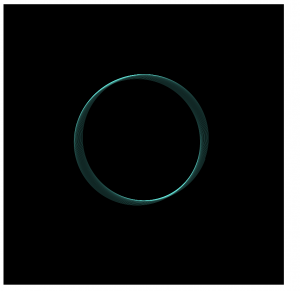
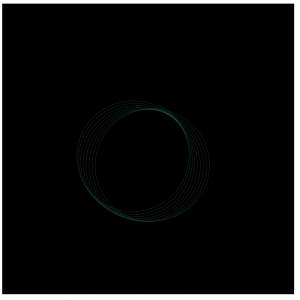
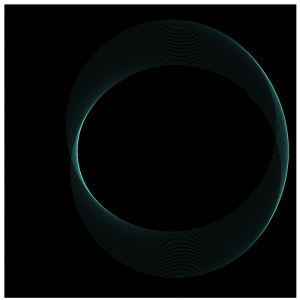
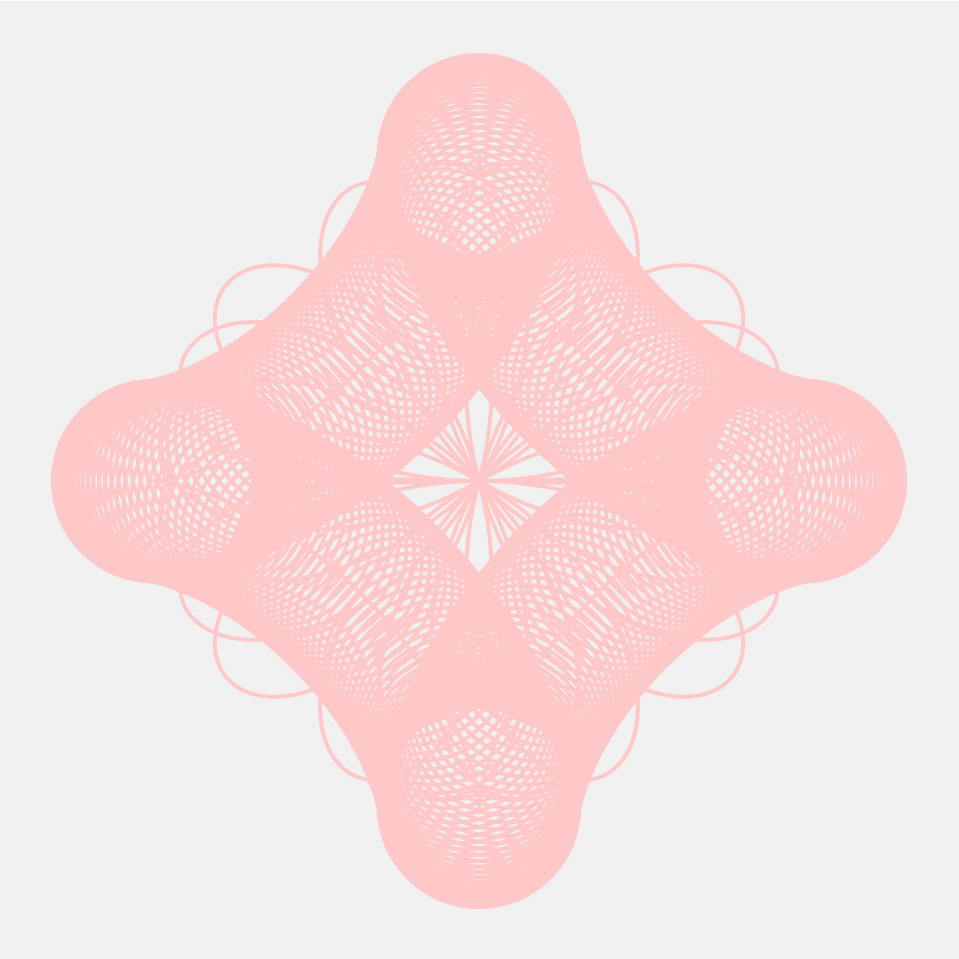
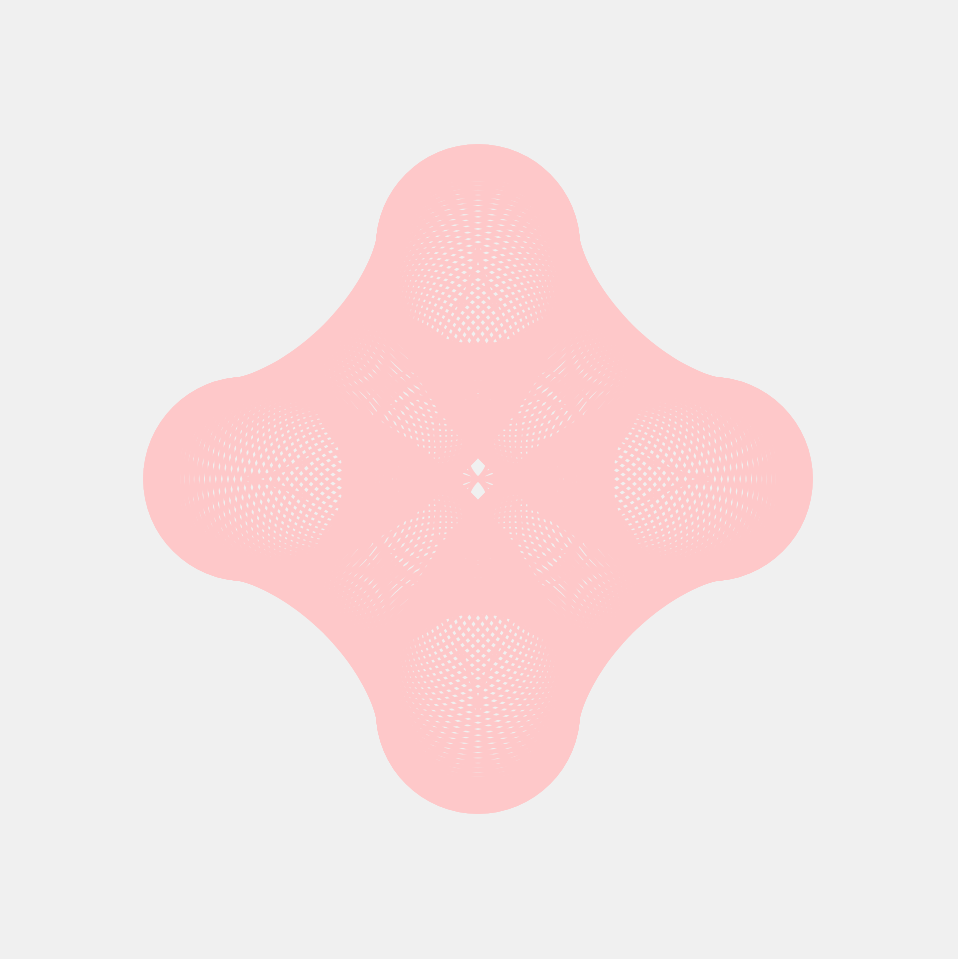
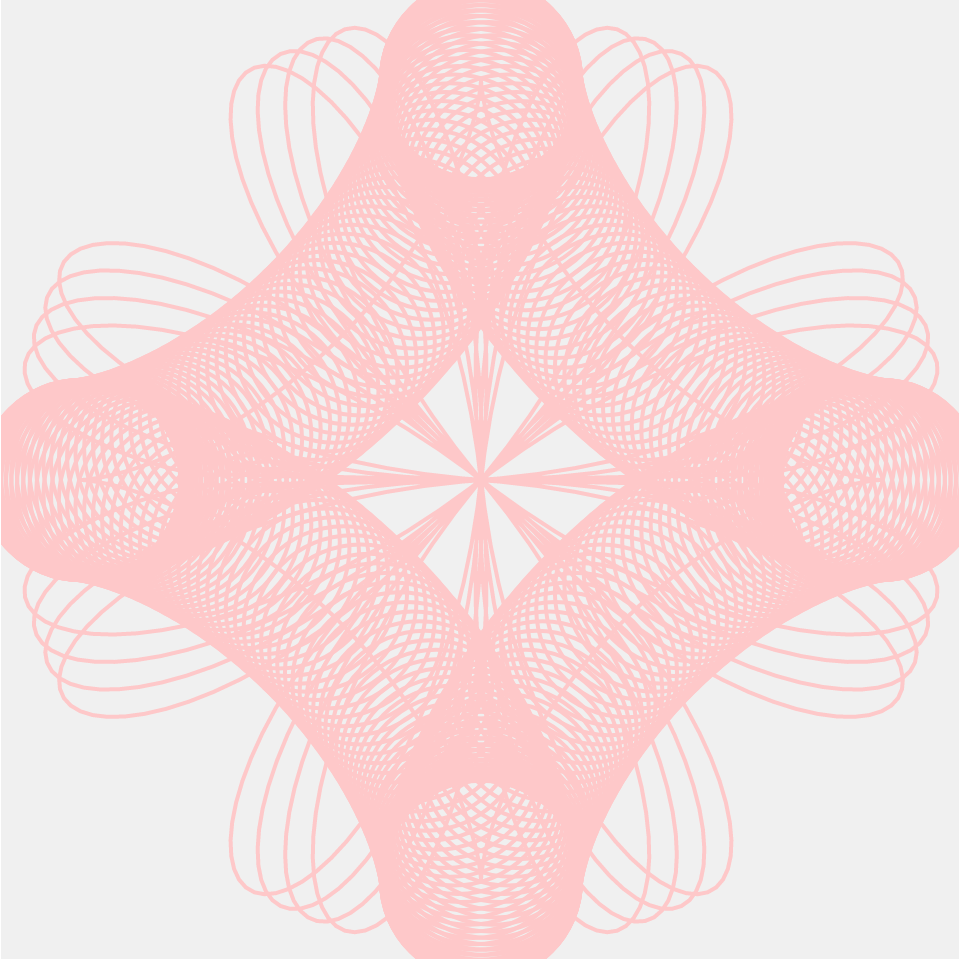
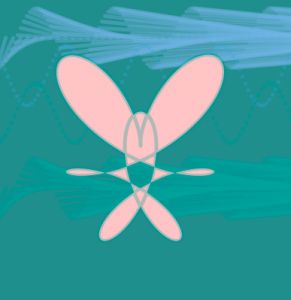
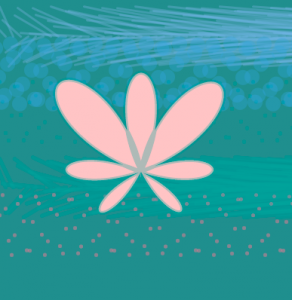
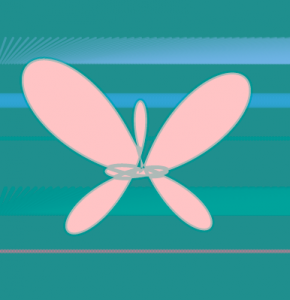
I started this project by looking through the different mathematical curves on the Mathworld curves site. I stumbled upon a specific curve named Epitrochoid that I really liked. It reminded me of a shape of a flower, which is why my project is themed around pink, to give it a pink flower look.

I wanted the background to also change as according to the mouse movement, which is why I also made maps for the different R, G, B variables. It was a bit hard to understand how I wanted the mouse to interact with the different variables of the functions, but once I made maps to form relationships with the mouse and variables a and b, I was set.

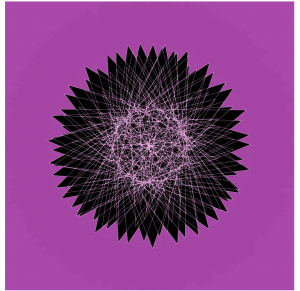
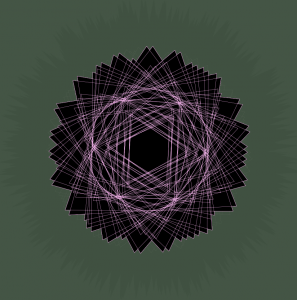
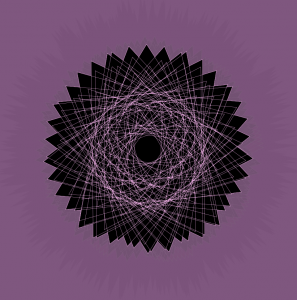
(Shown above are examples of different Epitrochoid patterns and sizes according to the movement of mouse)

dnoh-sectionD-project7-curves

sketch

var nPoints = 100;

function setup() {
    createCanvas(480, 480);
    background(255);
}

function draw() {
  angleMode(DEGREES);
  var r = map(mouseX, 0, width, 0, 360); //rotate using x axis
  var m = map(mouseY, 0, height, 0, 360); //rotate using y axis

  background(255);
  push();
  translate(width/2, height/2); //move Epicycloid to center
  rotate(r);
  rotate(-m);
  drawEpicycloid(); //draws the function below
  pop();

}

function drawEpicycloid() {
  var a = 50; //set sizes of curves
  var b = 50;
  var aa = map(a,0,50,50,mouseX-350);
  var bb = map(b,0,50,50,mouseY-350);

  fill(220,180,165); //add butt color

  beginShape();
  for (var i = 0; i < nPoints; i++) {
    angleMode(RADIANS);
    var t = map(i,0,nPoints,0,TWO_PI); //map the points to a circular area

    x = (aa+bb)*cos(t)-bb*cos((t*(aa+bb))/bb);
    y = (aa+bb)*sin(t)-bb*sin((t*(aa+bb))/bb);
    vertex(x,y);
  endShape(CLOSE);
  }
}

I started with a basic code that let me create the simplest Epicycloid, which is basically in the form of a butt. I, therefore, took that notion and turned the shape’s color to skin tone. However, I added parameters that allowed me to change the rotation and overall shape of the Epicycloid using mouseX and mouseY. All in all, due to the randomness of the mouseX and mouseY alterations, I loved how I could stop anywhere along the square and it would procure a different shape.

Project 7, odh

odhP7

//Owen D Haft
//Section D
//odh@andrew.cmu.edu
//Project 7

var nPoints = 100;

function setup() {
    createCanvas(480, 480);
    frameRate(10);
}

function draw() {
    background(255);
    push();
        translate(0, mouseY); //Changes the height based on MouseY
        fill(111, 111, 222);
        drawCurve(); //Draws the curve
    pop();
}
    
function drawCurve() {

    beginShape();
    for (var i = 0; i < nPoints; i++) {
        var t = map(i, 0, nPoints, 0, TWO_PI); //maps the points of the equations
        strokeWeight(1);

        //The equations that generate the curve
        x = (mouseX/19)*((sin^3)*(t)); //Curve changes with mouseX
        y = 13*cos(t) - 5*cos(2*t) - 2*cos(3*t) - cos(4*t);
        
        vertex(x, y);
    }
    endShape(CLOSE);    
}

I attempted to use a Heart Curve in this project, but I came across an issue with using Sin^3. Therefore, I just went with the result I got leading to my current project. I chose to have the curve stretch with the mouseX and change heights with mouseY.

rgroves – Curves – Section B

sketch

var nPoints = 250;
var rotations = 30;
var shift = 0; //initialize displacement of curve, which changes whith the mouse
var a = 0; //initialize a used in the curve function
var red = 50;
var g = 0;
var b = 0;


function setup() {
    createCanvas(480, 480);
    frameRate(10);
}

function draw() {
    background(250);
    stroke(250);
    translate(width/2, height/2);
	var s = (TWO_PI)/rotations;
    for(j = 0; j < rotations; j += 2) {
		drawConchoid(j * s);
	}
	for(j = 1; j < rotations; j += 2) {
		drawConchoid(j * s);
	}
}

function drawConchoid(r) {
	push()
	pickColor();

	rotate(r);
    var shift = map(mouseY, 0, height, -100, 100); //displaces the curve along the rotated x axis using mouseY
	translate(shift, 0);
	beginShape();
	for(i = 0; i < nPoints; i++) {
        var theta = map(i, 0, nPoints, 0, TWO_PI);
	    var a = map(mouseX, 0, width, -5, 4);

        var r = 70 * ((1/(cos(theta))) + (a * cos(theta)));
        var x = r * cos(theta);
        var y = r * sin(theta);
        vertex(x, y);
	}
	endShape(CLOSE);	
	pop();
}

function pickColor() {
	var red = random(60, 200);
	var g = random(50, 150);
	var b = random(80, 250);
	var col = color(red, g, b, 20);
	return fill(col);
}

The curve I chose for the project was the Conchoid of de Sluze. I had a LOT of problems with this code! I wanted to rotate the curve around the center many times to create this complex mandala pattern. While I think that should have been really simple to do with a for loop, nothing I did worked. I kept the for loop that I wrote in the code but it’s commented out. I still do not understand why it doesn’t work!! I also didn’t want the colors to be flashing but I couldn’t figure out how to fix the random values.

Edit: I figured out the problem with the for loop so I updated my post!

rmanagad-project07-curves

sketch

//Robert Managad
//Section E
//rmanagad@andrew.cmu.edu
//Project-07

var nPoints = 850

function setup() {
    createCanvas(400, 400);
  	frameRate(25);
}

function draw() {

	//color set-up
	var r = map(mouseX, 0, width, 160, 200);
	var g = map(mouseY, 0, height, 20, 60);
	var b = map(mouseY, 0, height, 20, 60);
	noFill();
	//modification of background and strokecolours
	background(2, g, b);
	stroke(r, g, 47);
	strokeWeight(0.5);
	translate(width/2, height/2);
	Hypotrochoid();
}

function Hypotrochoid (){
	// equations for recollection
	// x= (a-b)cost + hcos(((a-b)/b) * theta)
	// y= (a-b)sint + hsin(((a-b)/b) * theta)
	var x;
    var y;
    var h = 200;
    //variables to modify displacement from center.
    var a = map(mouseX, 0, width, 0, 10);
    var b = map(mouseY, 0, height, 0, 15);
    var c = map(mouseX, 0, width, 0, 5); 
    var d = map(mouseX, 0, width, 0, 50);
    beginShape();
      for(var i = 0; i < 500; i ++) {
        var theta = map(i, 0, width/2, 0, 360);
        x = (a - b) * cos(theta) + h * cos(((a - b)/b) * theta);
        y = (a - b) * sin(theta) - h * sin(((a - b)/b) * theta);
        vertex(x , y);
      }
    endShape();
    beginShape();
      for(var i = 0; i < nPoints; i ++) {
        var theta = map(i, 0, width, 0, 360);
        x = (c - d) * cos(theta) + h * cos(((c - d)/d) * theta);
        y = (c - d) * sin(theta) - h * sin(((c - d)/d) * theta);
        vertex(x + noise(2) * width/3, y + noise(2) * width/3);
      }
    endShape();
}


My primary goal for this project was familiarizing myself with curve equations, and their applications to existing shape structures. My first attempt with a conchoid was unsuccessful — I was not able to produce a visible result — so I moved on to hypotrochoids and applied similar plans to it. Below are curve sketches I examined to contribute to my final program:


mjeong1-Project-07-Curves

sketch

//Min Young Jeong
//15-104 Section A
//mjeong1@andrew.cmu.edu
//Project-07

function setup() {
    createCanvas(480, 480);
}

function draw() {
    var r = mouseX * 0.25;//creating r,g,b values to color strokes based on position of mouse on canvas
    var g = mouseY;
    var b = 255;
    noFill();
    background(0);


    push();
    stroke(r, g, b);
    strokeWeight(0.5);
    translate(width/2,height/2);
    drawmodifiedhypotrochoid();
    pop();
    //first geomety, modified hypotrochoid(middle one)
 
   push();
    stroke(g,r,b);
    strokeWeight(0.5);
    translate(width/2-100,height/2);
    drawmodifiedhypotrochoid2(300,300);
    pop();
    //secon geometry,modified hypotrochoid(left one)

   push();
    stroke(b,g,r);
    strokeWeight(0.5);
    translate(width/2+100,height/2);
    drawmodifiedhypotrochoid3(300,300);
    pop();
    //thrid geometry, modified hypotrochoid(right one)

}

function drawmodifiedhypotrochoid() {
    var x;
    var y;
    var x1 = map(mouseX, 0, width, 0, 100);
    var y2 = map(mouseY, 0, height, 0, 150);
    beginShape();
      for(var i = 0; i <50; i ++) {
        var angle = map(i, 0, 50, 0, 360);
        x = (x1 - y2) * cos(angle) - y2 * cos(((x1 - y2)) * angle);
        y = (x1 + y2) * sin(angle) - y2 * sin(((x1 - y2)) * angle);
        vertex(x, y);
    endShape();
      }
}
//first modified hypotrochoid that represents nose of the face

function drawmodifiedhypotrochoid2() {
    var x;
    var y;
    var x1 = map(mouseX, 0, width, 0, 100);
    var y2 = map(mouseY, 0, height, 0, 150);
    beginShape();
      for(var i = 0; i <100; i ++) {
        var angle = map(i, 0, 50, 0, 360);
        x = (x1 - y2) * cos(angle) - y2 * cos(((x1 - y2)) * angle);
        y = (x1 - y2) * sin(angle) - y2 * sin(((x1 - y2)) * angle);
        vertex(x, y);
    endShape();
      }
}
//second geometry that represents left eye of the face

function drawmodifiedhypotrochoid3() {
    var x;
    var y;
    var x1 = map(mouseX, 0, width, 0, 100);
    var y2 = map(mouseY, 0, height, 0, 150);
    beginShape();
      for(var i = 0; i <200; i ++) {
        var angle = map(i, 0, 50, 0, 360);
        x = (x1 - y2) * cos(angle) - y2 * cos(((x1 - y2)) * angle);
        y = (x1 - y2) * sin(angle) - y2 * sin(((x1 - y2)) * angle);
        vertex(x, y);
    endShape();
      }
}
//third geometry that represents right eye of the face

//http://mathworld.wolfram.com/Hypotrochoid.html

For this assignment, I initially started with a hypotrochoid with varying color based on position of mouse. And I moved on to three modifications of the hypotrochoid to see how the geometry can be different based on different input values. I played with changing y values which created elongated geometry and also with varying number x values in order to change the number of strokes.


monicah1-project-07-SectionA

sketch

var points = 5100;
var depth = 10;

function setup() {
  createCanvas(400, 400);
}

function draw() {
	background(0);

    translate(width /2, height/2);
    rotate(mouseX/2);
    drawParabolaCurve();
    drawHypotrocloid();
}   

function drawParabolaCurve() {
    strokeWeight(0.1);
    stroke(104,259,242);
    noFill()
    var Z = 6000;
    
    beginShape();
    for (var i = 0; i < points; i++) {

        var t = map(i, 10, points, 10, HALF_PI);
        var x = Z * pow(t,depth) / Z;
        var y = 2 * Z * t;

        vertex(x, y);
    }
    endShape();
    
}

function drawHypotrocloid() {
    var e = 100;
    var f = map(mouseX, 0, width, 0, 300);
    var g = e/map(mouseY, 0, height, 0, 300);

   
    beginShape();
        for (var i = 0; i < points; i++) {

            var angle = map(i, 0, points, 0, HALF_PI);
            var j = (e - f) * cos(angle) + f * cos (((e - g)/g)*angle);
            var k = (e - f) * sin(angle) - f * sin (((e - g)/g)*angle);

            vertex(j, k);
        }
    endShape();
}

I usedParabolaCurve and Hypotrocloid in one visual, playing with stroke weight and dynamic behaviors. I like the mysterious, delicate, and sensual visual qualities.

Project-07 Curve Thomas Wrabetz

sketch

//Thomas Wrabetz
//Section C
//twrabetz@andrew.cmu.edu
//Project-07

var CVAR = 45;
var prevX = 100;
var prevY = 100;

function cubic( x )
{
   return ( x - mouseX / 25 ) * ( x + mouseY / 25 ) * ( x + ( mouseX - width / 2 ) / 25 + ( mouseY - height / 2 ) / 25);
}

function setup()
{
    createCanvas( 480, 480 );
    noStroke();
}

function draw()
{
    
    if( prevX == mouseX & prevY == mouseY ) return;
    background(220);
    prevX = mouseX;
    prevY = mouseY;
    circX = width / 3 + mouseX / 3;
    circY = height / 3 - mouseY / 5;
    fill(255);
    for( var i2 = 0; i2 < 480; i2 += random(10,14) )
    {
        i = i2;
        for( var j = 0; j < 480; j += random(10,14) )
        {
            if( j < (height / 2) - cubic( (i - 240)/10 ) / 100 ) fill( random(0,CVAR), 100 + random(0,CVAR), 175 + random(0,CVAR) );
            else fill( random(0,CVAR), 150 + random(0,CVAR), random(0,CVAR) );
            if( ( j - circY ) * ( j - circY ) + ( i - circX ) * ( i - circX ) < 1250 ) fill( 175 + random( 0, CVAR ), 175 + random( 0, CVAR ), random(0, CVAR) );
            
            ellipse( i, j, 18, 21 );
            i = random( i2-2, i2+2 );
        }
    }
}

I used a cubic function to make a hill. The sun is also there.

I used a grid of points with small random offsets and determined their color based on their relation to the equation; their color also varies slightly to create a pointillism-like effect.

haewanp – Project 07 – Composition with Curves

Composition with Curves

var x;
var y;
var r;
var nPoints = 300;

function setup() {
    createCanvas(480, 480);
    strokeJoin(ROUND);
    smooth();
    stroke(255, 200, 200, [255]);
}

function draw() {
    background(240);
    noFill();
    
    push();
    translate(width / 2, height / 2);
    roseCurve();
    astroidCurve();
    pop();

}

function roseCurve() {
    strokeWeight(2);
    
    beginShape();
    for (i = 0; i < nPoints; i++) {
        var t = map(i, 0, nPoints, 0, TWO_PI);
        var a = map(mouseY, 0, height, 40, height/2); //change its size depending on y coordinate of mouse
        var n = map(mouseY, 0, height, 0, 4); //change its shape depending on y coordinate of mouse
        r = a * sin(n*t);
        
        x = r * cos(t);
        y = r * sin(t);
        vertex(x, y);
        
    }

    for (i = 0; i < nPoints; i++) {
        var t = map(i, 0, nPoints, 0, TWO_PI);
        var a = map(mouseY, 0, height, 40, height/2); //change its size depending on y coordinate of mouse
        var n = map(mouseY, 0, height, 0, 4); //change its shape depending on y coordinate of mouse
        r = a * sin(n*t);
        
        x = r * cos(t);
        y = r * sin(t);
        vertex(-x, y);
        
    }

    for (i = 0; i < nPoints; i++) {
        var t = map(i, 0, nPoints, 0, TWO_PI);
        var a = map(mouseY, 0, height, 40, height/2); //change its size depending on y coordinate of mouse
        var n = map(mouseY, 0, height, 0, 4); //change its shape depending on y coordinate of mouse
        r = a * sin(n*t);
        
        x = r * cos(t);
        y = r * sin(t);
        vertex(x, -y);
        
    }

    for (i = 0; i < nPoints; i++) {
        var t = map(i, 0, nPoints, 0, TWO_PI);
        var a = map(mouseY, 0, height, 40, height/2); //change its size depending on y coordinate of mouse
        var n = map(mouseY, 0, height, 0, 4); //change its shape depending on y coordinate of mouse
        r = a * sin(n*t);
        
        x = r * cos(t);
        y = r * sin(t);
        vertex(-x, -y);
        
    }
    endShape(CLOSE);

}


function astroidCurve() {
    noFill();

    beginShape();
    for (i = 0; i < nPoints; i++) {
        var t = map(i, 0, nPoints, 0, TWO_PI);
        var a = map(mouseX, 0, width/2, 20, nPoints/2); //change its size depending on x coordinate of mouse
        x = a*pow(cos(t),3);
        y = a*pow(sin(t),3);
        
        vertex(x, y);
        ellipse(x, y, 100, 100); //create ellipse along the curve line
    }
    endShape();
}

Before starting to code my program, I explored various curve equation in Mathworld curve site. I think this site is a very useful reference. Also, it was interesting to see all the different curve shapes. At the beginning, I had no idea how to apply polar form. But, I finally realized (x = r cos(θ) and y = r sin(θ)). I chose ‘Rose Curve’ and ‘Astroid Curve’ for my project. Personally, I really like rose curve because of the way it changes shape. I played with a combo of two different curves. You can see some of the nice examples below.

hschung-Project-07

sketch

//Heidi Chung
//Section A
//hschung@andrew.cmu.edu
//Project-07

var nPoints = 1000;

function setup() {
    createCanvas(400, 400);
    frameRate(10);
}

function draw() {
    background(70, 140, 140);

    var a = 1.5;
    var b = 1.0;
    var w = map(height/2, height/2, width/4, width-(width/4));
    var inc = TWO_PI/(mouseX-height/4);

        for (var waves = 0; waves < 400; waves++) { //waves behind the butterfly
            strokeWeight(20);
            stroke(83, 167, 218, 90);//blue thin lines sine curve
            line(w, 100 -mouseY, waves*4 -mouseY, 100+sin(b)*40.0);
            b = b + inc;

            strokeWeight(3);
            stroke(126, 180, 227, 90);//blue thick dotted sine curve
            line(waves*10, 50, waves*4, 50+sin(b)*40.0);
            b = b + inc;

            strokeWeight(5);
            stroke(30, 160, 154, 90); //green dotted sine curve
            line(w, 150 -mouseY, waves*4, 150+sin(b)*40.0);
            b = b + inc;

            stroke(30, 160, 154, 90); //green lines sine curve
            line(waves*10, 250, waves*4, 250+sin(b)*40.0);
            b = b + inc;

            stroke(255, 122, 153, 90); //dark pink dotted sine curve
            line(w, 300, waves*4 -mouseX, 300+sin(b)*40.0);
            b = b + inc;
        }

    push();
    translate(width/2, height/2+30); //centers the butterfly
    drawButterfly();
    pop();
}

function drawButterfly() {
    var x;
    var y;
    stroke(30, 160, 154, 90);
    fill(255, 200, 200);
    beginShape();
    for (var i = 0; i < nPoints; i++) {
        var t = map(i, 0, nPoints, 0, TWO_PI); //adding mouseX and mouseY alters the power of sin()
        x = -50 * (sin(t) * (exp(cos(t))- 2*cos(4*t) + pow(sin((1*t+mouseX)/12), 5)));
        y = -50 * (cos(t) * (exp(cos(t))- 2*cos(4*t) + pow(sin((1*t+mouseY)/12), 5)));
        vertex(x, y);
        //I chose the Butterfly Curve.
        //http://mathworld.wolfram.com/ButterflyCurve.html
        //adding the negative sign into the equation flips the butterfly vertically
    }
    endShape(CLOSE);
    
}

So at first, when I browsed the curves on the Mathworld website, I was drawn to the Butterfly Curve, and thought it would look interesting if it grew large and small from its center. So I looked at it but was warded off because it looked complicated and I wasn’t sure how to denote it in p5.js. Then I started playing with sine curves. I later realized with the help of my friend that the sine curve wasn’t an equation choice from the given site, so I (begrudgingly) went back to the Butterfly Curve and to my surprise, was able to translate it over into code without too much of a hitch… I was a little confused about how to write the parametric equations for the Butterfly Curve but the p5.js reference page helped a lot. I also added the sine curves I had been playing with into the background. I actually quite like the ever “fluttering butterfly” I was able to make. It makes some interesting heart/hybrid shapes too.