yushano_Looking Outwards 8

Website
Original Soundtrack

Speaker: L05

The speaker, L05 (Carlos Garcia), is an artist, performer, designer, and engineer. He is a vocalist and producer in hip hop/electronic duo Celsius Electronics and a co-founder of the Branch Out Collective. He leads creative research and design as a member of the University of Michigan’s Emerging Technologies Group, where he manages the GroundWorks Media Lab. L05 is a 2013 Creative Capital Grantee and a 2016 Kresge Artist Fellow. He is in an art group called Complex Movements, which is “a Detroit-based artist collective supporting the transformation of communities by exploring the connections of complex science and social justice movements through multimedia interactive performance work like science fiction, music, projections, animation, workshops, and organizing”.
I deeply admire their current project Beware of the Dandelions, a mobile art installation that functions as a performance, workshop space, and visual arts exhibition. As a project, Beware of the Dandelions exceeds the scope of the performances. The collective started the project very early in 2013 and finished in early this year. They reason why this project took so long is that it is not just a performance piece; rather, is a mobile platform that organizes social-justice movements. First, the Beware of of the Dandelious live performance is a very fictionalized synthesis of the social-justice movements. Second, it shows “community mode” through the members of the art collective who run workshops in partnership with local artists and activists of their performing cities in order to acknowledge the events that are happening there and to understand the needs of people living there. Third, in installation mode, they “present the stories they have gathered in the process of interacting with locals, documenting and sharing social-justice work that goes largely ignored by mainstream media”. Complex Movements uses such experience to show and present performances of Beware of the Dandelions to their audience, centering story progression around the difference in their work.
This kind of presentation is really appealing to me that it can actually affects or just leave impression in people’s hearts.

hschung-LookingOutwards-07

I looked at the work of Periscopic, who describe themselves as a socially-conscious data visualization firm that helps people promote awareness and transparency of information.
On Periscopic’s website, Wes Bernegger explains the process behind the making of a “Feather” Visualization. They used Microsoft Emotion API, which takes images of faces as input and returns a set of emotions for each image- which is interesting because we’re able to rely on machines to examine human faces and pick up what emotions seem present according to facial expressions, which can be so diverse and may need much interpretation to understand. With that technology, Periscopic examined the past inaugural addresses of the presidents, which pulled out emotive data- from 8 emotions. They then plugged their data into Processing to create a visual representation of what they found, which turned into a feather form.
Interestingly enough, Donald Trump’s feather was much more negative and droopy than the feathers of the other presidents’ addresses.
I appreciate that this group attempted addressing emotive data, and that they appropriately used an emotive shape to express it. It’s an easy way to have people interpret their findings at a glance.

http://www.periscopic.com/news/emotions-inauguration

mjeong1-Project-07-Curves

sketch

//Min Young Jeong
//15-104 Section A
//mjeong1@andrew.cmu.edu
//Project-07

function setup() {
    createCanvas(480, 480);
}

function draw() {
    var r = mouseX * 0.25;//creating r,g,b values to color strokes based on position of mouse on canvas
    var g = mouseY;
    var b = 255;
    noFill();
    background(0);


    push();
    stroke(r, g, b);
    strokeWeight(0.5);
    translate(width/2,height/2);
    drawmodifiedhypotrochoid();
    pop();
    //first geomety, modified hypotrochoid(middle one)
 
   push();
    stroke(g,r,b);
    strokeWeight(0.5);
    translate(width/2-100,height/2);
    drawmodifiedhypotrochoid2(300,300);
    pop();
    //secon geometry,modified hypotrochoid(left one)

   push();
    stroke(b,g,r);
    strokeWeight(0.5);
    translate(width/2+100,height/2);
    drawmodifiedhypotrochoid3(300,300);
    pop();
    //thrid geometry, modified hypotrochoid(right one)

}

function drawmodifiedhypotrochoid() {
    var x;
    var y;
    var x1 = map(mouseX, 0, width, 0, 100);
    var y2 = map(mouseY, 0, height, 0, 150);
    beginShape();
      for(var i = 0; i <50; i ++) {
        var angle = map(i, 0, 50, 0, 360);
        x = (x1 - y2) * cos(angle) - y2 * cos(((x1 - y2)) * angle);
        y = (x1 + y2) * sin(angle) - y2 * sin(((x1 - y2)) * angle);
        vertex(x, y);
    endShape();
      }
}
//first modified hypotrochoid that represents nose of the face

function drawmodifiedhypotrochoid2() {
    var x;
    var y;
    var x1 = map(mouseX, 0, width, 0, 100);
    var y2 = map(mouseY, 0, height, 0, 150);
    beginShape();
      for(var i = 0; i <100; i ++) {
        var angle = map(i, 0, 50, 0, 360);
        x = (x1 - y2) * cos(angle) - y2 * cos(((x1 - y2)) * angle);
        y = (x1 - y2) * sin(angle) - y2 * sin(((x1 - y2)) * angle);
        vertex(x, y);
    endShape();
      }
}
//second geometry that represents left eye of the face

function drawmodifiedhypotrochoid3() {
    var x;
    var y;
    var x1 = map(mouseX, 0, width, 0, 100);
    var y2 = map(mouseY, 0, height, 0, 150);
    beginShape();
      for(var i = 0; i <200; i ++) {
        var angle = map(i, 0, 50, 0, 360);
        x = (x1 - y2) * cos(angle) - y2 * cos(((x1 - y2)) * angle);
        y = (x1 - y2) * sin(angle) - y2 * sin(((x1 - y2)) * angle);
        vertex(x, y);
    endShape();
      }
}
//third geometry that represents right eye of the face

//http://mathworld.wolfram.com/Hypotrochoid.html

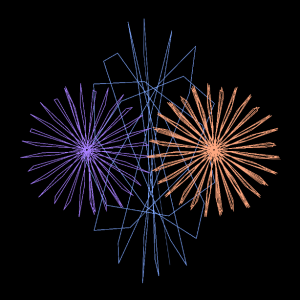
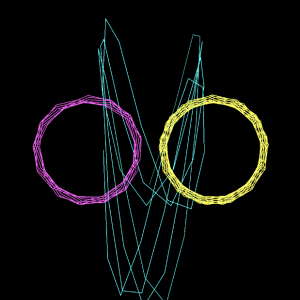
For this assignment, I initially started with a hypotrochoid with varying color based on position of mouse. And I moved on to three modifications of the hypotrochoid to see how the geometry can be different based on different input values. I played with changing y values which created elongated geometry and also with varying number x values in order to change the number of strokes.


monicah1-project-07-SectionA

sketch

var points = 5100;
var depth = 10;

function setup() {
  createCanvas(400, 400);
}

function draw() {
	background(0);

    translate(width /2, height/2);
    rotate(mouseX/2);
    drawParabolaCurve();
    drawHypotrocloid();
}   

function drawParabolaCurve() {
    strokeWeight(0.1);
    stroke(104,259,242);
    noFill()
    var Z = 6000;
    
    beginShape();
    for (var i = 0; i < points; i++) {

        var t = map(i, 10, points, 10, HALF_PI);
        var x = Z * pow(t,depth) / Z;
        var y = 2 * Z * t;

        vertex(x, y);
    }
    endShape();
    
}

function drawHypotrocloid() {
    var e = 100;
    var f = map(mouseX, 0, width, 0, 300);
    var g = e/map(mouseY, 0, height, 0, 300);

   
    beginShape();
        for (var i = 0; i < points; i++) {

            var angle = map(i, 0, points, 0, HALF_PI);
            var j = (e - f) * cos(angle) + f * cos (((e - g)/g)*angle);
            var k = (e - f) * sin(angle) - f * sin (((e - g)/g)*angle);

            vertex(j, k);
        }
    endShape();
}

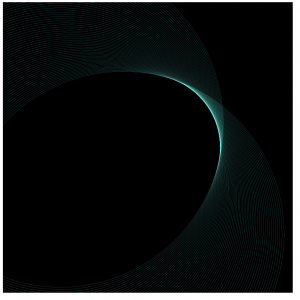
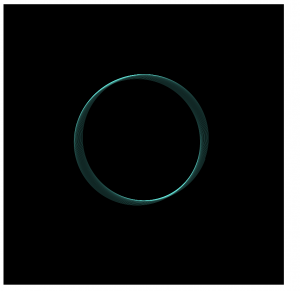
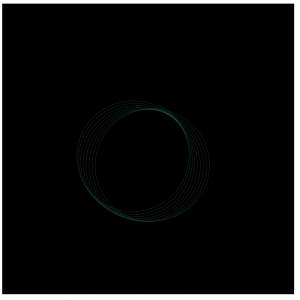
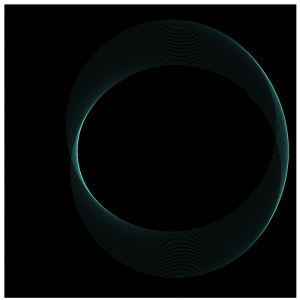
I usedParabolaCurve and Hypotrocloid in one visual, playing with stroke weight and dynamic behaviors. I like the mysterious, delicate, and sensual visual qualities.

haewanp – Project 07 – Composition with Curves

Composition with Curves

var x;
var y;
var r;
var nPoints = 300;

function setup() {
    createCanvas(480, 480);
    strokeJoin(ROUND);
    smooth();
    stroke(255, 200, 200, [255]);
}

function draw() {
    background(240);
    noFill();
    
    push();
    translate(width / 2, height / 2);
    roseCurve();
    astroidCurve();
    pop();

}

function roseCurve() {
    strokeWeight(2);
    
    beginShape();
    for (i = 0; i < nPoints; i++) {
        var t = map(i, 0, nPoints, 0, TWO_PI);
        var a = map(mouseY, 0, height, 40, height/2); //change its size depending on y coordinate of mouse
        var n = map(mouseY, 0, height, 0, 4); //change its shape depending on y coordinate of mouse
        r = a * sin(n*t);
        
        x = r * cos(t);
        y = r * sin(t);
        vertex(x, y);
        
    }

    for (i = 0; i < nPoints; i++) {
        var t = map(i, 0, nPoints, 0, TWO_PI);
        var a = map(mouseY, 0, height, 40, height/2); //change its size depending on y coordinate of mouse
        var n = map(mouseY, 0, height, 0, 4); //change its shape depending on y coordinate of mouse
        r = a * sin(n*t);
        
        x = r * cos(t);
        y = r * sin(t);
        vertex(-x, y);
        
    }

    for (i = 0; i < nPoints; i++) {
        var t = map(i, 0, nPoints, 0, TWO_PI);
        var a = map(mouseY, 0, height, 40, height/2); //change its size depending on y coordinate of mouse
        var n = map(mouseY, 0, height, 0, 4); //change its shape depending on y coordinate of mouse
        r = a * sin(n*t);
        
        x = r * cos(t);
        y = r * sin(t);
        vertex(x, -y);
        
    }

    for (i = 0; i < nPoints; i++) {
        var t = map(i, 0, nPoints, 0, TWO_PI);
        var a = map(mouseY, 0, height, 40, height/2); //change its size depending on y coordinate of mouse
        var n = map(mouseY, 0, height, 0, 4); //change its shape depending on y coordinate of mouse
        r = a * sin(n*t);
        
        x = r * cos(t);
        y = r * sin(t);
        vertex(-x, -y);
        
    }
    endShape(CLOSE);

}


function astroidCurve() {
    noFill();

    beginShape();
    for (i = 0; i < nPoints; i++) {
        var t = map(i, 0, nPoints, 0, TWO_PI);
        var a = map(mouseX, 0, width/2, 20, nPoints/2); //change its size depending on x coordinate of mouse
        x = a*pow(cos(t),3);
        y = a*pow(sin(t),3);
        
        vertex(x, y);
        ellipse(x, y, 100, 100); //create ellipse along the curve line
    }
    endShape();
}

Before starting to code my program, I explored various curve equation in Mathworld curve site. I think this site is a very useful reference. Also, it was interesting to see all the different curve shapes. At the beginning, I had no idea how to apply polar form. But, I finally realized (x = r cos(θ) and y = r sin(θ)). I chose ‘Rose Curve’ and ‘Astroid Curve’ for my project. Personally, I really like rose curve because of the way it changes shape. I played with a combo of two different curves. You can see some of the nice examples below.

hschung-Project-07

sketch

//Heidi Chung
//Section A
//hschung@andrew.cmu.edu
//Project-07

var nPoints = 1000;

function setup() {
    createCanvas(400, 400);
    frameRate(10);
}

function draw() {
    background(70, 140, 140);

    var a = 1.5;
    var b = 1.0;
    var w = map(height/2, height/2, width/4, width-(width/4));
    var inc = TWO_PI/(mouseX-height/4);

        for (var waves = 0; waves < 400; waves++) { //waves behind the butterfly
            strokeWeight(20);
            stroke(83, 167, 218, 90);//blue thin lines sine curve
            line(w, 100 -mouseY, waves*4 -mouseY, 100+sin(b)*40.0);
            b = b + inc;

            strokeWeight(3);
            stroke(126, 180, 227, 90);//blue thick dotted sine curve
            line(waves*10, 50, waves*4, 50+sin(b)*40.0);
            b = b + inc;

            strokeWeight(5);
            stroke(30, 160, 154, 90); //green dotted sine curve
            line(w, 150 -mouseY, waves*4, 150+sin(b)*40.0);
            b = b + inc;

            stroke(30, 160, 154, 90); //green lines sine curve
            line(waves*10, 250, waves*4, 250+sin(b)*40.0);
            b = b + inc;

            stroke(255, 122, 153, 90); //dark pink dotted sine curve
            line(w, 300, waves*4 -mouseX, 300+sin(b)*40.0);
            b = b + inc;
        }

    push();
    translate(width/2, height/2+30); //centers the butterfly
    drawButterfly();
    pop();
}

function drawButterfly() {
    var x;
    var y;
    stroke(30, 160, 154, 90);
    fill(255, 200, 200);
    beginShape();
    for (var i = 0; i < nPoints; i++) {
        var t = map(i, 0, nPoints, 0, TWO_PI); //adding mouseX and mouseY alters the power of sin()
        x = -50 * (sin(t) * (exp(cos(t))- 2*cos(4*t) + pow(sin((1*t+mouseX)/12), 5)));
        y = -50 * (cos(t) * (exp(cos(t))- 2*cos(4*t) + pow(sin((1*t+mouseY)/12), 5)));
        vertex(x, y);
        //I chose the Butterfly Curve.
        //http://mathworld.wolfram.com/ButterflyCurve.html
        //adding the negative sign into the equation flips the butterfly vertically
    }
    endShape(CLOSE);
    
}

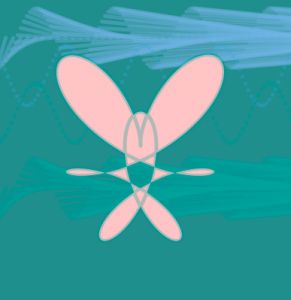
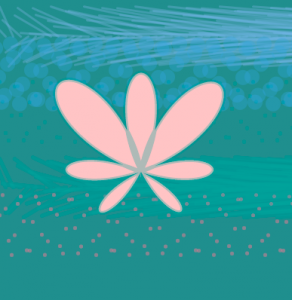
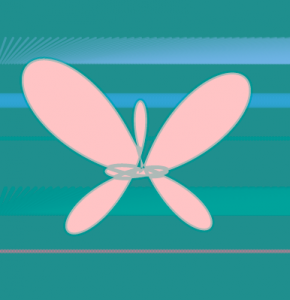
So at first, when I browsed the curves on the Mathworld website, I was drawn to the Butterfly Curve, and thought it would look interesting if it grew large and small from its center. So I looked at it but was warded off because it looked complicated and I wasn’t sure how to denote it in p5.js. Then I started playing with sine curves. I later realized with the help of my friend that the sine curve wasn’t an equation choice from the given site, so I (begrudgingly) went back to the Butterfly Curve and to my surprise, was able to translate it over into code without too much of a hitch… I was a little confused about how to write the parametric equations for the Butterfly Curve but the p5.js reference page helped a lot. I also added the sine curves I had been playing with into the background. I actually quite like the ever “fluttering butterfly” I was able to make. It makes some interesting heart/hybrid shapes too.

ljkim looking outward 07

http://https://www.vam.ac.uk/bigglassmic/
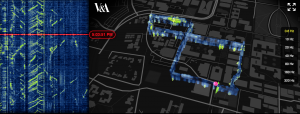
Image of Big Glass Microphone

Big Glass Microphone looks at infrastructure in ways that our eyes can’t see. By visualizing the vibrations in a five kilometer long fiber optic cable buried underneath the campus of Stanford University. Fiber optic cables are used to send signals from one another. I’m assuming an algorithm is used to read the vibrations then to interpret it to visuals. In the image above, you can see a building of Stanford. I appreciate this use of computational information visualization because it’s use of fiber optic in unconventional ways. The beauty of re-using resources in different ways is now more than crucial in a resource-depleting time period.

hannahk2-Project-07

sketch

//Hannah Kim
//Section A
//hannahk2@andrew.cmu.edu
//Project-07

var nPoints = 100;
var EPITROCHOID = 0; // Cartesian Parametric Form  [x=f(t), y=g(t)]
var CRANIOID = 1; // Polar explicit form   [r =f(t)]
var curveMode = EPITROCHOID;

var numObjects = 10;
var centerX;
var centerY;
var angle = 0;
var distance = 100;

function setup() {
// creates canvas
createCanvas(500, 500);
centerX = width/2;
centerY = height/2;
noStroke();
ellipseMode(CENTER);
}

function draw() {
background(0, 0, 0, 20);
// draw the frame
fill(0); 
stroke(255, 0, 0, 40);
noFill(); 
rect(0, 0, width-1, height-1); 

// draw the curve and rotate at different angles
push();
translate(width / 2, height / 2);
drawecurve();
rotate(PI/3.0);
drawecurve();
rotate(2*PI /3.0);
drawecurve();
pop();

//function to draw the curve
function drawecurve() {
    var x;
    var y;
  
    var a = 70.0;
    var b = a / 2.0;
    var h = constrain(mouseY / 20.0, 0, b);
    var ph = mouseX / 80.0;
    
    beginShape();
    for (var i = 0; i < nPoints; i++) {
        var t = map(i, 0, nPoints, 0, TWO_PI);
        
        x = (a + b) * cos(t) - h * cos(ph + t * (a + b) / b);
        y = (a + b) * sin(t) - h * sin(ph + t * (a + b) / b);
        vertex(x, y);
    }
    endShape(CLOSE);
}

var angleObject = 360/numObjects;
	//creates for loop which creates ellipses
	for (var i=0;i<numObjects ;i++) {
	angle = frameCount;
	//makes the distance between the ellipses change according to mouseX
	distance = sin(radians(mouseX))*150;
	var posX = centerX + distance *cos( radians(angleObject*i + angle) );
	var posY = centerY + distance *sin( radians(angleObject*i + angle) );
		//creates different curves and lines
		//makes one curve grow in width depending on mouseY
		//changes size of curves based on var posX and posY
		fill(255, 0, 0, 0);
		ellipse(posX, posY, 10, 10);
		stroke(255, 0, 0, 40);
		strokeWeight(1);
		line(centerX, centerY, posX, posY);
		line(centerX, centerY, posX-100, posY-100);
		line(centerX, centerY, posX+100, posY+100);
	 	//ellipse(posX, posY, mouseY, 100);
		ellipse(posX, posY, 200, 200);
	}
}

I really enjoyed making this project and playing with the different parameters of the curves. I tried to make something resembling a rotating planet/orb.

ssharada-looking-outwards-07

Can Buyukberber is a visual artist working on immersive audiovisual experiences that’s embodied both in physical and digital spaces.

Unifield is a form experiment which attempts to explore H.S.M. Coxeter’s higher dimensional geometry studies. The work intends to trigger a timeless perception by merging both archaic and futuristic components. By using computational design techniques with a digital fabrication method and projection mapping, Unifield uses the space where digital and physical overlaps as a portal to visualization possibilities of a higher dimensional object.

It works as an ambiguous sculpture, animated with light and sound that has the qualities of this historical background and scientific studies. With this correlation, Unifield aims to transcend a single association of time, which rather is a holistic understanding.

mjnewman Project-07, Section A

circles

function setup() {
    createCanvas(480, 480);
}

function draw() {
    //mapping for colors lines and background
    var r = map(mouseX, 0, width, 0, 200);
    var g = map(mouseY, 0, height, 0, 255);
    var b = map(mouseX, 0, width, 0, 155);
    background(209, g, 100);
    stroke(r, 150, b);
    strokeWeight(3);

    //moving to middle of the canvas
    translate(width / 2, height / 2);
    noFill();
    drawHypotrochoid();
}

function drawHypotrochoid(){
    //variables to be used in the equation
    var x;
    var y;
    var h = width/2;
    var a = map(mouseX, 0, width, 0, PI);
    var b = map(mouseY, 0, height, 0, 1);

    //HYPOTROCHOID EQUATION
    // x = (a-b)*cos(angle) + h*cos(((a-b)/b) angle)
    // y = (a-b)*sin(angle) - h*sin(((a-b)/b) angle)

    beginShape();
        for(var i = 0; i < width; i+= 5){
            var angle = map(i, 0, width, 0, 360);
            x = (a - b) * cos(angle) + h * cos(((a-b)/b)*angle);
            y = (a - b) * sin(angle) - h * sin(((a-b)/b)*angle);
            vertex(x,y);
        }
    endShape();
}

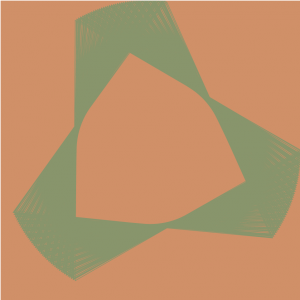
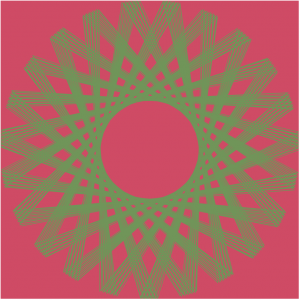
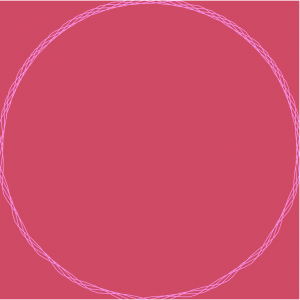
In order to fully understand the curves process, I tried to keep this project as simple as possible. This meant choosing a basic equation to start off with, which is how I ended up choosing the hypotrochoid curve. It took a little while to get used to how the rather long equation to generate the lines would semantically be converted into p5js; I had to add more multiplication stars than I had originally anticipated and had a lot of trouble trying to figure out that because when it wasn’t correct, nothing would render. I was able to play around with the numbers as well as colors by keeping this part of the project relatively simple. However, I am still mesmerized by the dancing lines from such a short amount of code.

Screenshots: