![[OLD FALL 2017] 15-104 • Introduction to Computing for Creative Practice](../../../../wp-content/uploads/2020/08/stop-banner.png)
//Grace Wanying Hou
//15-104 Section D
//ghou@andrew.cmu.edu
//Assignment 07
//global vars
var points;
var angle;
function setup() {
createCanvas(480, 480);
angleMode(DEGREES);
frameRate(70);
}
function draw() {
background(50);
//curves changing w mouse
points = map(mouseX, 0, width, 0, 300);
angle = map((mouseX+mouseY/2), 0, width, 0, 360);
//flickering colourful shadows
stroke(random(230,255),random(230,255),random(230,255));
drawCurve(width/2 + random(-5,5), height/2 + random(-5,5));
stroke(random(200,240),random(200,240),random(200,240));
drawCurve(width/2 + random(-10, 10), height/2 + random(-10, 10));
stroke(random(180,220),random(180,220),random(180,220));
drawCurve(width/2 + random(-15, 15), height/2 + random(-15, 15));
stroke(random(150,200),random(150,200),random(150,200));
drawCurve(width/2 + random(-20, 20), height/2 + random(-20, 20));
stroke(random(100,180),random(100,180),random(100,180));
drawCurve(width/2 + random(-30, 20), height/2 + random(-30, 20));
stroke(random(80,150),random(80,150),random(80,150));
drawCurve(width/2 + random(-30, 20), height/2 + random(-30, 20));
//main shape
stroke(255);
noFill();
drawCurve(width/2, height/2);
}
function drawCurve(posX, posY) {
var x;
var y;
var b = map(mouseY, 0, 480, 60, 80);
strokeWeight(1);
noFill();
push();
translate(posX, posY);
rotate(angle);
//variation on fermat's spiral
beginShape();
for (var i = 0; i < points; i++) {
x = 3*cos(2*i*.1*i)*b;
y = 3*-sin(2*i*.1*i)*b;
vertex(x, y);
}
endShape(CLOSE);
pop();
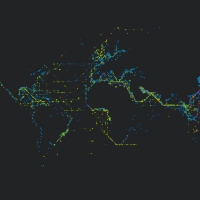
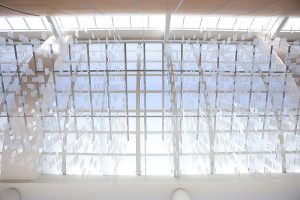
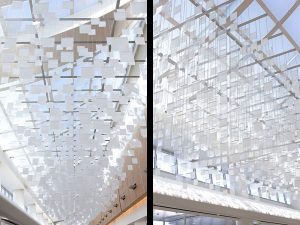
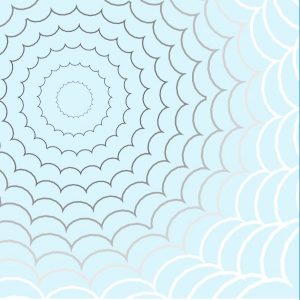
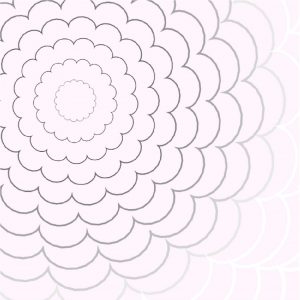
}After forgetting math I did in high-school I had to do a lot of studying and research on the different functions to create this interactive curve.
I was looking at spirals when I came across my concept. My variation generates lines to create a polygon in the shape of a circle and connects lines through the vertices through the polygon.
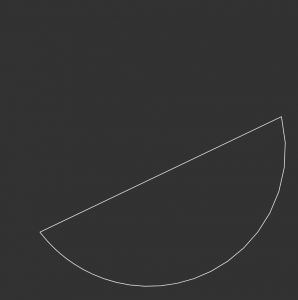

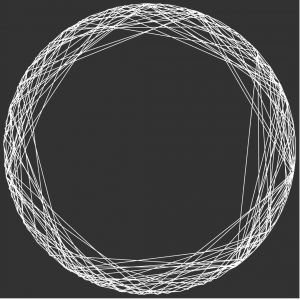
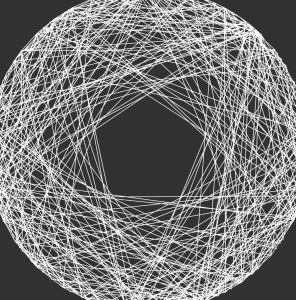
These are the “basic” shapes that my code generates. I created some shadow forms behind it to make it look more aesthetic.