Project-07-Curves

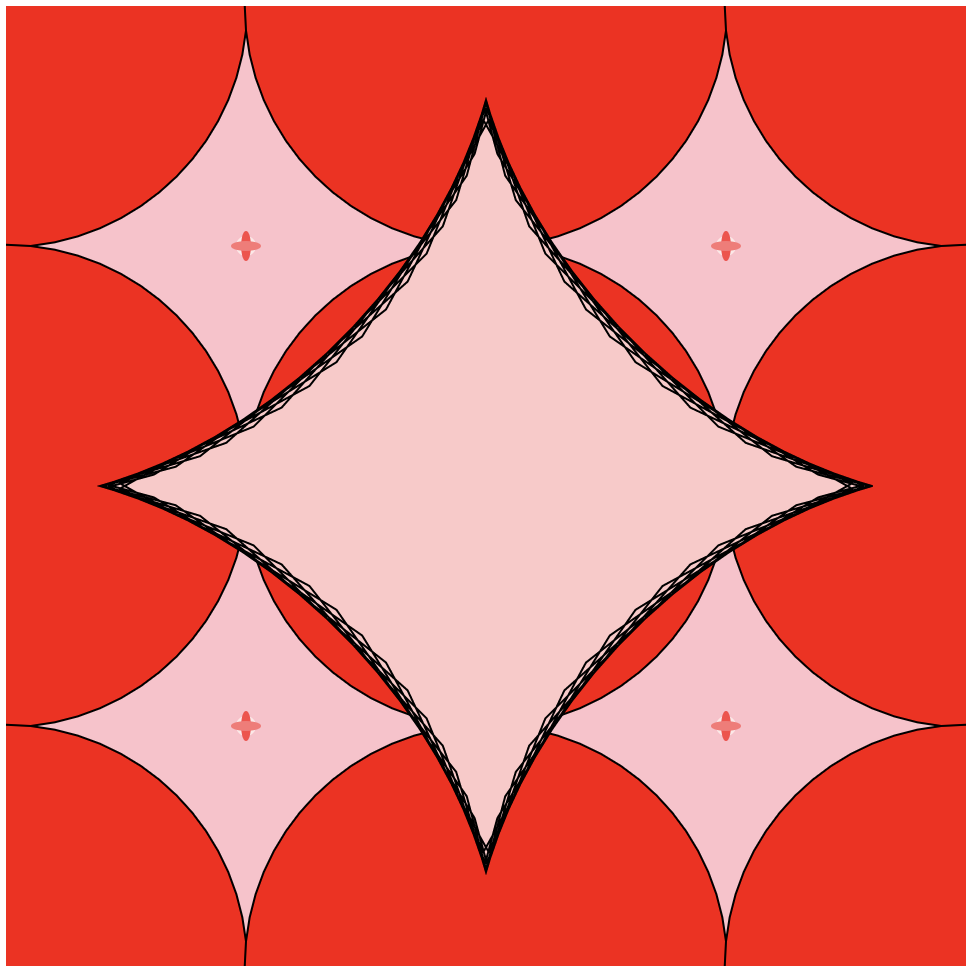
Trying to get the curve was pretty difficult. The website had a lot of equations on it and I picked through them to get the information I needed. Once I got the curve I wanted, the issue rose of how to implement it in the code. After experimenting for a bit and looking at the code given on the assignment instructions for reference, I eventually figured it out. After getting the curve to work, I changed some values so that it changed along with the mouse, making it interactive. I also added and changed other elements to make the image prettier, such as adding colors and flowers.

sketchsal

var num_points = 100;//number of points being drawn

function setup() {
    createCanvas(480, 480);
    frameRate(25);
}

function draw() {
    var hW = width / 2;//half of width
    var hH = height / 2;//half of height
    background("pink");
    for(var i = 0; i < 3; i++){//draws rows of elements
        for(var g = 0; g < 3; g++){//drawns columns of elements
        ellipse((width / 2) * i,(height / 2) * g, (mouseX / 4) * 1,
            (mouseX / 4) * 1);//circles being drawn
        }

    }
    //circles
    noStroke();
    fill(255, 232, 232);
    ellipse(120,120, 10,10);//upper left
    ellipse(360,120, 10,10);//upper right
    ellipse(120,360, 10,10);//lower left
    ellipse(360,360, 10,10);//lower right
    //flowers
    fill(255, 69, 69);
    ellipse(120,120, 5,15);//upper left
    ellipse(360,120, 5,15);//upper right
    ellipse(120,360, 5,15);//lower left
    ellipse(360,360, 5,15);//lower right

    fill(255, 117, 117);
    ellipse(120,120, 15,5);//upper left
    ellipse(360,120, 15,5);//upper right
    ellipse(120,360, 15,5);//lower left
    ellipse(360,360, 15,5);//lower right
    fill('red');//makes circles red
    stroke(0);//makes everything outlined

    //draw curve (Astroid) 
    push();
    translate(width / 2, height / 2);//(240,240)
    drawAstroid();
    pop();
}
function drawAstroid() {//function that draws curve
    var x;//calls x
    var y;//calls y
    var vx = mouseX / 5.0;//value of mouseX divided by 5 
    fill(255, 200, 200);//pink
    beginShape();//makes it so that the lines don't stay after being drawn
    //(there isn't a bunch of overlapping blackness)
    for (var i = 0; i < num_points; i++) {//increments elements from 0 to 100
        var t = map(i, 0, num_points, 0, TWO_PI);//runs curve from 0 to 2 pi
        
        x = vx * pow(cos(t * vx),3);//formula for x values
        y = vx * pow(sin(t * vx),3);//formula for y values
        vertex(x, y);
    }
    endShape(CLOSE);//ends shape
}
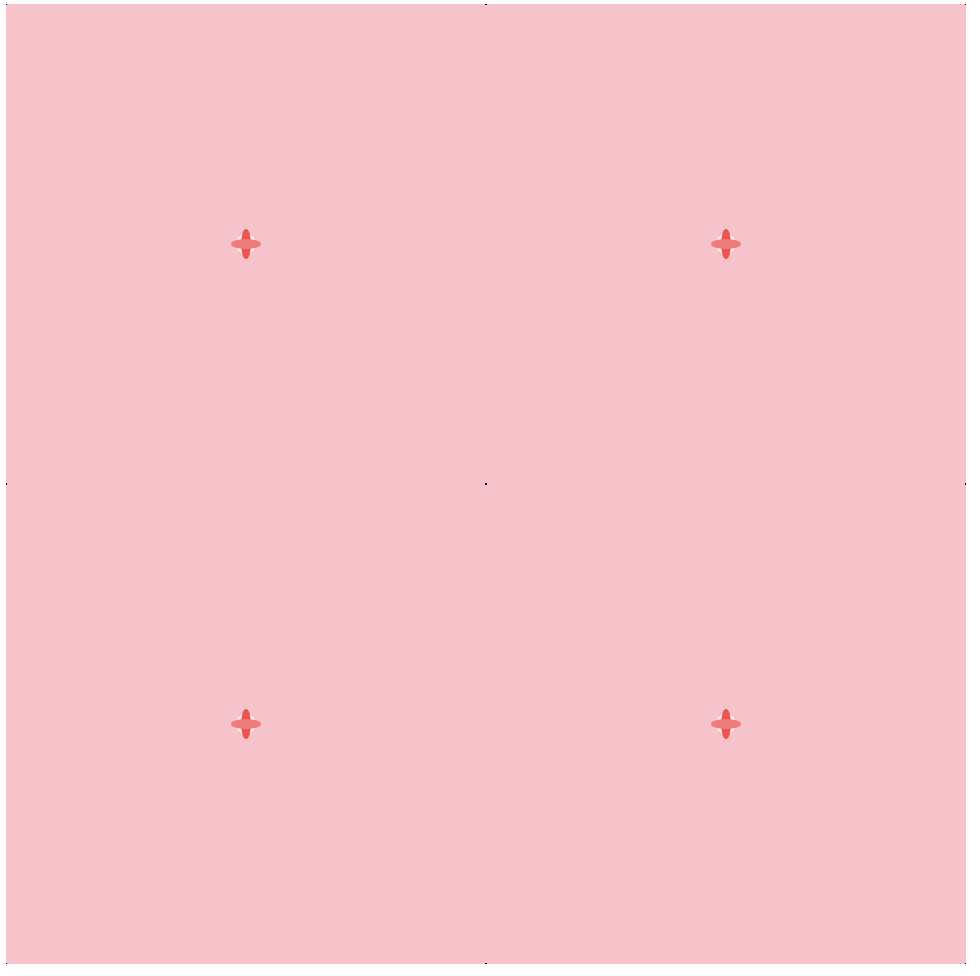
Before adding curve and circles
Finished product

Rachel Shin – Project 07- Curves

reshin-project07

/*Rachel Shin
reshin@andrew.cmu.edu
15-104 Section B
Project 07- Composition with Curves
*/

var numPoints = 300;
var angle = 0;


function setup() {
    createCanvas(480, 480)
    r = random(255);
    g = random(255);
    b = random(255);
}    


function draw() {
    background(0);

    push();
    translate(width / 2, height / 2); //center on canvas
    drawHypotrochoid();
    pop();

    push();
    translate(mouseX, mouseY); //center of curve based on mouse position
    rotate(radians(angle)); //rotates on center point
    drawTrifolium();
    pop();

    angle = angle + 4; // speed of rotation
}  
  
function drawHypotrochoid() { //http://mathworld.wolfram.com/Hypotrochoid.html
    var x;
    var y;
    
    //map boundaries
    var h = map(mouseY, 0, height, 0, 200); //size changes based on mouseY
    var a = map(mouseX, 0, width, 0, 200); //size changes based on mouseX
    var b = a / 8;

    //Hypotrochoid curve
    beginShape();
    for (var i = 0; i < numPoints; i ++) {
        stroke(r, g, b);
        strokeWeight(2);
        noFill();
        var t = map(i, 0, 200, 0, TWO_PI)
        x = (a - b) * cos(t) + h * cos(((a - b) / b) * t)
        y = (a - b) * sin(t) - h * sin(((a - b) / b) * t)
        vertex (x, y)
    }
    endShape(CLOSE);
}


function drawTrifolium() { //http://mathworld.wolfram.com/ConicalSpiral.html    
    var x;
    var y;
    var r;

    //constrain    
    var a = constrain(mouseX, width / 5, width / 2);
    
    //outline of light blue spinning trifolium
    noFill();
    stroke(195, 217, 227);
    strokeWeight(0.5);

    //Trifolium curve
    beginShape();
    for (var i = 0; i < numPoints; i++) {
        var t = map(i, 0, numPoints, 0, TWO_PI);
        r = - a * cos(3 * t);
        x = r * cos(t);
        y = r * sin(t);
        vertex(x, y);
    }
    endShape(CLOSE);
}

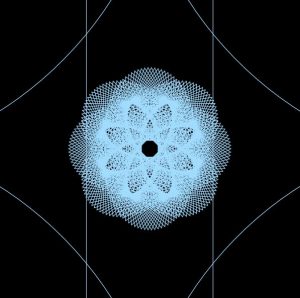
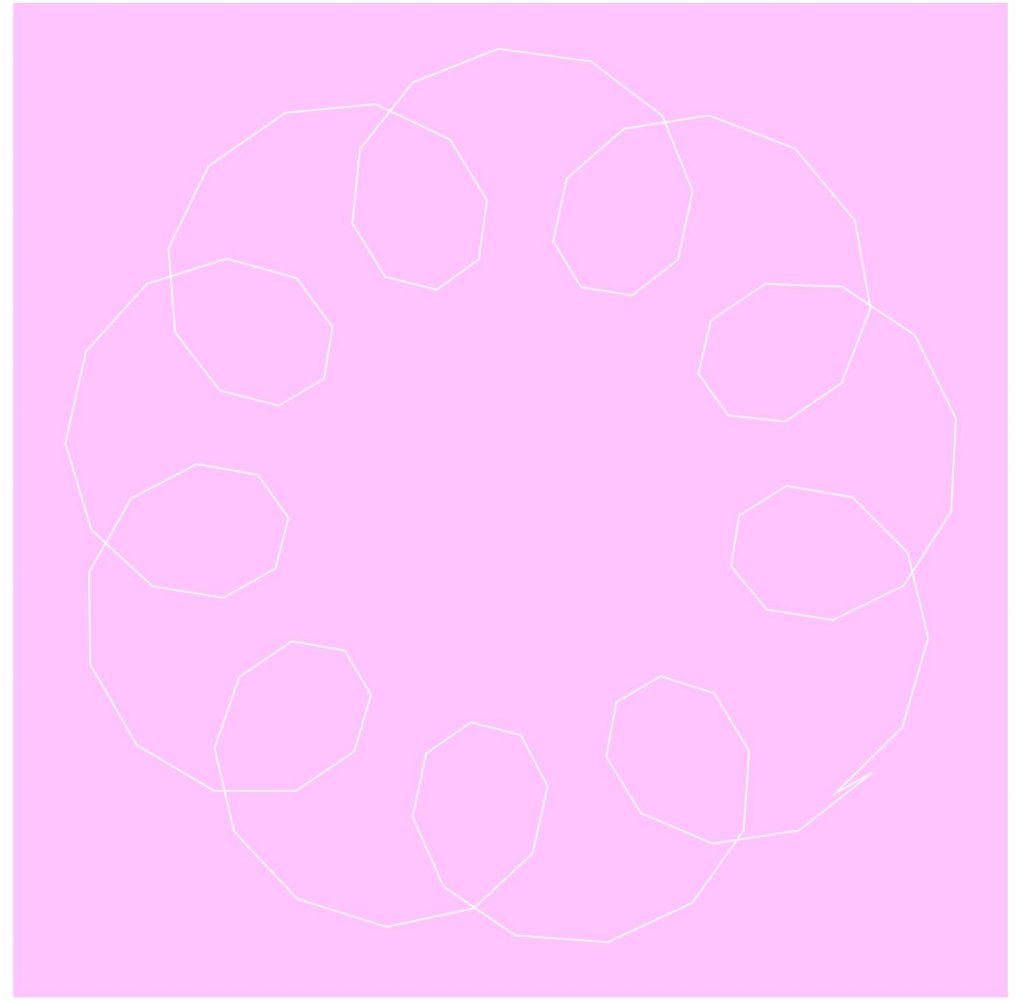
This project took me a while because it took me a while to figure out how to compute each curves. Maneuvering it around the canvas was more interesting for me because it allowed me observe how the code I wrote computed it to animate a certain way.

Ghalya Alsanea – LO-07 – What the street!?

MOVE LAB- Resident Researcher/Artist
Direction
Full Credits
–Data derived from OpenStreetMap (OSM)
This project looks into wasted public spaces in cities. The tool creates awareness about the disparity between the distribution of space for bikes, cars, parking lots, rails, etc.

Who “owns” the city?

They first looked at how much space there is in a city for moving around (ie the allocation/distribution ratios between cars, bikes, etc). The tool, “What the Street!?” is labelled as “The Mobility Space Report”, where the designers created an open-source public tool for exploring urban mobility spaces. They created a fun way to look at inequality of mobility spaces systematically AND interactively.

Play with the tool here!

Cover for About What the Street!?
I choose this project because of how the resulting shapes give a mesmerizing, never before seen perspective of urban spaces. For example, the image above shows all parking spaces in NYC, packed tightly together.

How does it work?

They use the data visualization tools of unrolling, packing, and ordering irregular shapes.  Therefore, they packed and rolled all mobility spaces into rectangular bins to visualize the areas they take up, then the tool allows you to see the same shape on a regular satellite map.

The mobility triangle shows how people move in each city – how much by car, bike, or public transport. Each dot stands for one city, and this specific image is highlighting Berlin (in blue). A dot in the very middle means an even share of these 3 forms of transportation is being used.

With each large dot there is a second dot that shows how much space a city has allocated for moving around with this particular transit mode. If first and second dots coincide, this would mean that city space is allocated in a fair way towards all forms of mobility. The triangle shows that space allocated is unfair: cars get much more space than they “deserve” – and bikes typically get much less. The team hope this tool shines a light on this disparity.

Minjae Jeong-Project-07

sketch

//Minjae Jeong
//Section B
//minjaej@andrew.cmu.edu
//Project-07


function setup() {
    createCanvas(480, 480);
    background('black');
}

function draw() {
    push();// draw in the middle
    translate(width / 2, height / 2);
    drawHypotrochoid();
    pop();
}

//Equations from http://mathworld.wolfram.com/Hypotrochoid.html
 function drawHypotrochoid() {
    var x;
    var y;
    var a1 = mouseX; //move mouse to control hypotrochoids drawing
    var a2 = mouseY;
    var h = 5;

    beginShape(); //draw hypotrochoid
    for (i = 0; i < 480; i += 5){
        var t = map(i, 0, 200, 0, width);
        x = (a1- a2) * cos(t) + h * cos(t * (a1 - a2) / a2);
        y = (a1- a2) * sin(t) - h * sin(t * (a1 - a2) / a2);
        vertex(x, y);
    }
    endShape();


}

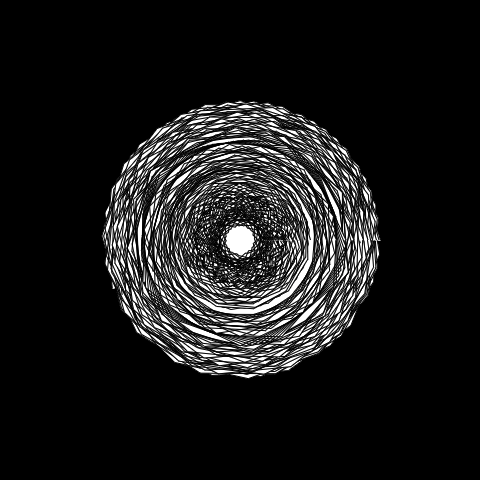
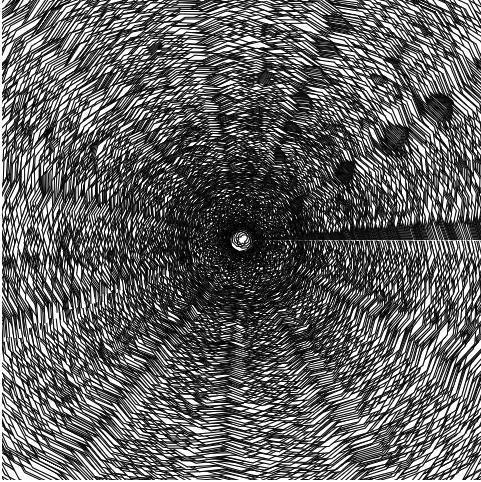
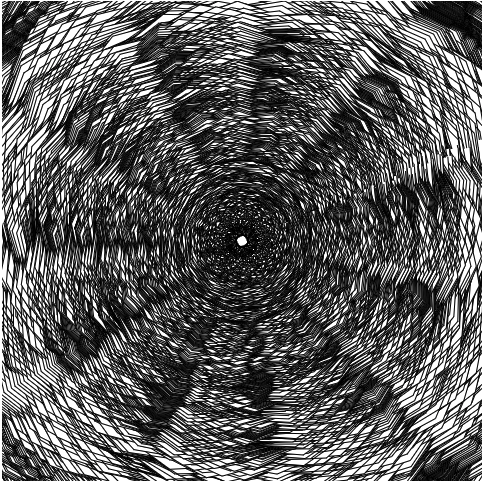
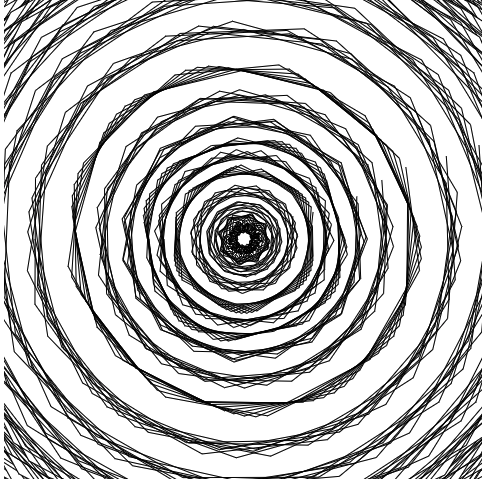
This simple looking black and white drawing with hypotrochoids attracted me more than other colorful tries in many reasons. First of all, the first impression is very wild, and simple. With the mouse cursor starting at the middle of the canvas (240, 240), the canvas starts black, and creates white spaces as the mouse moves. The fun part is, the background will never be pitch black once you move your mouse.

The mouse movement is sensitive, the drawing can change in many ways according to the user control. Although it can’t go full black unless refreshing the page, the drawing can go all-white which can reset the drawing.

Ghalya Alsanea – Project-07-Curves

sketch

//Ghalya Alsanea
//Section B
//galsanea@andrew.cmu.edu
//project-07

var outR;               //outer circle radius
var inR;                //inner circle radius
var d = 100;            //distance for drawing pedal 
var t;                  //theta variable
var points = 10000;     //number of points to draw in for loop
var color2;             //global color variable

//constrained mouse values
var MX;
var MY;
//x and y values for resulting curve
var x;
var y;

function setup() {
    createCanvas(480, 480);
}

function draw() {
    //constrain mouse x and y within the canvas
    MX = constrain(mouseX, 0, width);
    MY = constrain(mouseY, 0, height);

    //map background color based on mouse location
    var color0 = map(MX, 0, width, 150, 250);
    var color1 = map(MY, 0, height, 150, 250);
    background(color0, color1, 200);

    //mapped color value based on mouse y location
    color2 = map(MY, 0, height, 0, 255);

    //draw everything using the center of canvas as (0,0)
    translate(width/2, height/2);
    //map the driving circle dimensions to mous x pos
    n = map(MX, 0, width, 0, 6)
    //rose formula for the radii
    outR = (2*n*d)/(n+1);
    inR = (n-1)*d/(n+1);

    drawHypotrochoid();
    drawBaseCrvs();
}

function drawHypotrochoid() {
    noFill();
    //map color value to mouse y location
    stroke(color2, 0, 0);

    //draw the resulting curve
    beginShape();
    for (var i = 0; i < points; i++) {
        // map theta to full circle radians
        t = map(i, 0, points, 0, TWO_PI);
        //use the mathematical formula of a Hypotrochoid to find x and y values
        x = (outR - inR) * cos(t) + d * cos((outR-inR) / inR * t);
        y = (outR - inR) * sin(t) - d * sin((outR-inR) / inR * t);
        vertex(x, y);
    }
    endShape();

}

function drawBaseCrvs() {
    //draw outer circle
    stroke(0, 0, 255);
    noFill();
    ellipse(0, 0, 2*outR, 2*outR);

    //draw the inner circle and line 
    stroke(0);
    fill(0);
    ellipse((outR+inR) * cos(t), (outR+inR) * sin(t), 5, 5);
    line((outR+inR) * cos(t), (outR+inR) * sin(t), x, y);
    noFill();
    ellipse((outR+inR) * cos(t), (outR+inR) * sin(t), 2 * inR, 2 * inR);

    //draw pedal dot
    fill(color2, 0, 0);
    ellipse(x, y, 5, 5);
}

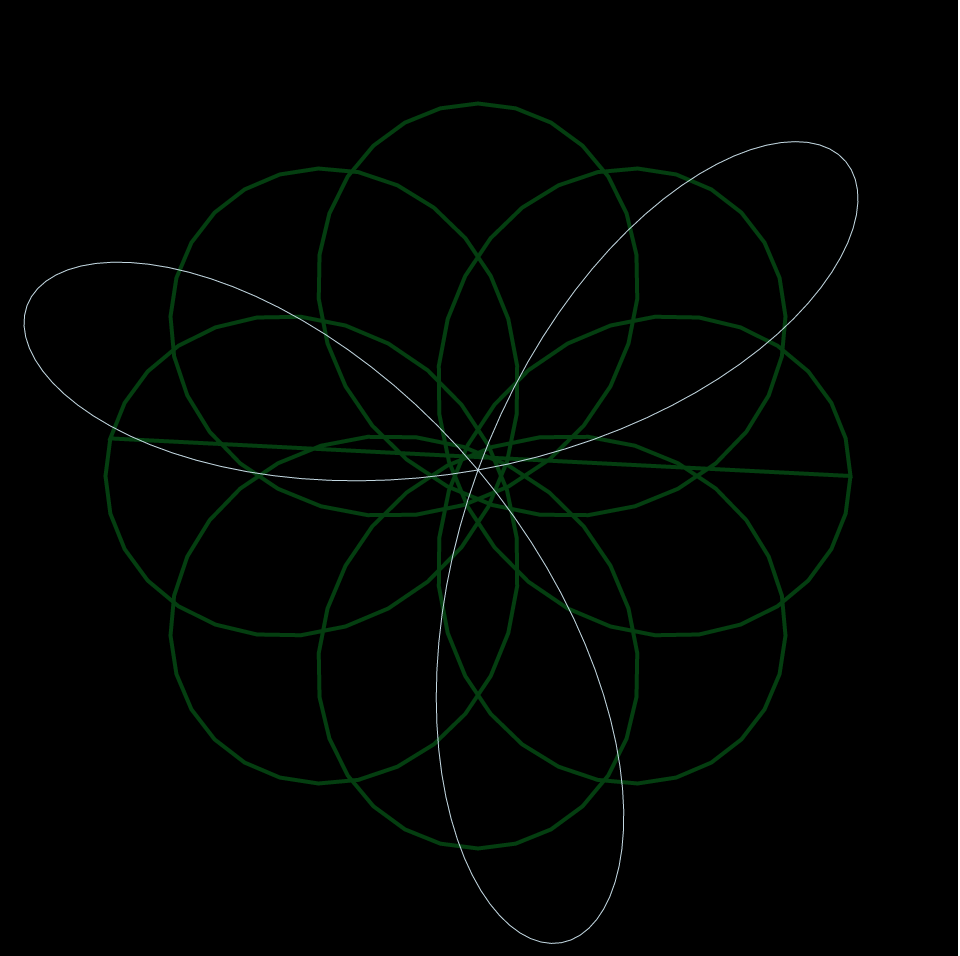
Inspired by the rose variation of a hypotrochoid on Wolfram’s Math World, I tried to show the logic behind how the hypotrochoid curves are drawn as well. In terms of color, the background and the resulting curve’s stroke color change with the mouse location. To add an extra level of interaction, the “n” variable also reacts to the mouse location, which controls the radii of the two circles that create the hypotrochoid, resulting in the manipulation of the resulting overall shape.

Xiaoyu Kang – Project 07 – Curves


sketch

//Xiaoyu Kang
//xkang@andrew.cmu.edu
//Section B
//Project-07

var angles = 0;
function setup() {
    createCanvas(480, 480);
}

function draw() {
    background(0);
    stroke(mouseX, 220, mouseY);
    translate(width / 2, height / 2);
    // all the curves rotate at the same speed
    rotate(radians(angles));
    angles += (mouseY/30);
    drawCruciform(); 
    drawAstroid();
    drawEpitrochoid();
}

function drawCruciform() {
    // http://mathworld.wolfram.com/Cruciform.html
    push();
    noFill();
    strokeWeight(1);

    
    //creates the cruciform
    beginShape();
    var a = map(mouseX, 0, width, 0, 300);
    var b = map(mouseY, 0, height, 0, 300);
       
    for (var i = 0; i < 800; i++) {
        var t = map(i, 0, 150, 0, TWO_PI);
        var x = a * 1 / (cos(t));
        var y = b * 1 / (sin(t));
        vertex(x, y);
    }
    endShape();
    pop();
}

function drawAstroid() {
    // http://mathworld.wolfram.com/Astroid.html
    push();
    noFill();
    strokeWeight(1);
    
    //draw astroid
    beginShape();
    var a = map(mouseX, 0, width, -300, 300);

    for (var i = 0; i < 500; i++) {
        var t = map(i, 0, 150, 0, TWO_PI);
        var x = 3 * a * cos(t) + a * cos(3 * t);
        var y = 3 * a * sin(t) - a * sin(3 * t);
        vertex(x, y); 
    }
    endShape();
    pop();
}

function drawEpitrochoid() {
    // http://mathworld.wolfram.com/Epitrochoid.html
    push();
    noFill();
    strokeWeight(1);
    
    //draw epitrochoid
    beginShape();
    var a = map(mouseX, 0, width, -100, 100);
    var b = map(mouseX, 0, width, -100, 200);
    var h = map(mouseY, 0, height, -300, 200);


    for (var i = 0; i < 600; i++) {
        var t = map(i, 0, 150, 0, TWO_PI);
        var x = (a + b) * cos(t) - h * cos(((a+b)/b) * t);
        var y = (a + b) * sin(t) - h * sin(((a+b)/b) * t);
        vertex(x, y); 
    }
    endShape();
    pop();
}

For this project, I really want to create curves that are diverse in shape as the mouse moves around. I picked three curves that are all very different in shape an as the mouse moves they turn into patterns with different level of complexity. Also to add some more visual elements, I changed the color setting so that as the mouse moves the color changes as well.

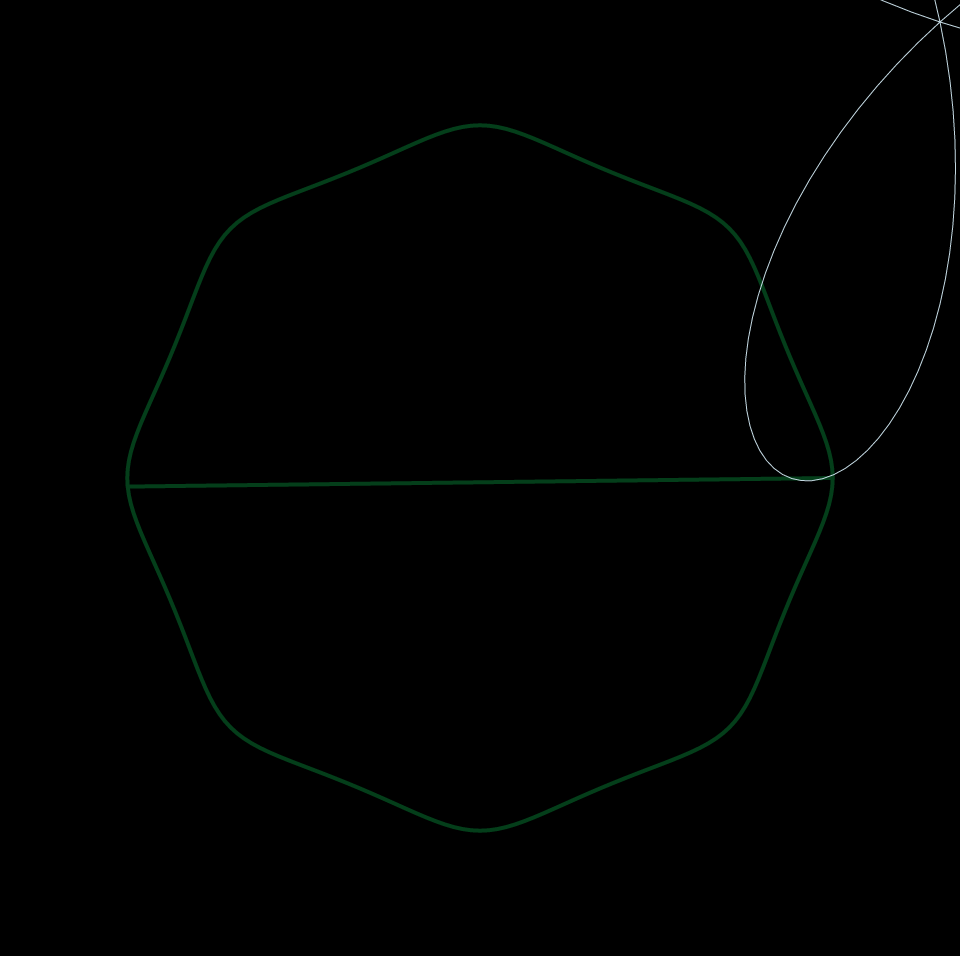
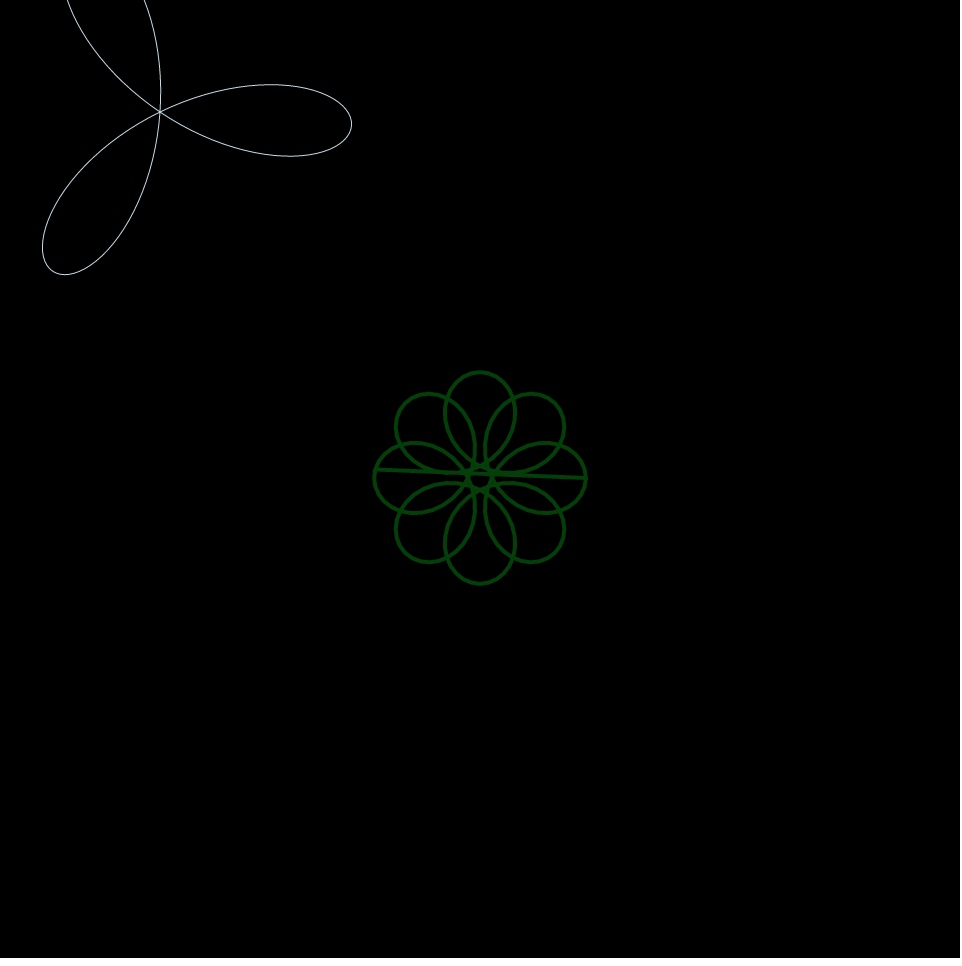
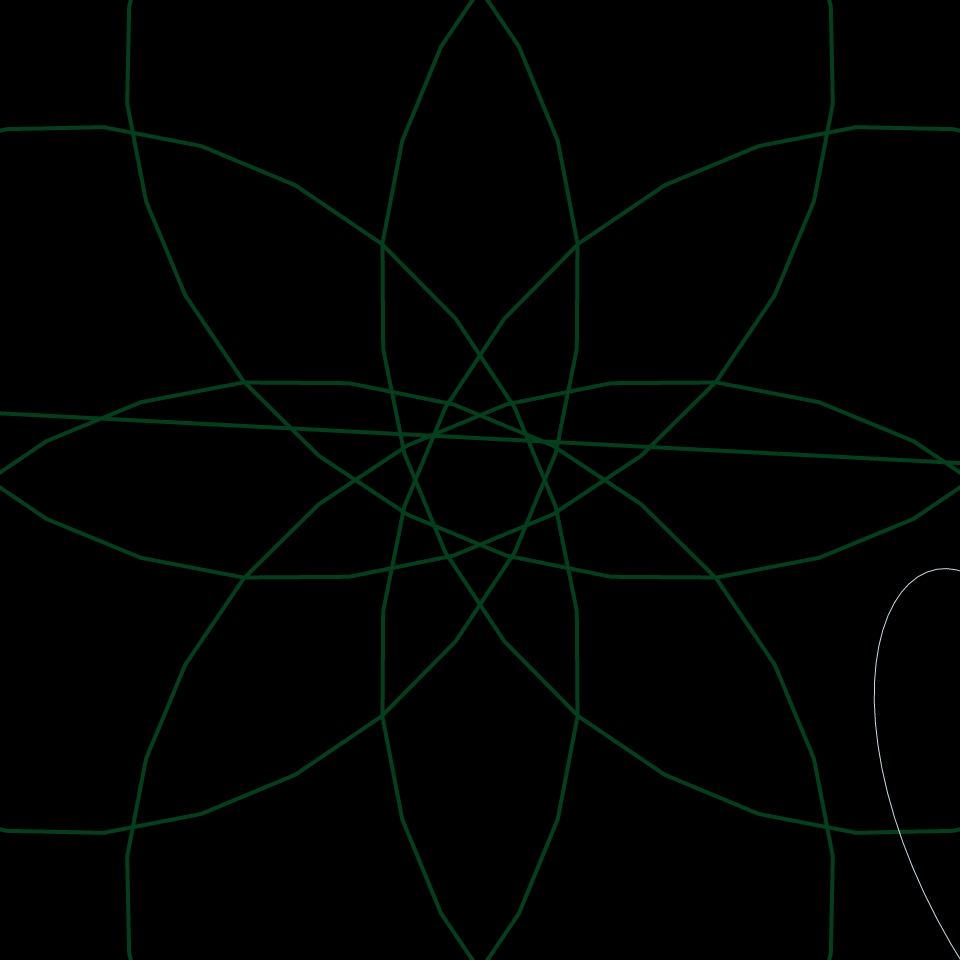
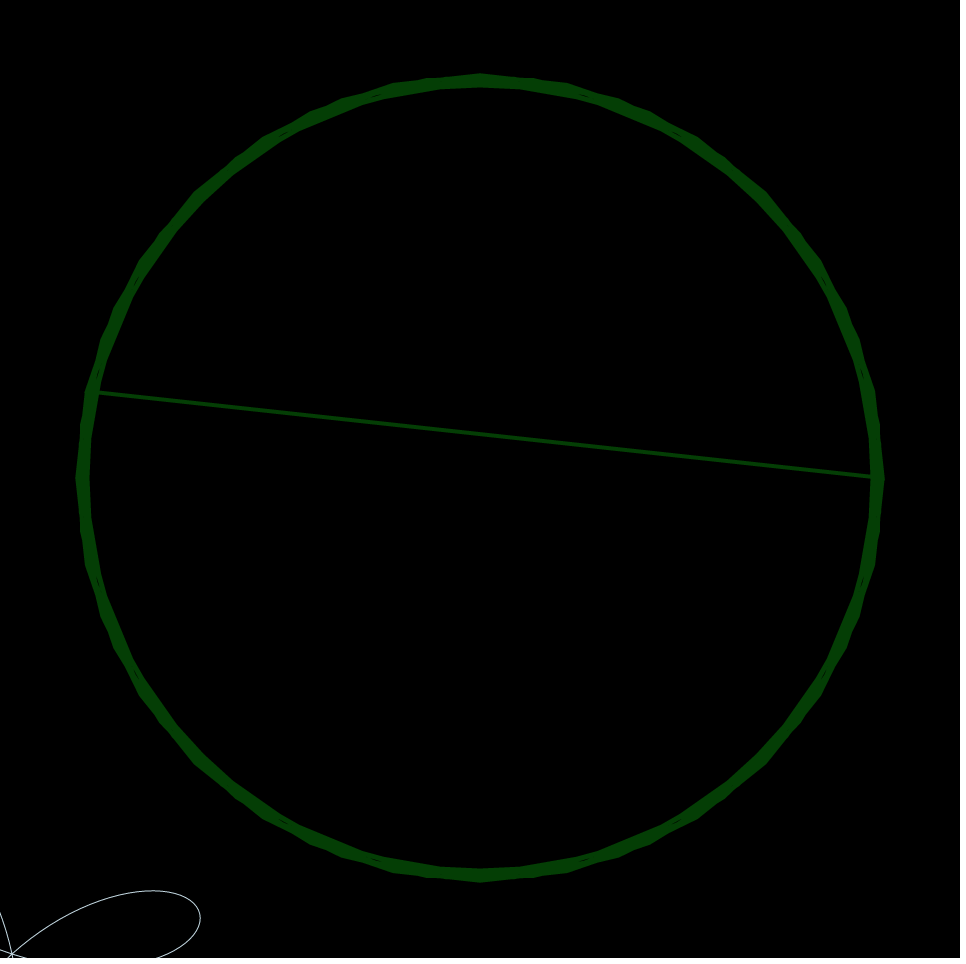
Xu Xu – Project 07 – Curves

sketch

//Claire Xu
//xux1@andrew.cmu.edu
//Section B
//Project-07
var angle = 0;

function setup() {
    createCanvas(480, 480);
    frameRate(100);
}


function draw() {
    background("black");
    push();
    translate(width/2, height/2);
    rotate(radians(angle));
    angle += mouseX;
    drawAstroid();
    drawEightCurve();
    drawHypocycloid();
    pop();
}
function drawAstroid() {
    var b = map(mouseY, 0, width, -100, 150);
    strokeWeight(3);
    stroke(157,68,110);
    noFill();
    beginShape();
    for (var i = 0; i < 300; i++){
        var t = map(i, 0, 100, 0, TWO_PI);
        var x = (3*b*cos(t) + b*cos(3*t));
        var y = (3*b*sin(t) - b*sin(3*t));
        vertex(x, y);
    }
    endShape(CLOSE);

}
function drawEightCurve() {
    strokeWeight(2);
    stroke(252,158,33);
    noFill();
    var a = map(mouseX, 0, width, 0, 100); 
    beginShape();
    for (var i = 0; i < 800; i++){
        var t = map(i, 0, 100, 0, TWO_PI);
        var x = (a*sin(t));
        var y = (a*sin(t)*cos(t));
        vertex(x, y);
    }
    endShape(CLOSE);
}

function drawHypocycloid() {
    strokeWeight(1);
    stroke(255,111,97);
    noFill(); 
    var a = map(mouseX, 0, width, 0, 150);
    var b = map(mouseY, 0, width, 0, 150);
    beginShape();
    for(var i = 0; i < 400; i++){
        var angle2 = map(i, 0, 100, 0, TWO_PI);
        var x = ((a - b)* cos(angle2) - b*cos(((a - b))*angle2));
        var y = ((a - b)* sin(angle2) + b*sin(((a - b))*angle2));
        vertex(x, y);
    }
    endShape(CLOSE);
}

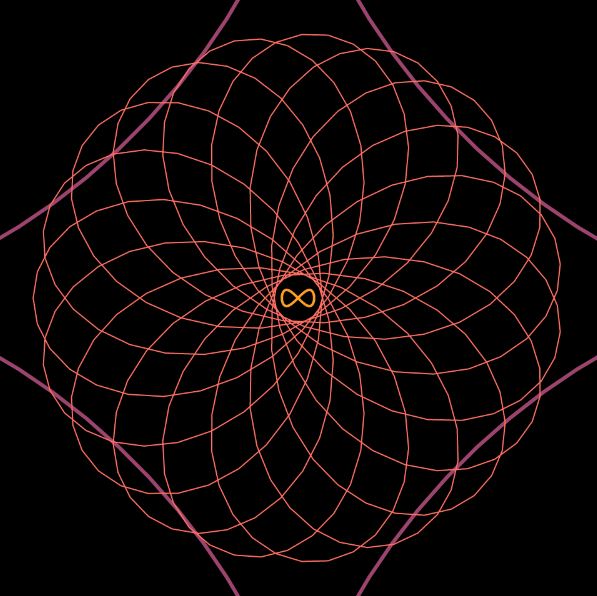
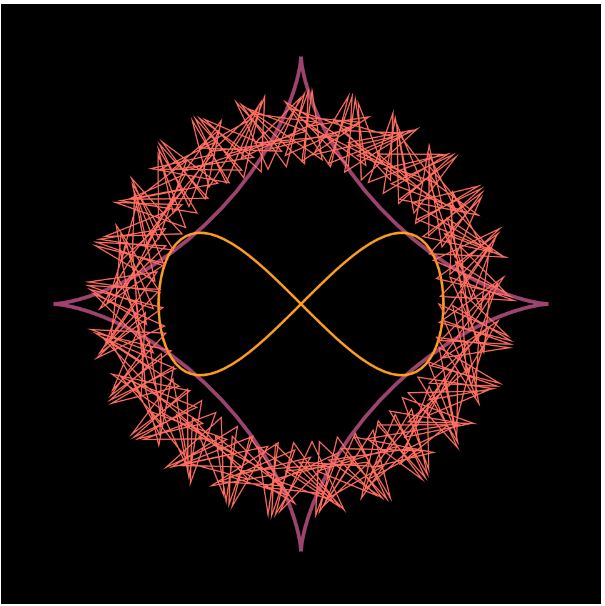
This project was quite challenging, because it took me a long time before I figured out what part of the code modified which part of the drawn form. I wanted to create spiraling geometric shapes that are web-like, and I was really interested in Hypocycloid, because it seemed to be less “restrictive” than other curves. I think the rotation makes it look more fun, because it gives the drawing a new dimension.

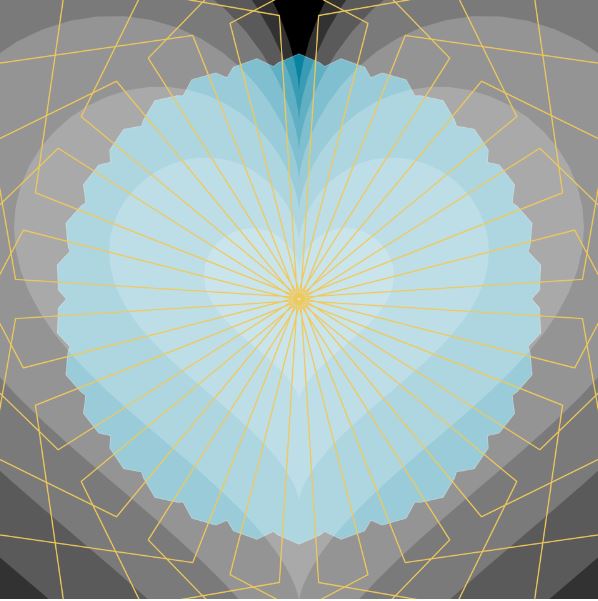
Crystal-Xue-Project-07

sketch-135.js

//Crystal Xue
//15104-section B
//luyaox@andrew.cmu.edu
//Project_07


var nPoints = 100;
function setup() {
    createCanvas(480, 480);
}

function draw() {
    background(0);
    translate(width/2, height/2);
    drawEpitrochoid2();
    drawHeart();
    drawEpitrochoid();
}


function drawEpitrochoid2() {

    //geometry rotation
    rotate(map(mouseX, height, 0, TWO_PI, 0));

    //color gradiant
    var from = color(208, 16, 76);
    var to = color(0, 137, 167);
    var cH = lerpColor(from, to, map(mouseY, 0, width, 0 , 1));
    stroke(255);
    strokeWeight(0.2);
    fill(cH);

    //geometry parameters
	var a = map(mouseX, 0 , width, 50, 200);
    var b = a/30;
    var h = map(mouseY,0, height, 100, 0);

    //plotting geometry
	beginShape();
	for (var i = -1; i < 100; i ++) {
		var t = map(i, 0, 100, 0, TWO_PI);
        x = (a+b)*cos(t)-h*cos(((a+b)/b)*t);
        y = (a+b)*sin(t)-h*sin(((a+b)/b)*t);
		vertex(x, y)
	}
	endShape();
}

function drawHeart(){

    //stop heart shapes from rotation
    rotate(map(mouseX, height, 0, 0, TWO_PI));
    push();
    noStroke();
    fill(255,50);

    //size
    var h = map(mouseY, 0, height, 0, 5);

    //for how many layers of heart shapes
    for (var z = 1; z < 8; z++) {

        //plotting geometry
        beginShape();
        for (var i = 0; i < nPoints; i++) {
            var t = map(i, 0, nPoints, 0, TWO_PI);
            //heart equation
            x = 16 * pow(sin(t),3);
            y = -13 * cos(t)+ 5 * cos(2 * t) + 2 * cos(3 * t) + cos(4 * t);
            vertex(x*z*h,y*z*h);
        }
        endShape(CLOSE);
    }
}

function drawEpitrochoid() {

    //geometry rotation
    rotate(map(mouseY, 0, height, 0, TWO_PI));

    //color gradiant
    var from = color(178, 43, 206);
    var to = color(247, 217, 76);
    var cH = lerpColor(from, to, map(mouseX, 0, width, 0 , 1),100);
    stroke(cH);
    strokeWeight(1);
    noFill();

    //geometry parameters
    var a = map(mouseX, 0 , width, 50, 200);
    var b = a/20;
    var h = map(mouseY,0, height, 50, 200);

    //plotting the geometry
	beginShape();
	for (var i = -1; i < 100; i ++) {
		var t = map(i, 0, 100, 0, TWO_PI);
        x = (a+b)*cos(t)-h*cos(((a+b)/b)*t);
        y = (a+b)*sin(t)-h*sin(((a+b)/b)*t);
		vertex(x, y)
	}
	endShape();
}

This project is very intriguing to me because I got to explore the artistic value of math and geometry in a larger span.

state-01
state-02

Claire Lee – Project 07 – Curves

project07

/* 
Claire Lee
15-104 Section B
seoyounl@andrew.cmu.edu
Project-07
*/

var nPoints = 100;
var angle = 0;
//initial global variables

var bgRed = 135;
// background color variable

function setup() {
    createCanvas(480, 480);
    background(bgRed, 195, 255);
}

function draw() {
    bgRed = 150 + (mouseX * (120 / width));
    background(bgRed, 195, 255);

    push();
    translate((width / 2), (height / 2));
    rotate(radians(mouseY));
    hypotrochoidCurve();
    pop();
    // place curve in center, govern rotation by mouseY

    push();
    translate((width / 2), (height / 2));
    rotate(radians(mouseX));
    epitrochoidCurve();
    pop();
    // place curve in center, govern rotation by mouseX 

    push();
    translate((width / 2), (height / 2));
    rotate(radians(mouseX * 5));
    deltoidRadialCurve();
    pop();
    // place curve in center, govern rotation by mouseX 
    // comparatively faster rotation
}

function hypotrochoidCurve() {
    var a1 = map(mouseX, 0, 480, 80, 200);
    //size changes with repsect to mouseX
    var b1 = 30; 
    var h1 = (mouseX / 10);
    var angle1 = 0;
    // variables for shape 1 (hyopotrochoid)

    strokeWeight(1);
    stroke(255);
    noFill();
    beginShape();
    for (var i = 0; i < nPoints; i++) {
        var angle1 = map(i, 0, nPoints, 0, TWO_PI);
        x1 = (a1 - b1) * cos(angle1) + h1 * (cos(((a1 - b1)/ b1) * angle1));
        y1 = (a1 - b1) * sin(angle1) + h1 * (sin(((a1 - b1)/ b1) * angle1));
        vertex(x1, y1);
    }
    endShape(CLOSE);
    //hypotrochoid curve
}

function epitrochoidCurve() {
    var a2 = map(mouseX, 0, 480, 50, 100);
    //size changes with respect to mouseX
    var b2 = 50;
    var h2 = (mouseY / 20);
    var angle2 = 0;
    // variables for shape 2 (epitrochoid)

    strokeWeight(1);
    stroke(255);
    fill(255, 255, 255, 50);
    beginShape();
    for (var i = 0; i < nPoints; i++) {
        var angle2 = map(i, 0, nPoints, 0, TWO_PI);
        x2 = (a2 + b2) * cos(angle2) - h2 * cos((a2 + b2) * angle2);
        y2 = (a2 + b2) * sin(angle2) - h2 * sin((a2 + b2) * angle2);
        vertex(x2, y2);
    }
    endShape(CLOSE);
    // epitrochoid curve
}

function deltoidRadialCurve() {
    var a3 = map(mouseY, 0, 480, 0, 100);
    //size changes with respect to mouseY
    var angle3 = 0;
    // variables for shape 3 (deltoid radial)

    strokeWeight(1);
    stroke(255);
    fill(255, 255, 255, 50);
    beginShape();
    for (var i = 0; i < nPoints; i++) {
        var angle3 = map(i, 0, nPoints, 0, TWO_PI);
        x3 = (1/3) * a3 * (2 * cos(angle3) + cos(2 * angle3));
        y3 = (1/3) * a3 * (2 * sin(angle3) - sin(2 * angle3));
        vertex(x3, y3);
    }
    endShape(CLOSE);
    // deltoid radial curve   
}

This project was really interesting because I got to see how I could adjust different variables within parametric equations to change with respect to mouse position. I wanted to create something relatively simple that resembles a “blooming” flower as the mouse moves position from (0,0) to (480,480). Admittedly, this took a bit of trial and error, and I ran into a lot of formatting issues in the beginning, but I’m pretty satisfied with how it turned out.

The first hypotrochoid curve — “petals”
Addition of the epitrochoid — “center”

Siwei Xie – Looking Outwards – 08

Meejin Yoon is an architect, designer, and educator, whose projects and research investigate the intersections between architecture, technology, and the public realm. Prior to joining the faculty at AAP, Yoon was at MIT for 17 years and served as the head of the Department of Architecture from 2014–18. 

I admire her work that includes interactive public space projects bridging issues of technology and play in the public sphere. Her works have great variety and social values. Spanning work over the past decade, topics covered will include responsive technologies, smart materials, renewable energy, media based public art, public engagement and the public process. I admire the interactive technologies she uses in the interactive architectures. 

She uses relevant data and images effectively to help audience understand. I will incorporate this strategy and present images during my working processes.

In her speech, she backed her data with the studio established in 2001, which she pursues creative works at the intersection of architecture, art and technology. The firm is an international interdisciplinary design practice working across the domains of architecture, urban design, public space, immersive experience, and design strategy.

Link to her website.

Meejin Yoon’s speech on Eyeo 2015.