aranders-project-07

aranders-project-07

//Anna Anderson
//Section D
//aranders@andrew.cmu.edu
//project-07

var nPoints = 100;

function setup() {
  createCanvas(400, 400);
  frameRate(10);
}

function draw() {
  background(250, 250, 200);
  textSize(25);
  text("GOOD", width / 2 - 38, 40);
  text("LUCK", width / 2 - 33, 380);
  push();
  noStroke();
  translate(width / 2, height / 2);
  drawquadrifolium();
  pop();
}

function drawquadrifolium() {
  var x;
  var y;
  var r;
  var a = constrain(mouseX, 5, 230);

  fill(0, 153, 51);
  beginShape();
  for (var i = 0; i < nPoints; i++) {
    var t = map(i, 0, nPoints, 0, TWO_PI);
    r = a * sin(2 * t);
    x = r * cos(t);
    y = r * sin(t);
    vertex(x, y);
  }
  endShape(CLOSE);
}

I made this shape called a quadrifolium. I found it on the website which was given to us to look at curves. I knew what I wanted to do right when I saw it. It took me a while to get the hang of the different variables within the equation, but I ended up liking the project. The image is inspired by a four leaf clover for good luck. I could use some of that for the rest of this semester. Actually, for the rest of my life.

atraylor – Project 07 – Section B

sketch

// atraylor@andrew.cmu.edu
//Project 07
// Section B


var a = 0;


function setup() {
    createCanvas(400, 480);
    noStroke();
}

function draw() {
    background(171, 163, 247);
    scribble();
}

function scribble(i, a, rad2, x, y) { // make the curve
    a = map(mouseX, 0, width, 10, 110); // number of lines in curve by mouse position
    var rad2 = 40; // staring radius

    beginShape();
    fill(203, 90, 243, 10);
    stroke(151, 227, 245);
    translate(width/2, height/2); //center
    for(var i = 0; i < a; i++) {
        var theta = map(i, 0, a/80, 0, TWO_PI); // apply values of i to radians in circle
        var x = rad2 * cos(theta); // x position of vertex
        var y = rad2 * sin(theta); // y position of vertex
        vertex(x, y);
        rad2 *= 1.02; // this makes it a spiral rather than a circle.
    endShape();
    }
}

For this project I used a parametric version of the logarithmic spiral to draw my curves. I played with it so the function would draw various shapes rather than simply growing a spiral when segments were added. There are several areas where you can see the near perfect spiral, and others where it’s simply a mess of lines. Its interesting to see the shapes that are spirals but have clear sides so they form stars, triangles, or pentagons. I added a fill to the curve with an alpha channel to emphasize the growth and change of the shape.

kyungak-lookingoutwards-07

(Simon Russell, Audio Geometry: Circles Within Circles, 2016)

Simon Russell is an artist that explores the relationship between sound and shape. He utilizes the program “Houdini” to create and earn audio files produced by collusions of f-curves. Most sounds are created through 3D geometric shapes, and their heights differentiate the pitch of the sounds. After sounds are created in Houdini, they are then exported to Cinema 4D. Additional geometric shapes are rendered afterwards to create visuals that go with the sounds. This project is fascinating because the sound files and the geometric shapes are original. The sound comes from randomly colliding set of geometric shapes, and the sound in return produces a new representing set of geometric shapes. The give and take relationship of these factors seemed very new and interesting to me. The visuals were also very aesthetically pleasing, which is also a plus in terms of artistic sensibilities.

Jihee Kim_SectionD_Project-07-Curves

jiheek1_project7

//Jihee Kim
//15-104 MWF 9:30
//jiheek1@andrew.cmu.edu
//Project 7 Curves
//section D

var backgroundRed;// Red value of background
var backgroundGreen = 245; // Green value of background
var backgroundBlue = 252;// Blue value of backgound

function setup() {
    createCanvas(480, 480);

}


function draw(){
    background(backgroundRed, backgroundGreen, backgroundBlue);
    //The background color changes from light blue to light pink
    //when mouseY moves from top to bottom of canvas
    backgroundRed = map(mouseY, 0, height, 219, 255); //R value changes

    push();
    translate(width/4, height/3); //push over the generating point of curves
    for (var i = 1; i < 16; i++) { //loop from first to sixteenth value
        //show depth through color and lineweight
        stroke(map(i, 1, 5, 30, 120)); //the stroke turns from grey to lighter
                                       //grey as the curve moves away from
                                       //the focal point of curves
        strokeWeight(map(i, 1, 5, 0.3, 2)); //strokeWeight increases as curves
                                            //get further away from focal point
        //call the drawCurve function to draw curves
        drawCurve(i*2); //use 'i' as scale factor for spacing between curves
        rotate(PI/3); //rotate each time a curve is drawn
    }
    pop();
}


function drawCurve(scaleF) { //using 'i' as the scale factor (scaleF)
    var a = 15;
    var b = (map(mouseX, 0, width, -1, 1)); //the curves form a hypocycloid
                                            //when b(radius of rolling circle)
                                            //is negative, and a epicycloid
                                            //when the value is positive
    noFill();
    //start shape
    beginShape();

    for (var i = 0; i < 200; i++) { //a bigger max gives you a smoother curve
        var t = map(i, 0, 200, 0, 2*PI); //map 't' so that it only rotates
                                         //full circle once (2PI)
        var x = (a + b) * cos(t) - b * cos((a/b + 1) * t);
        var y = (a + b) * sin(t) - b * sin((a/b + 1) * t);
        vertex(scaleF*x, scaleF*y);
    }
    //end shape
    endShape(CLOSE); //this caps the beginning and the end
}

For this project, I created an interactive set of curves that were generated though a mathematical equation. I made it so that the shape that the curves form morphs from a hypocycloid to an epicycloid (left to right) depending on the position of the mouse.

Some other aspects that I manipulated so that the main theme, which is depth, is clear are lineweights, color, and spacing. Using for loops and mapping, I made it so that the stroke turns from grey to a lighter color on the greyscale as the curves move away from the focal point of curves. Moreover, the lineweight of these curves also increases as the curves get further away from the focal point.

hypocycloid (clouds)
curves (midway)
epicycloid (flower)

The curves are supposed to look like a sky full of clouds when they are forming a hypocycloid, and a flower when they are forming a epicycloid. The background color varies with the y position of the mouse, adding to the intention behind incorporating both cyclodal curves, as well.

math equation source

Jihee Kim (Section D)– LookingOutwards-07

The Shadow Peace is a short film that presents the effects of nuclear war. Neil Halloran, one of the most brilliant data visualizers in the world created this video using custom software to quantify the consequences of nuclear war, as the possibility of it happening has been constantly increasing especially with tension building up between the US and North Korea. He compares trends like casualties in wars and bombing in the past with his software and depict them through visual elements.

scene from the short film that demonstrates data and its visualization

It is fascinating how Halloran communicates data through his short films so effectively. A lot of it has to do with the visually enticing elements of the video that are made possible by simple geometries that represent data, comparison (in this case Hiroshima bomb attack, etc.) and narration. More specifically, elements such as bar charts are thoughtfully used and placed (on timelines, globes, etc.) so that the viewers could put information and data into context. His approaches to data visualization show his focus on bestowing relevance to data sets that could have no meaning to some people.

Halloran certainly touches people’s senses through his data visualization so that global matters/issues like war do not feel so distant and irrelevant to people. He allows us to hear and see data -data that connects the people to the world through visualization.

For more information on The Shadow Peace, visit:
The Shadow Peace
An interview with the creator on the project can be found here:
The Shadow Peace Interview

eeryan-LookingOutwards-07

I find data visualization to be an interesting intersection between programming and graphic design/art as the better it is executed, the more likely people are to try to absorb the information given.

I chose to look at Fernanda Viegas’ chromogram, a data visualization piece that tracks what Wikipedia users (editors, not readers) search for. The algorithm tracks the first three letters of Wikipedia searches, and assigns a color to the string, resulting in a series of lines of blocked color that allows viewers to pick out repeated trends in editor activity.

The above photo is an example of this, tracking the searches of a single editor who focused on naval centric articles. The purple is the string “USS”.

Link to the project

sntong-LookingOutwards-07

Nicholas Rougeux is a self-taught digital artists who wanted to visualize and provide a new way music can be read, thus creating the project Off the Staff. With the help of some scripting by Peter Jonas from MuseScore that helped Nicholas to efficiently and accurately create the animation using the program NodeBox. His creative way of interpreting and reading music has introduced a new way for people to appreciate music and demonstrate its complexity, although in a very abstract way, to those who do not have a music background.

keuchuka looking outwards 07

This “Chromogram” made in 2007 by Fernanda Viégas and Martin Wattenberg investigates how participants in Wikipedia allocate their time. The visualization technique can display very long textual sequences through a color coding scheme. The first 3 letters of a string determine the color in the Chromogram. The fist letter determines the hue, the second the saturation, and the third the brightness. Numbers become shades of gray. This system seems arbitrary but reveals some subtle patterns in Wikipedia editing. Wikipedians tend to engage in systematic activities by preserving a sustained related sequence of edits. Some editors concentrate on particular topic areas – which reveals a relatively constant color throughout the Chromogram. In other cases, users have completing a task that spans a variety of Wikipedia articles, such as categorizing and alphabetizing. This shows up as various colors or rainbows on the Chromogram. Chromogram reveals an organized systematic activities that help us understand the self-allocation of effort in Wikipedia.

Project-07 Composition with Curves

//Yoonseo(Dave) Choi
//Section B
//yoonseo1@andrew.cmu.edu
//Project 07
var npoints =100; //points for generating curve
function setup() {
    createCanvas(480,480); //canvas size of 480 by 480
    angleMode(DEGREES); //set radian to degree

}

function draw() {
    background(0);//set background to black
    stroke(255); //curve colro tobe white 
    var mx = constrain(mouseX,30,width-30); // return mousex value within constrain
    var my = constrain(mouseY,30,height-30); //return mousey value within constrain
    noFill(); //no fill on geometry
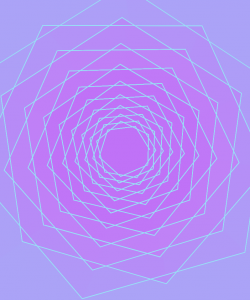
    heart(mx,my); // execute heart function wiggly heart
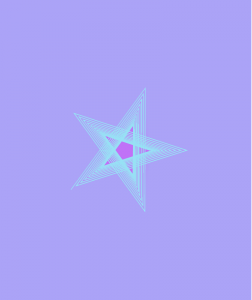
    heart2(mx,my); //execute heart2 function line following mouse
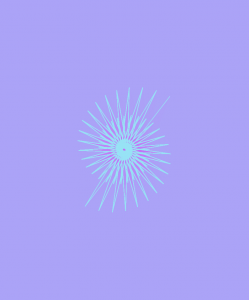
    nails(mx,my);
}
function heart(rn1,rn2){ //for getting parameter for x,y mouse 
    strokeWeight(0.5); //set stroke size to 0.5
    push() 
    beginShape();
    translate(width/2,height/2) // make it center at middle 
    for (var i =0; i <npoints;i++) { // for loop for creating geometry
    var t = map (i,0,npoints,0,360); // map t value to degree
    var x = 16*sin(t)*sin(t)*sin(t); // x function from the mathworld wolf cam
    var y = 13*cos(t)-5*cos(2*t)-2*cos(3*t)-cos(4*t); //y function from mathworld wolf cam 
    vertex(x*rn1/40+(rn1/50*random(-0.5,0.5)),-y*rn2/40+(rn2/50*random(-0.5,0.5))); //create heart shape with wiggle 
    //as mouse move wiggle gets small or big
    }
    endShape(CLOSE); //end the geomtry
    pop();
}
function heart2(rn1,rn2){
    strokeWeight(0.5);//set stroke size to 0.5
    push();
    
    for (var i =0; i <npoints;i++) { // for generating geometry
    var t = map (i,0,npoints,0,360); // t value to degree
    var c = color (150,0,0); // color to red 
    stroke(c); // set stroke color to red
    var x = 16*sin(t)*sin(t)*sin(t); // heart x
    var y = 13*cos(t)-5*cos(2*t)-2*cos(3*t)-cos(4*t);//heart y 
    line(rn1,rn2,x*rn1/60+width/2,-y*rn2/60+height/2); //create line from heart to mouse position
}
    pop();
}
function nails(rn1,rn2){
    stroke(255,81,51,500-(rn1+rn2)/2) //color alpha change based on the mosue
    strokeWeight(0.4);  //stroke weight 

    push(); 
    beginShape();
    translate(width/2,height/2);
    for (var i =0; i <npoints; i++){
    var t = map (i,0,npoints,0,360); //mapping to dgrees 
    var r = map((rn2+rn1),0,(height+width),0,100); // mapping radius to max 100 based on mouse
    var x = r*cos(t); // circle x
    var y = r*sin(t); //circle y 
    vertex(x*rn1/200,y*rn2/200);//outer line for the vertex
    vertex(x*rn1/150,y*rn2/150);//inner circle for connecting 
  }
    endShape(CLOSE); //close the geometry 
    pop();
}

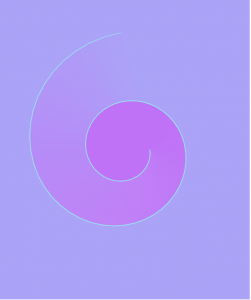
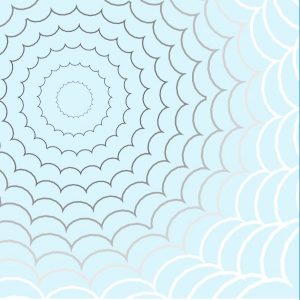
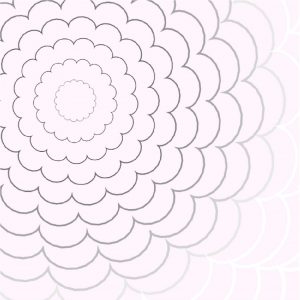
While I was searching for which curve to play with, I found heart shaped curve. I wanted to express emotion that I was having when the idea came up. I wanted the heart to give unstable look with directional element. At the same time, I look for other curve that could be used to show nail. I wanted to illustrate nails in the heart when heart is small but as it grow, nail starts to disappear. I have used r cos(theta) and r sin(theta) to generate the circular curve that will be used to represent the nail. To show the instability of the heart I used the wiggling motion, and I have used line to move along with the mouse coordinate to show dynamic direction that heart can point to.

jwchou-LookingOutwards-07

Project: American Panorama by Stamen Inc.

A map by Stamen showing foreign-born populations in the USA using data. Each country is shown proportionally by size.

Stamen is a company that specializes in very unique and data-centered visualizations. Many of their projects are based on geography/mapping.

For one of their projects in collaboration with Mellon Foundation, Stamen created a suite of software tools that generate maps! They used their software to make maps that portrayed a diverse set of data about America, such as physical objects (canals and trails) and statistics such as foreign-born populations in America. The creators’ artistic sensibilities are portrayed in the different aesthetic choices of the maps, such as color, layout, type choice, etc… (graphic design).

I really admire how they made the software accessible on GitHub for anyone to use/explore, which shows that they realize how data visualization can be a powerful tool for education.

American Canals

These maps were a collaborative effort with the Digital Scholarship Lab. They analyzed and compiled many data sets, and Stamen used their software to visualize it.