![[OLD FALL 2017] 15-104 • Introduction to Computing for Creative Practice](https://courses.ideate.cmu.edu/15-104/f2017/wp-content/uploads/2020/08/stop-banner.png)
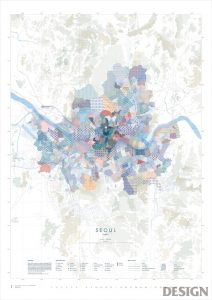
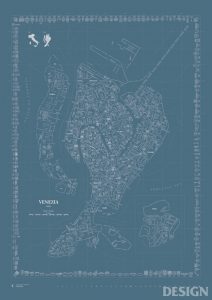
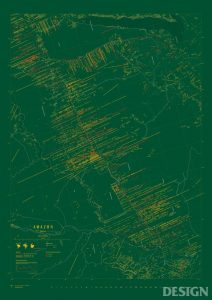
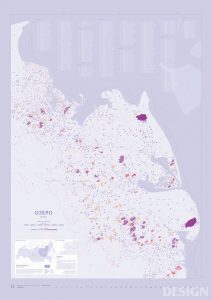
Map is one of the most notable use of information visualization in a way that it is a combination of information based on carefully formulated intention and utility. For creating a map, designers need to take multiple things into consideration: the quality of aesthetics, readability, and most importantly, delivery of information. For this week’s looking outwards, I looked into graphic maps created by Amoeba Group based in Seoul, Korea. Amoeba Group focuses on data visualization, specializing in transferring the data onto a two-dimensional map.
From an interview of CEO of Amoeba Group I found on the web, he states that they first refer to google Earth and Open Street Maps to figure out the the tiniest alleys and streets names when studying the geographical data. Then, they move on to learn about the traditional map-making process, understanding the logistics and the characteristics of maps. Once that’s finished, they move on to understanding the specific geographical and cultural significance of the region of the map.
I found this map project particularly interesting because; first, I was very drawn to the graphic quality of the project; second, map is an area of data visualization that I seemed to have overlooked.