![[OLD FALL 2017] 15-104 • Introduction to Computing for Creative Practice](https://courses.ideate.cmu.edu/15-104/f2017/wp-content/uploads/2020/08/stop-banner.png)
//Christopher Reyes
//Section D
//creyes1@andrew.cmu.edu
//Project-07 (Composition with Curves)

var nPoints = 10000;

function setup() {
    createCanvas(480, 480);
    background(57, 64, 83);
}

function draw() {
    background(57, 64, 83);
    noStroke();

    //Darker circle
    fill(78, 74, 89);
    ellipse(width/2, height/2, 250, 250);

    //Lighter inner circle
    fill(110, 99, 98);
    ellipse(width/2, height/2, 200, 200);

    //Orbitals
    orbiter(0, 360, 200, 10);
    orbiter(0, 360, -200, 10);
    orbiter(360, 0, 175, 20);
    orbiter(360, 0, -175, 20);

    //Biggest, green rose
    push();
    translate(width/2, height/2);
    roseCurve(50, 200, 0, 10,
              [124, 174, 122],
              map(mouseY, 0, height, 1, 2.5));
    pop();

    //Medium rose
    push();
    translate(width/2, height/2);
    angleMode(DEGREES);
    rotate(180+45);
    angleMode(RADIANS);
    roseCurve(50, 180, 0, 10,
              [131, 144, 115],
              map(mouseY, 0, height, .5, 2));
    pop();

    //Smallest, white rose
    push();
    translate(width/2, height/2);
    angleMode(DEGREES);
    rotate(180-45);
    angleMode(RADIANS);
    roseCurve(0, 140, 0, 10,
              [255, 255, 255, 150],
              map(mouseY, 0, height, .1, .8));
    pop();

}

//Draws a rose curve where a and b values are determined by mouse position
function roseCurve(amin, amax, bmin, bmax, col, thickness) {
    var x;
    var y;
    var r;

    //Determines size of petals
    var a = map(mouseY, 0, height, amin, amax);
    //Determines number of petals
    var b = map(constrain(mouseX, 0, width), 0, width, bmin, bmax);

    noFill();
    stroke(col);
    strokeWeight(thickness);
    beginShape();
    for (var i = 0; i < nPoints; i++) {
        var t = map(i, 0, nPoints, 0, TWO_PI);

        r = a*sin(b*t);

        x = r * cos(t);
        y = r * sin(t);
        vertex(x, y);
    }
    endShape();
}

//Draws an ellipse that rotates around center according to mouse position
function orbiter(angleMin, angleMax, y, size) {
    push();
    translate(width/2, height/2);
    angleMode(DEGREES);
    rotate(map(mouseX, 0, width, angleMin, angleMax));
    noStroke();
    fill(110, 99, 98);
    ellipse(0, y, size);
    angleMode(RADIANS);
    pop();
}
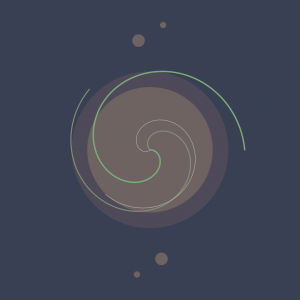
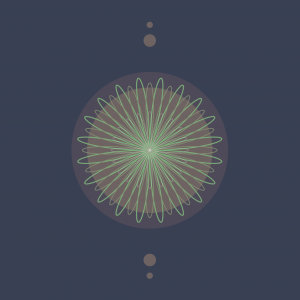
I had forgotten how much I liked math and playing around with graphs, so I really enjoyed the time I spent with this project. Before I started my code, I explored and experimented a lot with Desmos, an online graphing calculator, and manipulated different variables of each equation to see what kind of movement I could get.
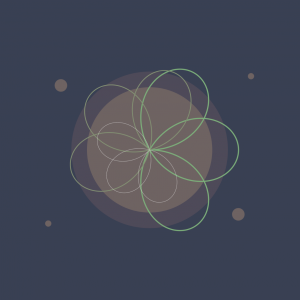
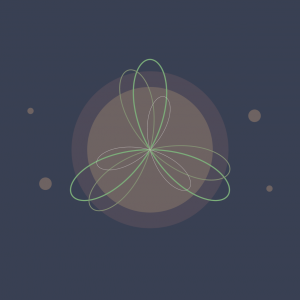
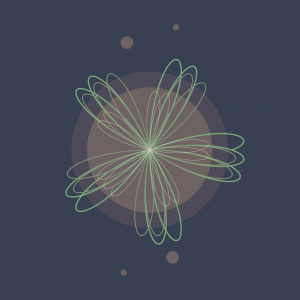
I ultimately went with the rose curve, a polar graph that’s visually interesting in not only its form, but in the way that the curve is drawn and generated. The main variables in the curve determine both the rose’s size and the amount of petals on it, so I decided to map both those variables to the mouse’s position and see what came out of it.
I’m definitely pleased with the final result, although I had initially wanted to make the orbitals travel in a sine wave around the circle, but it began to take a toll on the program’s ability to run smoothly, and ultimately settled on having it rotate without depending on a formula.