I started this project by simply creating basic curves. I started with the astroid curve.

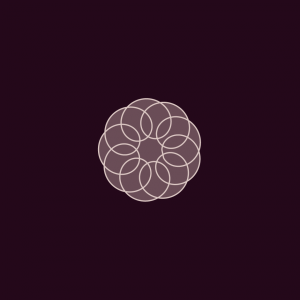
However, I wasn’t inspired by this simple curve so I decided to explore some other curves. I came across the epitrochoid curve.

I decided to add a simple interaction, increasing the general radius as well as the loop sizes as the mouse moves from side to side. Then I added the astroid curve back on top as a little embellishment.
function setup() {
    createCanvas(480, 480);
}

function draw() {
    background(36, 7, 26);
    translate(width/2, height/2); //moves curves from (0,0) center to center of canvas
    epitrochoid(); //draws epitrochoid curve
    astroid(); //draws radial astroid curve

}

function epitrochoid() {
    var b = 5;
    var h = (b * 4) + mouseX/4; //change as mouse moves from side to side
    var a = 30 + mouseX/3;

    fill(107, 77, 87);
    strokeWeight(2);
    stroke(221, 200, 196);
    beginShape();
    for(var t = 0; t < 2 * PI; t += PI/500){ //1000 points along circle
        var x = (a + b) * cos(t) - h * cos(((a + b)/b) * t); //x coordinate
        var y = (a + b) * sin(t) - h * sin(((a + b)/b) * t); //y coordinate
        vertex(x, y);
    }
    endShape(CLOSE);
}

function astroid() {
    var a = 25 + mouseX/2; //changes as mouse moves from side to side

    noFill();
    strokeWeight(10);
    stroke(107, 77, 87);
    beginShape();
    for(var t = 0; t < 2 * PI; t += PI/500){ //1000 points along circle
        var x = a * pow(cos(t), 3); //x coordinate
        var y = a * pow(sin(t), 3); //y coordinate
        vertex(x, y);
    }
    endShape(CLOSE);
}![[OLD FALL 2017] 15-104 • Introduction to Computing for Creative Practice](https://courses.ideate.cmu.edu/15-104/f2017/wp-content/uploads/2020/08/stop-banner.png)