function setup() {
    createCanvas(480, 480);
}

function draw() {
    //mapping for colors lines and background
    var r = map(mouseX, 0, width, 0, 200);
    var g = map(mouseY, 0, height, 0, 255);
    var b = map(mouseX, 0, width, 0, 155);
    background(209, g, 100);
    stroke(r, 150, b);
    strokeWeight(3);

    //moving to middle of the canvas
    translate(width / 2, height / 2);
    noFill();
    drawHypotrochoid();
}

function drawHypotrochoid(){
    //variables to be used in the equation
    var x;
    var y;
    var h = width/2;
    var a = map(mouseX, 0, width, 0, PI);
    var b = map(mouseY, 0, height, 0, 1);

    //HYPOTROCHOID EQUATION
    // x = (a-b)*cos(angle) + h*cos(((a-b)/b) angle)
    // y = (a-b)*sin(angle) - h*sin(((a-b)/b) angle)

    beginShape();
        for(var i = 0; i < width; i+= 5){
            var angle = map(i, 0, width, 0, 360);
            x = (a - b) * cos(angle) + h * cos(((a-b)/b)*angle);
            y = (a - b) * sin(angle) - h * sin(((a-b)/b)*angle);
            vertex(x,y);
        }
    endShape();
}
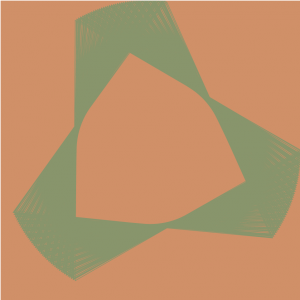
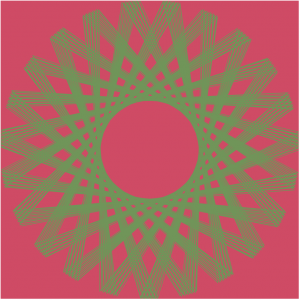
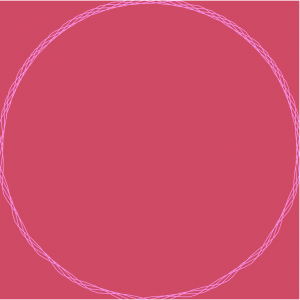
In order to fully understand the curves process, I tried to keep this project as simple as possible. This meant choosing a basic equation to start off with, which is how I ended up choosing the hypotrochoid curve. It took a little while to get used to how the rather long equation to generate the lines would semantically be converted into p5js; I had to add more multiplication stars than I had originally anticipated and had a lot of trouble trying to figure out that because when it wasn’t correct, nothing would render. I was able to play around with the numbers as well as colors by keeping this part of the project relatively simple. However, I am still mesmerized by the dancing lines from such a short amount of code.
Screenshots:


![[OLD FALL 2017] 15-104 • Introduction to Computing for Creative Practice](https://courses.ideate.cmu.edu/15-104/f2017/wp-content/uploads/2020/08/stop-banner.png)