![[OLD FALL 2017] 15-104 • Introduction to Computing for Creative Practice](https://courses.ideate.cmu.edu/15-104/f2017/wp-content/uploads/2020/08/stop-banner.png)
//NaHyunKim
//section B
//nahyunk1@andrew.cmu.edu
//Project 07

var numObjects = 500;
var r = 255;
var g = 255;
var b = 255;

function setup() {
createCanvas(380, 380);
ellipseMode(CENTER);
}

function draw() {
var centerX = width/2;
var centerY = height/2;
background(0);
translate(centerX, centerY);
//draw Epicycloid
drawEpi(); //

function drawEpi() {
  noFill();
  stroke(random(0,r), random(0,g), random(0,b)); // stroke is all random colors

  beginShape();
  var x;
  var y;
  var a = mouseY/3; //the increase and the decrease of lines/curves.
  var b = -mouseX/40;//the increase and the decrease of lines/curves.
  for (var i=0; i < numObjects; i++){
    var t = map(i, 0, numObjects, 0, TWO_PI);
    var x = ((a+b)*cos(t) - b*cos(((a+b)/b*t))); // x eq. for the epicycloid
    var y = ((a+b)*sin(t) - b*sin(((a+b)/b*t))); // y eq. for the epicycloid
    vertex(x,y); // starts at the vertex.
  }
  endShape();
}
  beginShape();
  var x;
  var y;
  var a = mouseY/3;//the increase and the decrease of lines/curves.
  var b = mouseX/40;//the increase and the decrease of lines/curves.
  stroke(random(0,g), random(0,r), random(0,b)); //switch up the variables so that each epi. has different types of randomness.
  for (var i=0; i < numObjects; i++){
    var t = map(i, 0, numObjects, 0, TWO_PI);
    var x = ((a+b)*cos(t) - b*cos(((a+b)/b*t))); // x eq. for the epicycloid
    var y = ((a+b)*sin(t) - b*sin(((a+b)/b*t)));// y eq. for the epicycloid
    vertex(x,y);
  }
  endShape();
  beginShape();
  var x;
  var y;
  var a = mouseY/3;//the increase and the decrease of lines/curves.
  var b = mouseX/40;//the increase and the decrease of lines/curves.
  stroke(random(0,b), random(0,g), random(0,r));//switch up the variables so that each epi. has different types of randomness.
  for (var i=0; i < numObjects; i++){
    var t = map(i, 0, numObjects, 0, TWO_PI);
    var x = ((a+b)*cos(t*2) - b*cos(((a+b)/b*t))); // x eq. for the epicycloid
    var y = ((a+b)*sin(t*2) - b*sin(((a+b)/b*t)));// y eq. for the epicycloid
    vertex(x,y);
  }
  endShape();
  beginShape();
  var x;
  var y;
  var a = mouseY/3;//the increase and the decrease of lines/curves.
  var b = mouseX/40;//the increase and the decrease of lines/curves.
  stroke(random(0,b), random(0,g), random(0,r));//switch up the variables so that each epi. has different types of randomness.
  for (var i=0; i < numObjects; i++){
    var t = map(i, 0, numObjects, 0, TWO_PI);
    var x = ((a+b)*cos(t/2) - b*cos(((a+b)/(b/2)*t))); // x eq. for the epicycloid
    var y = ((a+b)*sin(t/2) - b*sin(((a+b)/(b/2)*t)));// y eq. for the epicycloid
    vertex(x,y);
  }
  endShape();
}
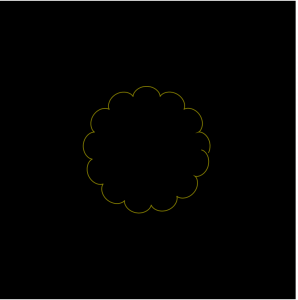
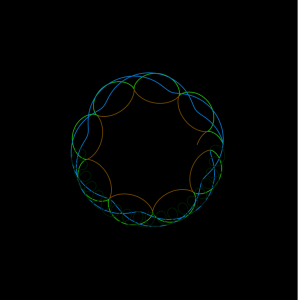
I first played around with the epicycloid itself to see how it gets formed as I move around the mouse. Then, I tried adding more layers of the same epicycloid and change around the equation to see changes occur in the image. I worked with division and multiplication of the variable ‘t’ in order to create shapes that differ from the original epicycloid made with the initial equation. Here are the screenshots of the initial, single epicycloid and my progressional adaptation of the shape through adding the altered versions of the original.