![[OLD FALL 2017] 15-104 • Introduction to Computing for Creative Practice](https://courses.ideate.cmu.edu/15-104/f2017/wp-content/uploads/2020/08/stop-banner.png)
Shipmap.org
by Kiln
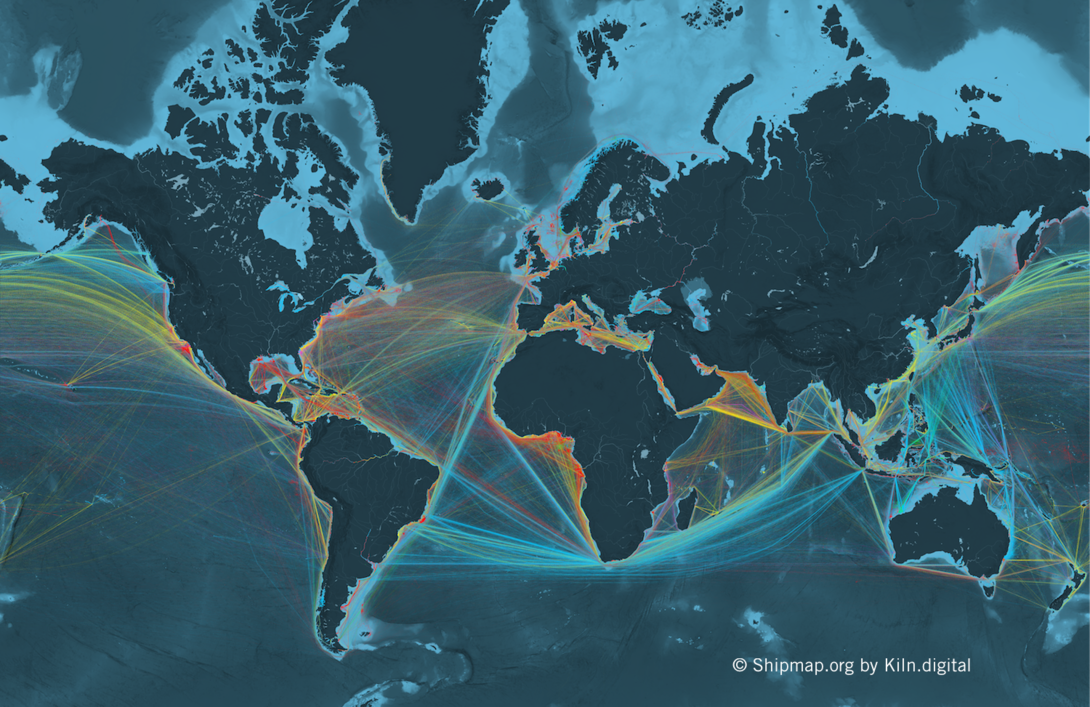
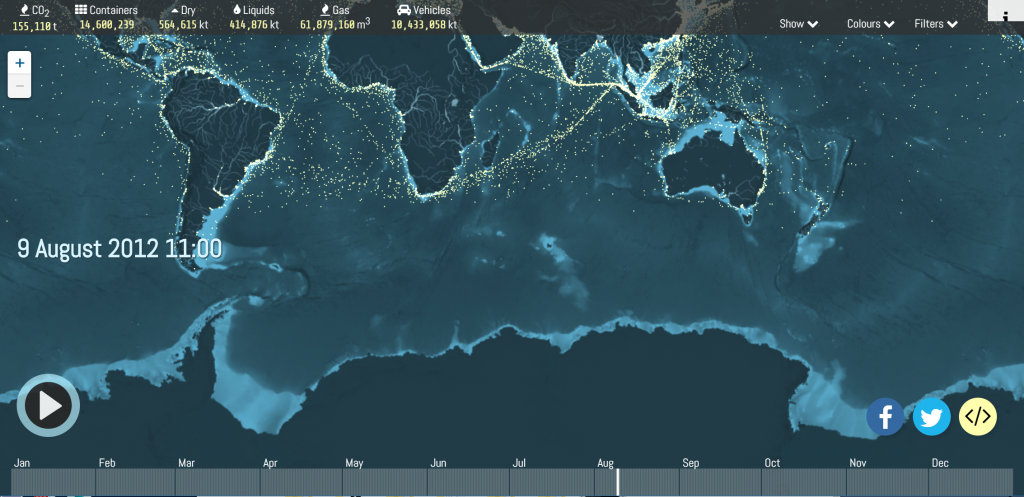
Shipmap.org shows commercial shipping movements based on hundreds of millions of data points from throughout 2012. It was created by created by Kiln based on data from the UCL Energy Institute (UCL EI). UCL EI took data showing location and speed of ships and cross-checked it with another database to get the vessel characteristics. With this information, they were able to compute the CO2 emissions for each observed hour, following the approach laid out in the Third IMO Greenhouse Gas Study 2014. The designer took the resulting dataset and visualized it with WebGL on top of a specially created base map. The most impressive thing about this website is that it shows a high level of interaction with datas — such as you can select different time, ship categories and zoom in or out — and at the same time the map maintains the elegant visual appearance by using simple colors and movements.
For more information, please go to https://www.shipmap.org/