danakim-FinalProject

sketch

//Dana Kim
//danakim@andrew.cmu.edu
//Section D
// Final Project

var AxonImage;
var Axonometric = "https://i.imgur.com/doaZlfr.jpg"

var DiagramSetAImage;
var DiagramSetA = "https://i.imgur.com/EVVcKCe.jpg"

var DiagramSetBImage;
var DiagramSetB = "https://i.imgur.com/qKSqajN.jpg"

var RenderingImage;
var Rendering = "https://i.imgur.com/A4ayosV.jpg"

var SPImage;
var SectionalPerspective = "https://i.imgur.com/Xpo6ExI.jpg"

function preload(){
  AxonImage = loadImage(Axonometric);

  DiagramSetAImage = loadImage(DiagramSetA);

  DiagramSetBImage = loadImage(DiagramSetB);

  RenderingImage = loadImage(Rendering);

  SPImage = loadImage(SectionalPerspective);
}

function setup() {
  createCanvas(480, 480);
  image(AxonImage, 0 ,0); //Initial image is Axonometric
}

function draw(){
  //Menu Buttons
  fill(255);
  strokeWeight(0.5);
  rect(10, 50, 205, 20, 20);
  rect(10, 80, 160, 20, 20);
  rect(10, 110, 115, 20, 20);
  rect(10, 140, 70, 20, 20);

  //Menu Buttons Text
  fill(150);
  textSize(10);
  text("Multi-Use Room Transformation Diagrams", 20, 63);
  text("Lobby Transformation Diagrams", 20, 93);
  text("Sectional Perspective", 20, 123);
  text("Rendering", 20, 153);

}

function mousePressed(){
  //Multi-Use Room Transformation Diagrams Page
  if(10 < mouseX & mouseX < 215 && 50 < mouseY && mouseY < 70){
    image(DiagramSetAImage, 0, 0);
    fill(0)
    rect(10, 19, 53, 15, 20);
    fill(255);
    textSize(10);
    text("H O M E", 16, 30);
    fill(0);
    text("Multi-Use Room Transformation Diagrams", 15, height-10);
  }

  //Lobby Transformation Diagrams Page
  else if(10 < mouseX & mouseX < 170 && 80 < mouseY && mouseY < 100){
    image(DiagramSetBImage, 0, 0);
    fill(0)
    rect(10, 19, 53, 15, 20);
    fill(255);
    textSize(10);
    text("H O M E", 16, 30);
    fill(0);
    text("Lobby Transformation Diagrams", 15, height-10);
  }

  //Sectional Perspective Page
  else if(10 < mouseX & mouseX < 125 && 110 < mouseY && mouseY < 130){
    image(SPImage, 0, 0);
    fill(0)
    rect(10, 19, 53, 15, 20);
    fill(255);
    textSize(10);
    text("H O M E", 16, 30);
    fill(0);
    text("Sectional Perspective", 15, height-10);
  }

  //Rendering Page
  else if(10 < mouseX & mouseX < 80 && 140 < mouseY && mouseY < 160){
    image(RenderingImage, 0, 0);
    fill(0)
    rect(10, 19, 53, 15, 20);
    fill(255);
    textSize(10);
    text("H O M E", 16, 30);
    fill(0);
    text("Stair Rendering", 15, height-10);
  }

  // Home Page (Axonometric)
  else if(10 < mouseX & mouseX < 63 && 19 < mouseY && mouseY < 34){
    image(AxonImage, 0 , 0);
  }
}

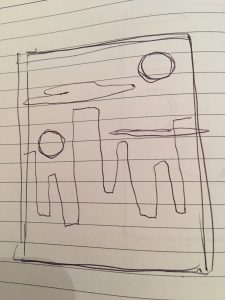
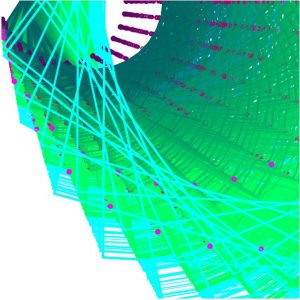
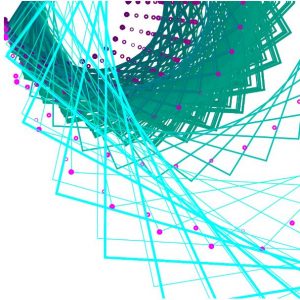
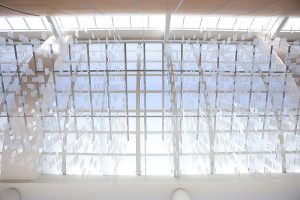
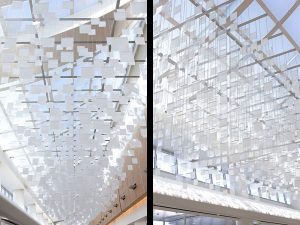
I wanted to create an interactive page for one of my past studio projects. I had originally intended to do an informative exploded axon but due to time constraints I was unable to do so. Although the project wasn’t what I had initially intended to do and is fairly simple, I’m still pretty satisfied with the way that it turned out.

danakim-LookingOutwards-12

For my final project I want to take one of my past studio projects and make an interactive, axonometric diagram. I wanted to add environmental analysis diagrams as well that would take the informative aspect of the diagrams a step further.

Monument Valley; Ustwo; 2014

Monument Valley is a mobile game that was created by digital design studio Ustwo. The puzzle game is an exploration through fantastical architecture and “impossible” geometry. Besides it overly-stunning visuals, it is praised for its use of optical illusions to create a stimulating gaming experience. It was created using Unity. I feel that it is a good reference and organizational method for how I would like users to navigate through my studio project.

Monument Valley; 2014


The PLUS1 Poly-nuclear Program is an interactive APP created by Sub-Labs for the 10th Shanghai Biennale mobile unit. The app is used to transform photos into 3D scenes using algorithms. These scenes that are created become interactive fantasy worlds. Users can create an infinite number of these worlds. The app collects data such as time, weather, and location to further transform these worlds. I want to apply the same process they applied for creating the 3D scenes to recreate my environmental analysis diagrams.

PLUS1;2015
PLUS1;2015
PLUS1;2015

PLUS1; Sub-Labs; 2015

danakim-LookingOutwards-11

“The Classyfier” is a table that chooses music to fit the situation happening around it based off of the beverages that the people at the table consume. It chooses a playlist by comparing the characteristic sounds to a catalogue of pre-trained examples. The three classes that the table can detect are hot beverages, wine, and beer. I thought this project was pretty interesting because it is sort of an intro to smart objects and machine learning.

This project was created by Benedict Hubener, Stephanie Lee and Kelvyn Marte at the CIID alongside Andreas Refsgaard and Gene Kogan. They used the OFX collection, Wekinator and Processing to bring the project together.

Huebener, Lee, Marte; The Classyfier; 2017

The Classyfier; 2017

danakim-Project-10

sketch

//Dana Kim
//danakim@andrew.cmu.edu
//Section D
//Project-10

var moons = [];
var Terrain = [];
var terrainSpeed = 0.0003;
var terrainDetail = 0.001;

function setup() {
  createCanvas(480, 480);

  //initial moons
  for(var i = 0; i < 5; i++){
    var rx = random(width);
    moons[i] = new Moons (rx);
  }
  frameRate(10);
}

function draw() {
  background(243, 178, 156);

  updateAndDisplayMoons();
  removeMoons();
  newMoons();
  citySkyLine();
  Smog();
}

function updateAndDisplayMoons(){
  for(var i = 0; i < moons.length; i++){
    moons[i].move();
    moons[i].display();
  }
}

function removeMoons(){
  for(var i = 0; i < moons.length; i++){
    if(moons[i].x < 0-moons[i].breadth){
      moons.splice(i, 1);
    }
  }
}

function newMoons(){
  var newMoonLikelihood = 0.007;
  colorList = [255, 150, 180];
  colorNum = int(random(0.5, 2.5));
  if(random(0,1) < newMoonLikelihood){
    moons.push(new Moons ( width, colorList[colorNum]));
  }
}

function Moons(birthLocationX, color){
  this.x = birthLocationX;
  this.y = random(50, 250);
  this.breadth = 50;
  this.speed = -1.0;
  this.move = function(){
    this.x += this.speed;
  }
  this.display = function(){
    push();
    fill(random(69, 126), 0, random(115, 213));
    ellipse(this.x, this.y, this.breadth, this.breadth);
    pop();
  }
}

function citySkyLine(){
  fill(189, 142, 138);
  beginShape();
  for( var x = 0; x < width; x++){
    var t = (x * 0.001) + (millis() / 0.0001);
    var y = map(noise(t), 0, 1, 0, height);
    vertex(x,y+100);
  }
  endShape();

}

function Smog(){
  fill(149, 121, 117);
  beginShape();
  for( var x = 0; x < width; x++){
    var t = (x * 0.0005) + (millis() * terrainSpeed);
    var y = map(noise(t), 0, 1, 0, height);
    vertex(x,y);
  }
  endShape();

}

This is an abstracted version of what I had intended on making initially. I was fooling around with the code and I happened to like what I got from that and stuck with it. It still conveys my initial idea of a city skyline with smog and multiple “moons.”

danakim-LookingOutwards-10

Geode is a series of geologically inspired puzzles created by Jessica Rosenkrantz from Nervous System. She used agates as inspiration for the puzzles. I found it particularly interesting how she mimicked the way agates are naturally formed in the algorithm that her computer generated agates emerge from. For each generated agate, colors were derived from photos that were taken by Jessica.

Jessica Rosenkrantz is the co-founder and creative director at Nervous System. She graduated from MIT with degrees in biology and architecture. She also studied at the Harvard Graduate School of Design. She focuses on generative design methods using both algorithmic and physical tools to create innovative products and environments. She pulls inspiration from the complex and unconventional geometries in natural forms.

Jessica Rosenkrantz; Geode; 2017

danakim-Project-09

sketch

//Dana Kim
//danakim@andrew.cmu.edu
//Section D
// Project-09

var Image;
var initials = []; //my friends and my initials

function preload() {
  var imageURL = "https://i.imgur.com/6U7x1D3.jpg"
  Image = loadImage(imageURL);
}

function setup(){
  createCanvas(270, 480);
  Image.loadPixels();
}

function draw(){
  var initials = ["DK", "MC", "WYL"];
  var InitialsIndex = 0;
  var px = random(width); //x-coordinate of text
  var py = random(height);// y-coordinate of text
  var qx = constrain(floor(px), 0, width);
  var qy = constrain(floor(py), 0, height);
  var colorAtXY = Image.get(qx, qy);
  var colorAtMouse = Image.get(mouseX, mouseY);

  for ( var i = 0; i < initials.length; i++){
    InitialsIndex = i;

    //draws text with image color at randomized x and y-coordinates
    textSize(random(10,20));
    strokeWeight(random(3,6));
    fill(colorAtXY);
    text(initials[InitialsIndex], px, py);

    //draws text with image color at mouse x and y-coordinates
    textSize(random(10,20));
    strokeWeight(random(3,6));
    fill(colorAtMouse);
    text(initials[InitialsIndex], mouseX, mouseY);
  }
}

I used a picture of my friends and I that I took last winter. I used my friends and my initials to draw the image. The locations and who’s initials were drawn were randomized.

danakim-LookingOutwards-09

Claire’s Looking Outward post on Flume’s “Skin” album cover caught my eye as I was scrolling through her page. In my opinion, Zawada did an excellent job in successfully representing this relationship between the music and the album cover art for “Skins”. The contrast between organic and synthetic is directly shown through Zawada’s use of soft and hard textures alongside the soft and vibrant colors that emphasize these textures. I agree with Claire when she says that Zawada’s use of mathematical programming to create organic objects is ironic. I feel that Zawada was able to show the potential and complexity of computer programming by recreating a natural object that looks so realistic.

“Skin”; Jonathan Zawada


“Skin”; Jonathan Zawada

Claire Koh’s Looking Outward 09

Behind Cover The Art Flume’s Grammy Winning Album


danakim-LookingOutwards-08

Mimi Onuoha is a Nigerian artist and researcher based in Brooklyn. She explores the implications of computational categorization and data collection. Her main mediums are code, writing, and sculptures. Through these mediums she explores missing data and the ways that people are classified, abstracted, and represented through data collection. Onuoha is currently a research resident at Eyebeam, an Artist in Residence at StudioXX, and a data journalism contributor at Quartz. She graduated from NYU’s Interactive Telecommunications Program in 2013 with an MPS, Master of Professional Studies.

Onuoha focuses on the link between data collection and human relationships and classifications. She shapes her work around daily life a lot and its very interesting how much you can actually learn from this data that she is collecting about individuals. One of her pieces, Pathways, literally tracks the path of groups of people. She uses mobiles to collect data from each group. The use of a mobile phone to collect data is interesting because it opens up the variety of data that she can collect. She used different apps to track which messaging apps the groups used, where they were travelling, as well as how often the group interacted with one another.

Pathways; Mimi Onouha
Pathways; Mimi Onuoha

Onuoha spoke at the Eyeo Festival on June 27, 2017. She starts off the presentation by introducing the core idea of her work, which is data collection, and then proceeded to talk about influences and how that affected the way that she approached her projects. Onuoha introduces a piece of hers that she uses as an example of how she manifests her ideas into her piece and how what she learned from this particular project led to an idea for another project. She presents her work like it is a story. It helps to make the flow much smoother.

Mimi Onuoha

danakim-Project-07

sketch

//Dana Kim
//danakim@andrew.cmu.edu
//Section D
//Project-07

var nPoints = 30;

function setup() {
  createCanvas(480, 480);
}

function drawCurve() {
  var cx = constrain(mouseX, 100, 400);
  var cy = constrain(mouseY, 100, 400);

  noFill();
  beginShape();
  for(var i = 0; i < nPoints; i++){
    strokeWeight(random(.5,3.5));
    var t = (i/1.5)*500; //determines the angle of the vertexes
    var a = (cx/.5); //determines the scale of curve
    var px = (1/cos(t)+(a*cos(t)))*cos(t);
    var py = (1/cos(t)+(a*cos(t)))*sin(t);
    stroke(cx, 0, cy);
    ellipse(px, py, 5, 5); //creates ellipses along points of curve
    stroke(0, cx, cy);
    vertex(px*1.5, py*1.5); //creates curves
  }
  endShape(CLOSE);
}

function draw() {
  drawCurve();
}

I used the Conchoid of de Sluze roulette curve for this project. I made two different, yet connected, objects within the drawing with this curve. One of the set of curves was written to be made of ellipses that are placed on points along the curve. The second set just draws the curves as they are. The scale and colors were set to change as the mouseX and mouseY changes.

danakim-LookingOutwards-07

eCLOUD (2007); Dan Goods

The eCLOUD is a permanent installation between gates 22 and 23 at the San Jose International Airport. It is a dynamic sculpture that mimics the volume and behavior of a cloud. The sculpture is made of polycarbonate tiles that change its transparency levels according to real time weather from around the world. A dynamic display shows which city the eCLOUD is displaying and it’s current weather data in real time.The eCLOUD was designed by Dan Goods, Nik Hafermaas and Aaron Koblin.

I admire the project’s sensitivity to it’s environment. The designers did a nice job of finding the right balance between simplicity and complexity to make sure that the installation relates back to its surrounding environment and is not obnoxious. I admire that the installation itself is informative and has a function within the space.

eCLOUD; Dan Goods
eCLOUD; Dan Goods

eCLOUD