Sheenu-Project 04-String Art

sketch

//Sheenu You
//Section E
//Project-04
//sheenuy@andrew.cmu.edu
function setup() {
    createCanvas(400, 300);
    strokeWeight(2);
}

function draw() {
	background(0);
	for (var i = 20; i <400; i+= 20) {
		stroke("yellow");
		line(0,i,i*mouseX/5,400);
		line(400,i,i*mouseX/5,0);
	}
	for (var b = 10; b<600; b+=5){
		strokeWeight(1);
		stroke("red");
		line(0+b,0,0+b,300);
	}
for (var a = 20; a <400; a+= 10) {
		stroke("blue");
		line(0,a,a,400);
		line(400,a,a,0);
	}
}

This is a very simple line art I made using the for function. The for function is something I still don’t understand very well. I see many possibilities in this function but learning this is a bit of a challenge that needs extra time. Other than that, I really enjoyed how my project turned out in the end. The MouseX really makes this thing come to life.

hschung-Project-04

sketch

// Heidi Chung
// Section A
// hschung@andrew.cmu.edu
// Project-04

function setup() {
    createCanvas(400, 300);
}

function draw() {
    background(200, 90, 90);
     for (var i = -5; i < 350; i += 10) {

    var x1 = 0;
    var y1 = i * height/500;
    var x2 = i * height/300;
    var y2 = height;

      push();
      stroke(235, 130, 130); // peach lines that touch bottom of canvas
      strokeWeight(9);
      line(i*2 + 20, 500, 1.5*i, 120);
      pop();

      push();
      stroke(245, 185, 140); //thin short peach lines
      strokeWeight(3);
      line(1.5*i, 120, 1.2*i, 240);
      pop();

      push();
      stroke(111, 178, 173); //short blue lines
      strokeWeight(4);
      line(i*2 + 20, 240, 1.5*i, 120);
      pop();


      stroke(235, 130, 130);//left bottom corner pink underlay grid
      strokeWeight(3);
      line(x1, y1 +100, x2, y2);

      stroke(255); //white overlay grid
      strokeWeight(.5);
      line(x1, y1 +100, x2, y2);

      stroke(235, 130, 130); //top right pink overlay grid
      strokeWeight(.5);
      line(y2-width/2, x1, y1 +400, x2);

      stroke(235, 130, 130);//top left pink grid
      strokeWeight(1);
      line(y2, y2-width, x1, y1);

      stroke(239, 84, 84);//grid top left reddish pink
      strokeWeight(2);
      line(y2 + 100, y2-width, x1 + 100, y1);

      stroke(141, 219, 213); //light blue grid
      strokeWeight(1);
      line(y2 * i, x1, y1, x2);


    }

}

I didn’t have a clear image of what I wanted to make when I started this, except for the color palette surrounding peachy pinks. It took me a long time to conceptually understand how to use the for loop to make the lines appear in a curved grid. But I had some helpful explanations from my friends and that helped ground me a lot. I think I’ll need to keep practicing using for loops a lot.

adev_Project 04_String Art

adev_Project04

var spacing = 1; 
var x1 = 0; 
var y1 = 100; 
var x2 = 200; 
var y2 = 0; 
var rectWidth = 10;
var sw;

function setup(){
    createCanvas(400, 300);

    noFill();
	stroke (255);
	strokeWeight (0.5);

   }

function draw() {
     background(232, 221, 199);

    spacing = map(mouseX, 0, 400, 3, 20);
    sw = map(mouseX, 0, 400, 0.3, 0.7);


	for(var i = 0; i < width; i += 1) {
		strokeWeight(sw);
		stroke(255); 
		line(x2, spacing * i, spacing * i , y2);
		line(x1, spacing * i, spacing * i , y1);
		

		strokeWeight(sw*2);
		stroke(255); 
		line(x2/2, spacing * i+2, spacing * i+2, y2/2);
		line(x1*2, spacing * i+2, spacing * i+2 , y1*2);


		strokeWeight(sw*2.7);
		stroke(255); 
		line(x2*2, spacing * i+2, spacing * i+2, y2*2);
		line(x1/2, spacing * i+2, spacing * i+2 , y1/2);

        strokeWeight(sw*3.2);
		line(x1/3, spacing * i+2, spacing * i+2 , y1*3);	
		
	}
}

I really liked playing with the layered quality of the “strings”. Instead of using colour, I used varying stroke weights to highlight that. The strings also really reminded me of fishnet, and I made a fish-like abstracted shape out of the curved lines.

amui1-Project-04-String-Art

amui1-p4

//Allison Mui
//15-104 Section A
//amui1@andrew.cmu.edu
//Project-04

//variables for main triangle
var trgStep = 5;
//variables for eye
var eyeStep = 2;
//variables for mini triangle
var trgStepmin = 3;
//variables for left wing
var winStep = 4;

function setup() {
    createCanvas(400,300);
}

function draw() {
    background(0);

    //maintriangle
    stroke(255);
    strokeWeight(2);
    //leftside
    for (var midX = 150; midX <= 166; midX += trgStep) {
      line(60,230,midX,50);
    }
    //rightside
    for (var midX = 150; midX <= 166; midX += trgStep) {
      line(midX,50,270,230);
    }
    //base
    strokeWeight(1);
    var baseXa = 60;
    var baseYa = 235;
    var baseXb = 270;
    var baseYb = 235;
    for (var i = 0; i < 3; i++) {
      line(baseXa,baseYa,baseXb,baseYb);
      baseXa += 3;
      baseYa -= 3;
      baseXb -= 3;
      baseYb -= 3;
    }

    //eye
    //outereye

    stroke(255,255,0);
    strokeWeight(1);

    //vertical lines

    //part left up
    var eyeXa = 120;
    var eyeYa = 190;
    var eyeXb = 120;
    var eyeYb = 155;
    for (var i = 0; i < 16; i++){
      line(eyeXa,eyeYa,eyeXb,eyeYb);
      eyeXa += 3;
      eyeYa -= 2;
      eyeXb += 5;
    }
    //part right up
    var eyeXa = 200;
    var eyeYa = 190;
    var eyeXb = 200;
    var eyeYb = 155;
    for (var i = 0; i < 16; i++){
      line(eyeXa,eyeYa,eyeXb,eyeYb);
      eyeXa -= 3;
      eyeYa -= 2;
      eyeXb -= 5;
    }
    //part left down
    var eyeXa = 120;
    var eyeYa = 190;
    var eyeXb = 120;
    var eyeYb = 220;
    for (var i = 0; i < 16; i++){
      line(eyeXa,eyeYa,eyeXb,eyeYb);
      eyeXa += 3;
      eyeYa += 2;
      eyeXb += 5;
    }
    //part right down
    var eyeXa = 200;
    var eyeYa = 190;
    var eyeXb = 200;
    var eyeYb = 220;
    for (var i = 0; i < 16; i++){
      line(eyeXa,eyeYa,eyeXb,eyeYb);
      eyeXa -= 3;
      eyeYa += 2;
      eyeXb -= 5;
    }

    //eyeball
    var eyeXa = 155
    var eyeYa = 190
    var eyeXb = 160
    var eyeYb = 185
    stroke(255);
    for (var i = 0; i < 5; i++) {
      line(eyeXa,eyeYa,eyeXb,eyeYb)
      eyeXa += eyeStep
      eyeXb += eyeStep
    }
    var eyeXa = 160
    var eyeYa = 190
    var eyeXb = 155
    var eyeYb = 185
    stroke(255);
    for (var i = 0; i < 5; i++) {
      line(eyeXa,eyeYa,eyeXb,eyeYb)
      eyeXa += eyeStep
      eyeXb += eyeStep
    }
    var eyeXa = 160
    var eyeYa = 190
    var eyeXb = 155
    var eyeYb = 195
    stroke(255);
    for (var i = 0; i < 5; i++) {
      line(eyeXa,eyeYa,eyeXb,eyeYb)
      eyeXa += eyeStep
      eyeXb += eyeStep
    }
    var eyeXa = 155
    var eyeYa = 190
    var eyeXb = 160
    var eyeYb = 195
    stroke(255);
    for (var i = 0; i < 5; i++) {
      line(eyeXa,eyeYa,eyeXb,eyeYb)
      eyeXa += eyeStep
      eyeXb += eyeStep
    }

    //inner box

    //horizontal leg
    stroke(255);
    strokeWeight(1);
    miniXa = 120;
    miniYa = 148;
    miniXb = 200;
    miniYb = 148;
    for (var i = 0; i < 3; i++){
      line(miniXa,miniYa,miniXb,miniYb);
      miniXa -= 1;
      miniYa += 2;
      miniXb += 1;
      miniYb += 2;
    }
    //left vertical leg
    miniXa = 115;
    miniYa = 150;
    miniXb = 115;
    miniYb = 220;
    for (var i = 0; i < 3; i++){
      line(miniXa,miniYa,miniXb,miniYb);
      miniXa -= 2;
      miniYa += 5;
      miniXb -= 2;
      miniYb -= 1;
    }
    //right vertical leg
    miniXa = 205;
    miniYa = 150;
    miniXb = 205;
    miniYb = 220;
    for (var i = 0; i < 3; i++){
      line(miniXa,miniYa,miniXb,miniYb);
      miniXa += 2;
      miniYa += 5;
      miniXb += 2;
      miniYb -= 1;
    }

    //rainbow design
    //left side lines
    for (var leftWinX = -20; leftWinX <= 15; leftWinX += winStep){
      line(leftWinX,165,150,108);
    }
    //horizontal
    horizWinX = 180;
    horizWinY = 80
    for (var i = 0; i < 11; i++){
      line(150,108,horizWinX,horizWinY);
      horizWinX += 3;
      horizWinY += 5;
    }
    //actual rainbow
    //red rainbow lines
    stroke(255,0,0);
    rainXa = 180;
    rainYa = 80;
    rainXb = 400;
    rainYb = 75;
    for (var i = 0; i <8; i++){
      line(rainXa,rainYa,rainXb,rainYb);
      rainYb += 2;
    }
    //orange
    stroke(255,140,0);
    rainXa = 183;
    rainYa = 85;
    rainXb = 400;
    rainYb = 90;
    for (var i = 0; i <8; i++){
      line(rainXa,rainYa,rainXb,rainYb);
      rainYb += 2;
    }
    //yellow
    stroke(255,255,0);
    rainXa = 186;
    rainYa = 90;
    rainXb = 400;
    rainYb = 106;
    for (var i = 0; i <8; i++){
      line(rainXa,rainYa,rainXb,rainYb);
      rainYb += 2;
    }
    //darkgreen
    stroke(0,128,0);
    rainXa = 189;
    rainYa = 95;
    rainXb = 400;
    rainYb = 122;
    for (var i = 0; i <8; i++){
      line(rainXa,rainYa,rainXb,rainYb);
      rainYb += 2;
    }
    //lightgreen
    stroke(124,252,0);
    rainXa = 192;
    rainYa = 100;
    rainXb = 400;
    rainYb = 138;
    for (var i = 0; i <8; i++){
      line(rainXa,rainYa,rainXb,rainYb);
      rainYb += 2;
    }
    //darkblue
    stroke(0,0,255);
    rainXa = 195;
    rainYa = 105;
    rainXb = 400;
    rainYb = 154;
    for (var i = 0; i <8; i++){
      line(rainXa,rainYa,rainXb,rainYb);
      rainYb += 2;
    }
    //lightblue
    stroke(0,191,255);
    rainXa = 198;
    rainYa = 110;
    rainXb = 400;
    rainYb = 170;
    for (var i = 0; i <8; i++){
      line(rainXa,rainYa,rainXb,rainYb);
      rainYb += 2;
    }
    //darkpurple
    stroke(128,0,128);
    rainXa = 201;
    rainYa = 115;
    rainXb = 400;
    rainYb = 186;
    for (var i = 0; i <8; i++){
      line(rainXa,rainYa,rainXb,rainYb);
      rainYb += 2;
    }
    //lightpurple
    stroke(186,85,211);
    rainXa = 204;
    rainYa = 120;
    rainXb = 400;
    rainYb = 202;
    for (var i = 0; i <8; i++){
      line(rainXa,rainYa,rainXb,rainYb);
      rainYb += 2;
    }
    //pink
    stroke(255,192,203);
    rainXa = 207;
    rainYa = 125;
    rainXb = 400;
    rainYb = 218;
    for (var i = 0; i <8; i++){
      line(rainXa,rainYa,rainXb,rainYb);
      rainYb += 2;
    }
}

Conceptually, this project was pretty difficult to me.  I was inspired by Pink Floyd’s “Dark Side of the Moon”. It was difficult for me to figure out the points and the way in which the curve would change from loop to loop. I started off by sketching an idea, just like the 7th grade planning sheet. I manually calculated the first few lines in a for loop, and then I figured out a pattern. In the future, I would try to improve the middle section of the triangle to represent an eye better.

rsp1-Project04-StringArt-SectionB

sketch

/*Rachel Park
rsp1@andrew.cmu.edu
Section B @ 10:30AM
Project 04: String Art*/


function setup() {
    createCanvas(400,300);
}

function draw() {
  background(100);

  //defines limit to how many lines are drawn
  for (var i = 0; i < 600; i++) {

  //variables determine location of the lines
  var x1 = 0;
  var x2 = i*width/35;
  var y1 = i*height/60;
  var y2 = height;

  strokeWeight(0.5);  //setting thickness of the line

  //red
  stroke(255,0,0);
  line(x1, y1, x2+100, y2);

  //orange
  stroke(255,119,0);
  line(x2, 0, x1, height-y1);

  //yellow
  stroke(247,255,0);
  line(width, height-y1, x2, y2);

  //green
  stroke(3,156,64);
  line(x2, 0, width, y1);

  //purple
  stroke(147,0,192);
  line(width+200, height-200, x2-1000, height);

  //blue
  stroke(49,75,243);
  line(width/2,height/2, x2+width, y1);
  }
}

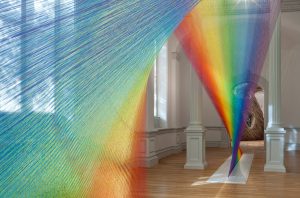
When the project called for a “string project” I immediately thought of the string art that stands in the Renwick Gallery location in Washington, D.C. I liked how the colors of the rainbow just bleed together seemlessly.

I tried to emulate that style within my project, but with little tweaks to the location of the lines themselves.

jknip-Project-04-string-art

sketch

/*Jessica Nip
Section A
jknip@andrew.cmu.edu
Project-04
*/

function setup() {
    createCanvas(400, 300);
}

function draw() {
    background(240);

    //set mouseX and mouseY as controles of color change
    var mouseR = mouseX;
    var mouseG = mouseY;
    var mouseB = 150;

    //set up for loop and increments
    for (var i = 0; i < 30; i+=1) {

    //set line characteristics
        stroke(mouseR-50, mouseG-50, mouseB); //define stroke RGB in relation to mouseR, mouseG, mouseB
        strokeWeight(1); //define weight to 1
        noFill(); //set fill to colorless

    //draw lines from left to right
        line(0 , i*10, mouseX+i*10, height);
        line(width/3+10*i, i*10, mouseX+i*10, height);
        line(width/3+4*i , height, width, height-(mouseX+15*i));
        line(width/2+10*i, 0, width, mouseX+i*10);
    }
}

I wanted to generate different curves from different sides of the canvas, and have colors randomize by a factor through the movement of the mouse. The result was an abstract line piece.

dnam-project-04

sketch

//Doo Won Nam
//Section B
//dnam@andrew.cmu.edu
//Project-04

function setup() {
    createCanvas(400, 400);
}

function draw() {
    var unoY = 200; //y for triangle
    var unoX = 20; // x for triangle
    var yin = 37; //y increase
    var xin = 30; //x increase
//setting variables and x and y to change throughout code
    var x1 = 10;
    var y1 = 400;
    var x2 = 400;
    var y2 = 10;
    background(300, 100, 100); //pink
//start loop
    for (var i=0; i <200; i++) {
    strokeWeight(1);
    stroke(191, 50, 80); //dark pink
    line(i, i*10, i*5, 2); //line that goes across canvas

    stroke(mouseX, mouseY, mouseX); //changes color along mouse movement
    line(x1, i * yin, i * mouseX - 50, y1); //mouseX - 50 for increase of size
  	line(x2, i * yin, i * xin, y2);
  	line(xin * i, y1, x2, height - (i * mouseX) - 50);//size increase,right top
  	line(x1, height - (i * yin), i * x1, y2);

    stroke(100, 100, 180);
    line(unoX + 350, unoY, i/2 + 200, 400); //triangle at bottom
    line(200, unoY, i - 200, 0); //triangle at left top
	}
}

I made some of the lines (including the triangle which is just made out of bunch of lines). I changed some of the y increase to mouse commands to add interactions to the project. With the project, I wanted to create something like a light show that would change colors as well.

abradbur-Project-04-String Art

stringart

function setup() {
    createCanvas(400, 300);
    strokeWeight(1);
}

function draw() {
    background(150, 53, 54);
    //black string
    for ( x = 0; x < 400; x += 20){
        stroke(84,1,3);
        line(x, 0, x * 1.5, 120);
        line(1.5 * x, 120, 1.2 * x, 300);
    }
    //light pink string
    for (y = 20; y < 300; y+= 50){
        noFill();
        stroke(254, 170, 171);
        bezier(0, y * 1.5 , 50, y, 20, y * .4, 400, y);
    }
    //strawberry string
    for (a = 0; a < 200; a += 10){
        noFill();
        stroke(210, 107, 108);
        bezier(0, a * 0.5, 30, a * 1.3, 300, a, 400, a *2);
        bezier(1.5 * a, 120, 1.2 * a, 300, 0, a, 40, 20);
        stroke(140, 123, 172);
        bezier(50 * a, 120, 1.2 * a, 300, 0, a, 40, 20);
        bezier(100 * a, 120, 1.2 * a, 300, 0, a, 40, 20);
    }
    //purple string
    for (b = 350; b < 400; b+= 20){
        bezier(300, 60, b, 40, 20, 10 * b, 120, 1.2 * b);
        bezier(30, 20, b, 40, 20, 10 * b, 120, 1.2 * b);
        bezier(60, 20, b, 40, 20, 10 * b, 120, 1.2 * b);
        bezier(100, 20, b, 40, 20, 10 * b, 120, 1.2 * b);
        bezier(170, 22, b, 40, 20, 10 * b, 120, 1.2 * b);
        bezier(250, 40, b, 40, 20, 10 * b, 120, 1.2 * b);
    }
}

With this project I had fun playing with bezier curves and seeing what resulted from different loops in the code. I didn’t exactly have a distinct form in mind, and I didn’t want to make one because I felt it would take away from my exploration of the piece.

Matthew Erlebacher Project-04 String Art

Line Art

// Matthew Erlebacher
// Section B
// merlebac@andrew.cmu.edu
// Project-04

function setup() {
    createCanvas(400, 300);
    background(0);

    var verticalY = height
    // Creates variable for verticle lines
    var horizontalX = width
    // Creates variable for horizontal lines
    var graphSpace = 25
    // Creates space for grid lines
    var SpaceX = 10
    // Creates spacing between

    for (var verticleX = 25; // Gives a variable for the x-coordinate of each line
        verticleX <= 375; // Makes the lines stop at the end of the canvas 
        verticleX += graphSpace /* Increases the x-coordinate of each line */) {
        stroke(255);
        line(verticleX, 0, verticleX, verticalY);
    } // Creates white verticle lines across the canvas

    for (var horizontalY = 25; // Gives a variable for the y-coordinate of each line
        horizontalY <= 275; // Makes the lines stop at the end of the canvas
        horizontalY += graphSpace /* Increases the y-coordinate each line */) {
        stroke(255);
        line(0, horizontalY, horizontalX, horizontalY)
    } // Creates white horizontal lines across the canvas

    for (var greenX = 0; // Creates a variable for the green lines
        greenX < width / 2; // Sets a limit on the green lines
        greenX += SpaceX /* Increases the variable greenX */) {
        stroke(0, 255, 0);
        line(greenX /* Varies the first point */, height / 2, width / 2,
            height / 2 - 10 - greenX /* Makes it so the second point increases and is always over the midpoint */);
    } // Creates pattern of green lines

    for (var redX = 0; // Creates a variable for red lines
        redX < width / 2; // Sets a limit on the red lines
        redX += SpaceX /* Increases the variable redX */) {
        stroke(255, 0, 0);
        line(redX /* Varies the first point */, height / 2, width / 2,
            height / 2 + 10 + redX /* Makes it so the second point increases and is always under the midpoint */);
    } // Creates pattern of red lines

    for (var grayX = 400; // Creates a variable for the gray lines
        grayX > width / 2; // Sets a limit on the gray lines
        grayX -= SpaceX /* Decreases the variable grayX */) {
        stroke(125);
        line(grayX /*Varies the first point */, height / 2, width / 2,
            height / 2 + 410 - grayX /* Makes it so the second point increases and is always under the midpoint */);
    }
    
    for (var blueX = 400; // Creates a variable for the blue lines
        blueX > width / 2; // Sets a limit on the blue lines
        blueX -= SpaceX /* Decreases the variable blueX */) {
        stroke(0, 0, 255);
        line(blueX /* Varies the first point */, height / 2, width / 2,
            height / 2 - 410 + blueX /* Makes it so the second point increases and is always over the midpoint */);
    }

}

When I started this assignment I had no idea what to do for this project. However, after I reviewed the lecture notes and looked at some examples on the internet I eventually figured out what I wanted to do. I decided to have the lines create a diamond formation since it seemed visually appealing. I also decided to include grid lines in the background since it made the lines pop more.

rgroves – String Art – Section B

sketch

//Rebecca Groves
//rgroves@andrew.cmu.edu
//Section B
//Project 4 String Art

//sky - position of the ellipses
var x;
var y;

//spacing of the mountains
var m1 = 30;
var m2 = 25;
var m3 = 5; 

//lake spacing
var l = 1;
var k = 1.02; //constant to increase spacing by

//foreground hillsspacing
var f1 = 2;
var f2 = 2.2; 
var a = 260; //top of the back hill
var b = 310; //top of the middle hill
var c = 380; //top of the front hill

function setup() {
    createCanvas(600, 400);
    background(200, 210, 200);
    //sky
    for (var i = 0; i < 5000; i++) {
    	noStroke();
        ellipse(x, y, random(80), random(80));
        x = random(width);
        y = random((2/3) * height);
        if (dist(x, y, 150, 100) < 85) { //make the sky brighter near the sun
        	fill(random(230, 255), random(235, 255), random(225, 240), 75);
        } else {
            fill(random(180, 240), random(180, 255), random(220, 255), 50);
        }
    }
    noLoop(); // turn off looping
    //sun
    fill(255, 245, 180);
    ellipse(150, 100, 20, 20);
}

function draw() {
	//first row of mountains
	for (var i = 0; i < 35; i++) {
		stroke(210, 190, 180);
		strokeWeight(.25);
		line(200, 125, -300 + (i * m1), height);
		line(300, 130, -250 + (i * m1), height);
		line(475, 100, -50 + (i * m1), height);
	}

	//second row of mountains
	for (var i = 0; i < 50; i++) {
		stroke(160, 146, 160);
		strokeWeight(.5);
		line(50, 130, -400 + (i * m2), height);
		line(550, 140, 50 + (i * m2), height);
		line(350, 150, -600 + (i * m2), height);
		line(350, 150, 400 + (i * m2), height);
	}

	//front row of mountains
	for (var i = 0; i < 100; i++) {
		stroke(171 - i , 176 - i, 206 - i); //lighter on the side facing the sun
		strokeWeight(1);
		line(120, 165, -150 + (i * m3), (2/3) * height);
		line(450, 140, 200 + (i * m3), (2/3) * height);
		//reflections in the water
		stroke(120, 125, 170, 70);
		line(120, (4/3) * height - 165, -150 + (i * m3), (2/3) * height);
		line(450, (4/3) * height - 140 , 200 + (i * m3), (2/3) * height);

	}

	//lake
	for (var i = 0; i < 500; i++) {
		stroke(0, 255, 255);
		strokeWeight(.25);
		line(0, (2/3) * height + l, width, (2/3) * height + l);
		l = k * l; //geometrically increase the distance between lines
	}

	//foreground
	for (var i = -50; i < 55; i++) {
		strokeWeight(1);
		stroke(179 - (2 * i), 177 - (2 * i), 75); //brighter on the side facing the sun
		var m = map(i, -50, 40, -1, .5);
		line(375 + ((i + 50) * f2), 280, 420 + ((i + 50) * f1), a);
		a = a + m; //since m goes from negative to positive, this allows the hill to 
		           //slope upward and then downward
	}
		
	for (var i = -80; i < 60; i++) {
		strokeWeight(1);
		stroke(179 - (2 * i), 177 - (2 * i), 75);
		var m = map(i, -80, 60, -1, .5);
		line(310 + ((i + 80) * f2), 330, 350 + ((i + 80) * f1), b);
		b = b + m;
	}

	for (var i = -150; i < 100; i++) {
		strokeWeight(1);
		stroke(179 - (4 * i), 177 - (4 * i), 75);
		var m = map(i, -150, 100, -1, .5);
		line(210 + ((i + 150) * f2), height, 250 + ((i + 150) * f1), c);
		c = c + m;
	}
}

I liked how creating images with lines instead of solid shapes allows for a lot more visual interest. Without even trying to you can wind up with gradients and cool patterns from overlapping lines.