![[OLD FALL 2017] 15-104 • Introduction to Computing for Creative Practice](https://courses.ideate.cmu.edu/15-104/f2017/wp-content/uploads/2020/08/stop-banner.png)
For this project, I intended to do some experimenting data visualization that focuses on environmental conservation. My goal was to visualize the data from NASA. Some possible data sets are Carbon Dioxide, Global Temperature, Arctic Sea Ice Minimum, Land Ice, and Sea Level. However, what I want to communicate is not as complicated as the “climate time machine” nor the fancy graphs. Instead, I want to take the advantage of p5js and do some animations’/graphics’ movements that represent these statistics in a much simpler way. The project is intended to make not only the scientists aware of global warming (which they have already done enough), but spread the awareness to all ages in all social classes. I intended to try my best ability to convert some of the changes to very appealing and easy-to-connect graphics. Below are two of my starting ideas.
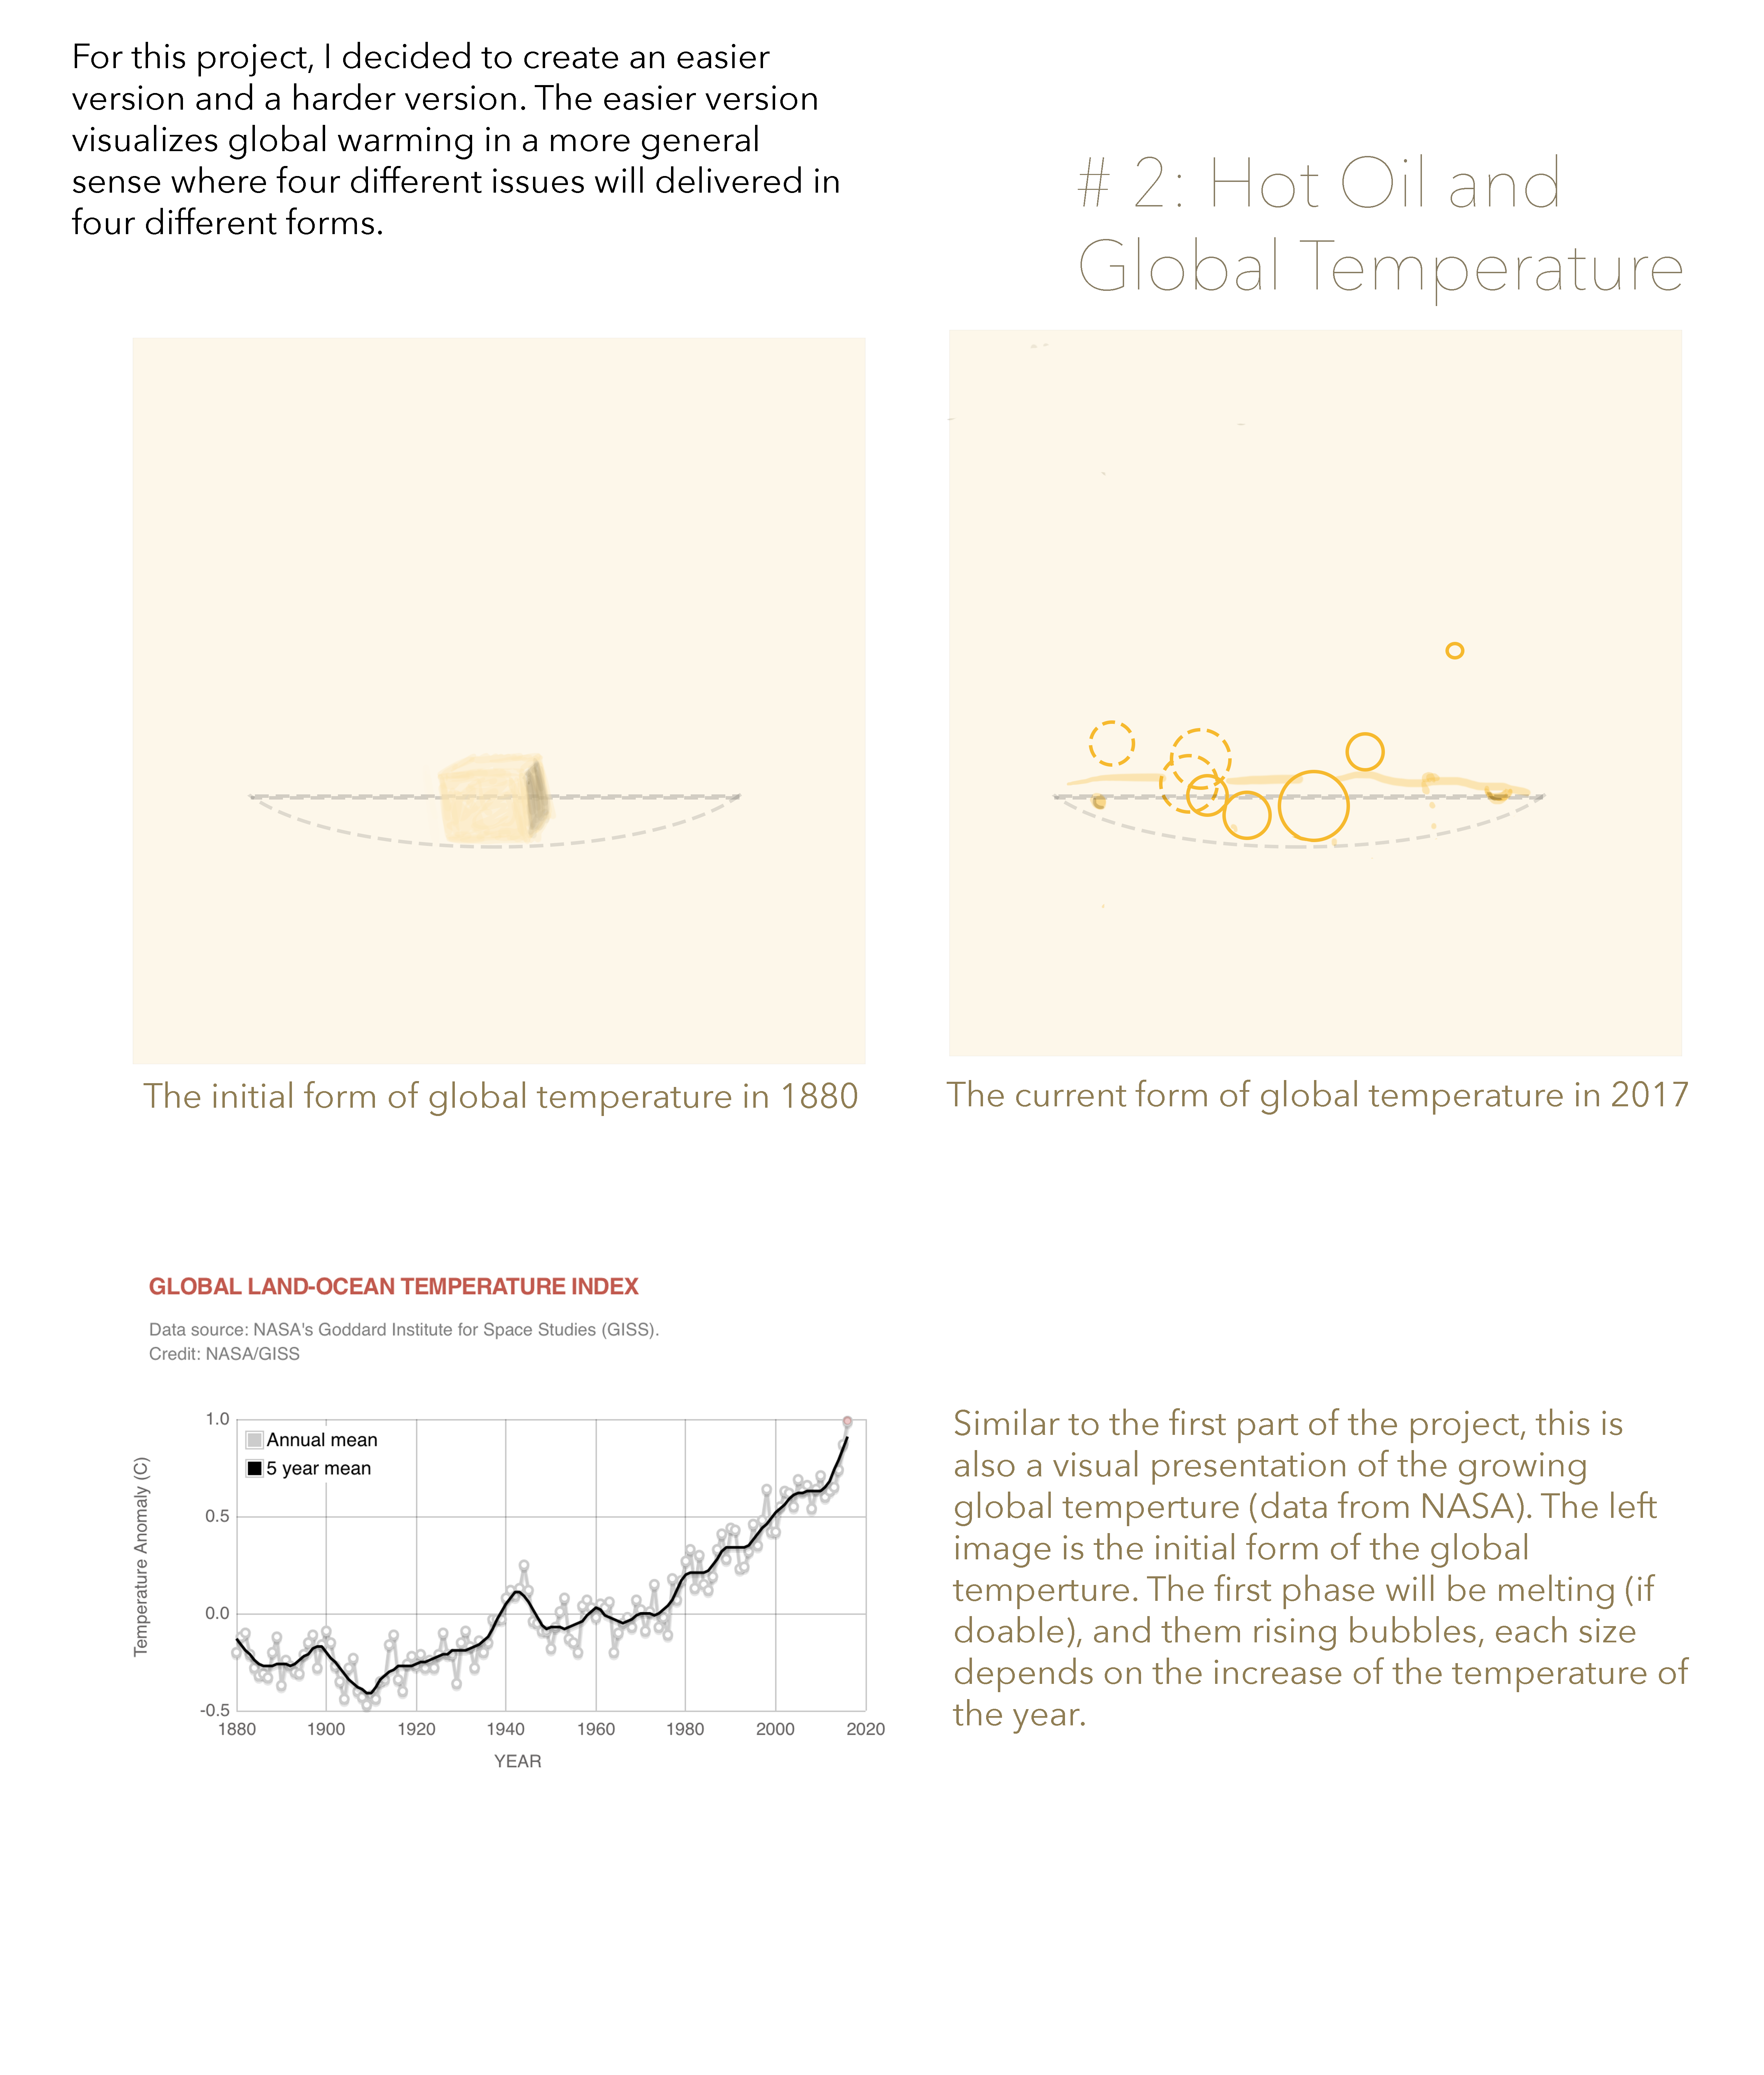
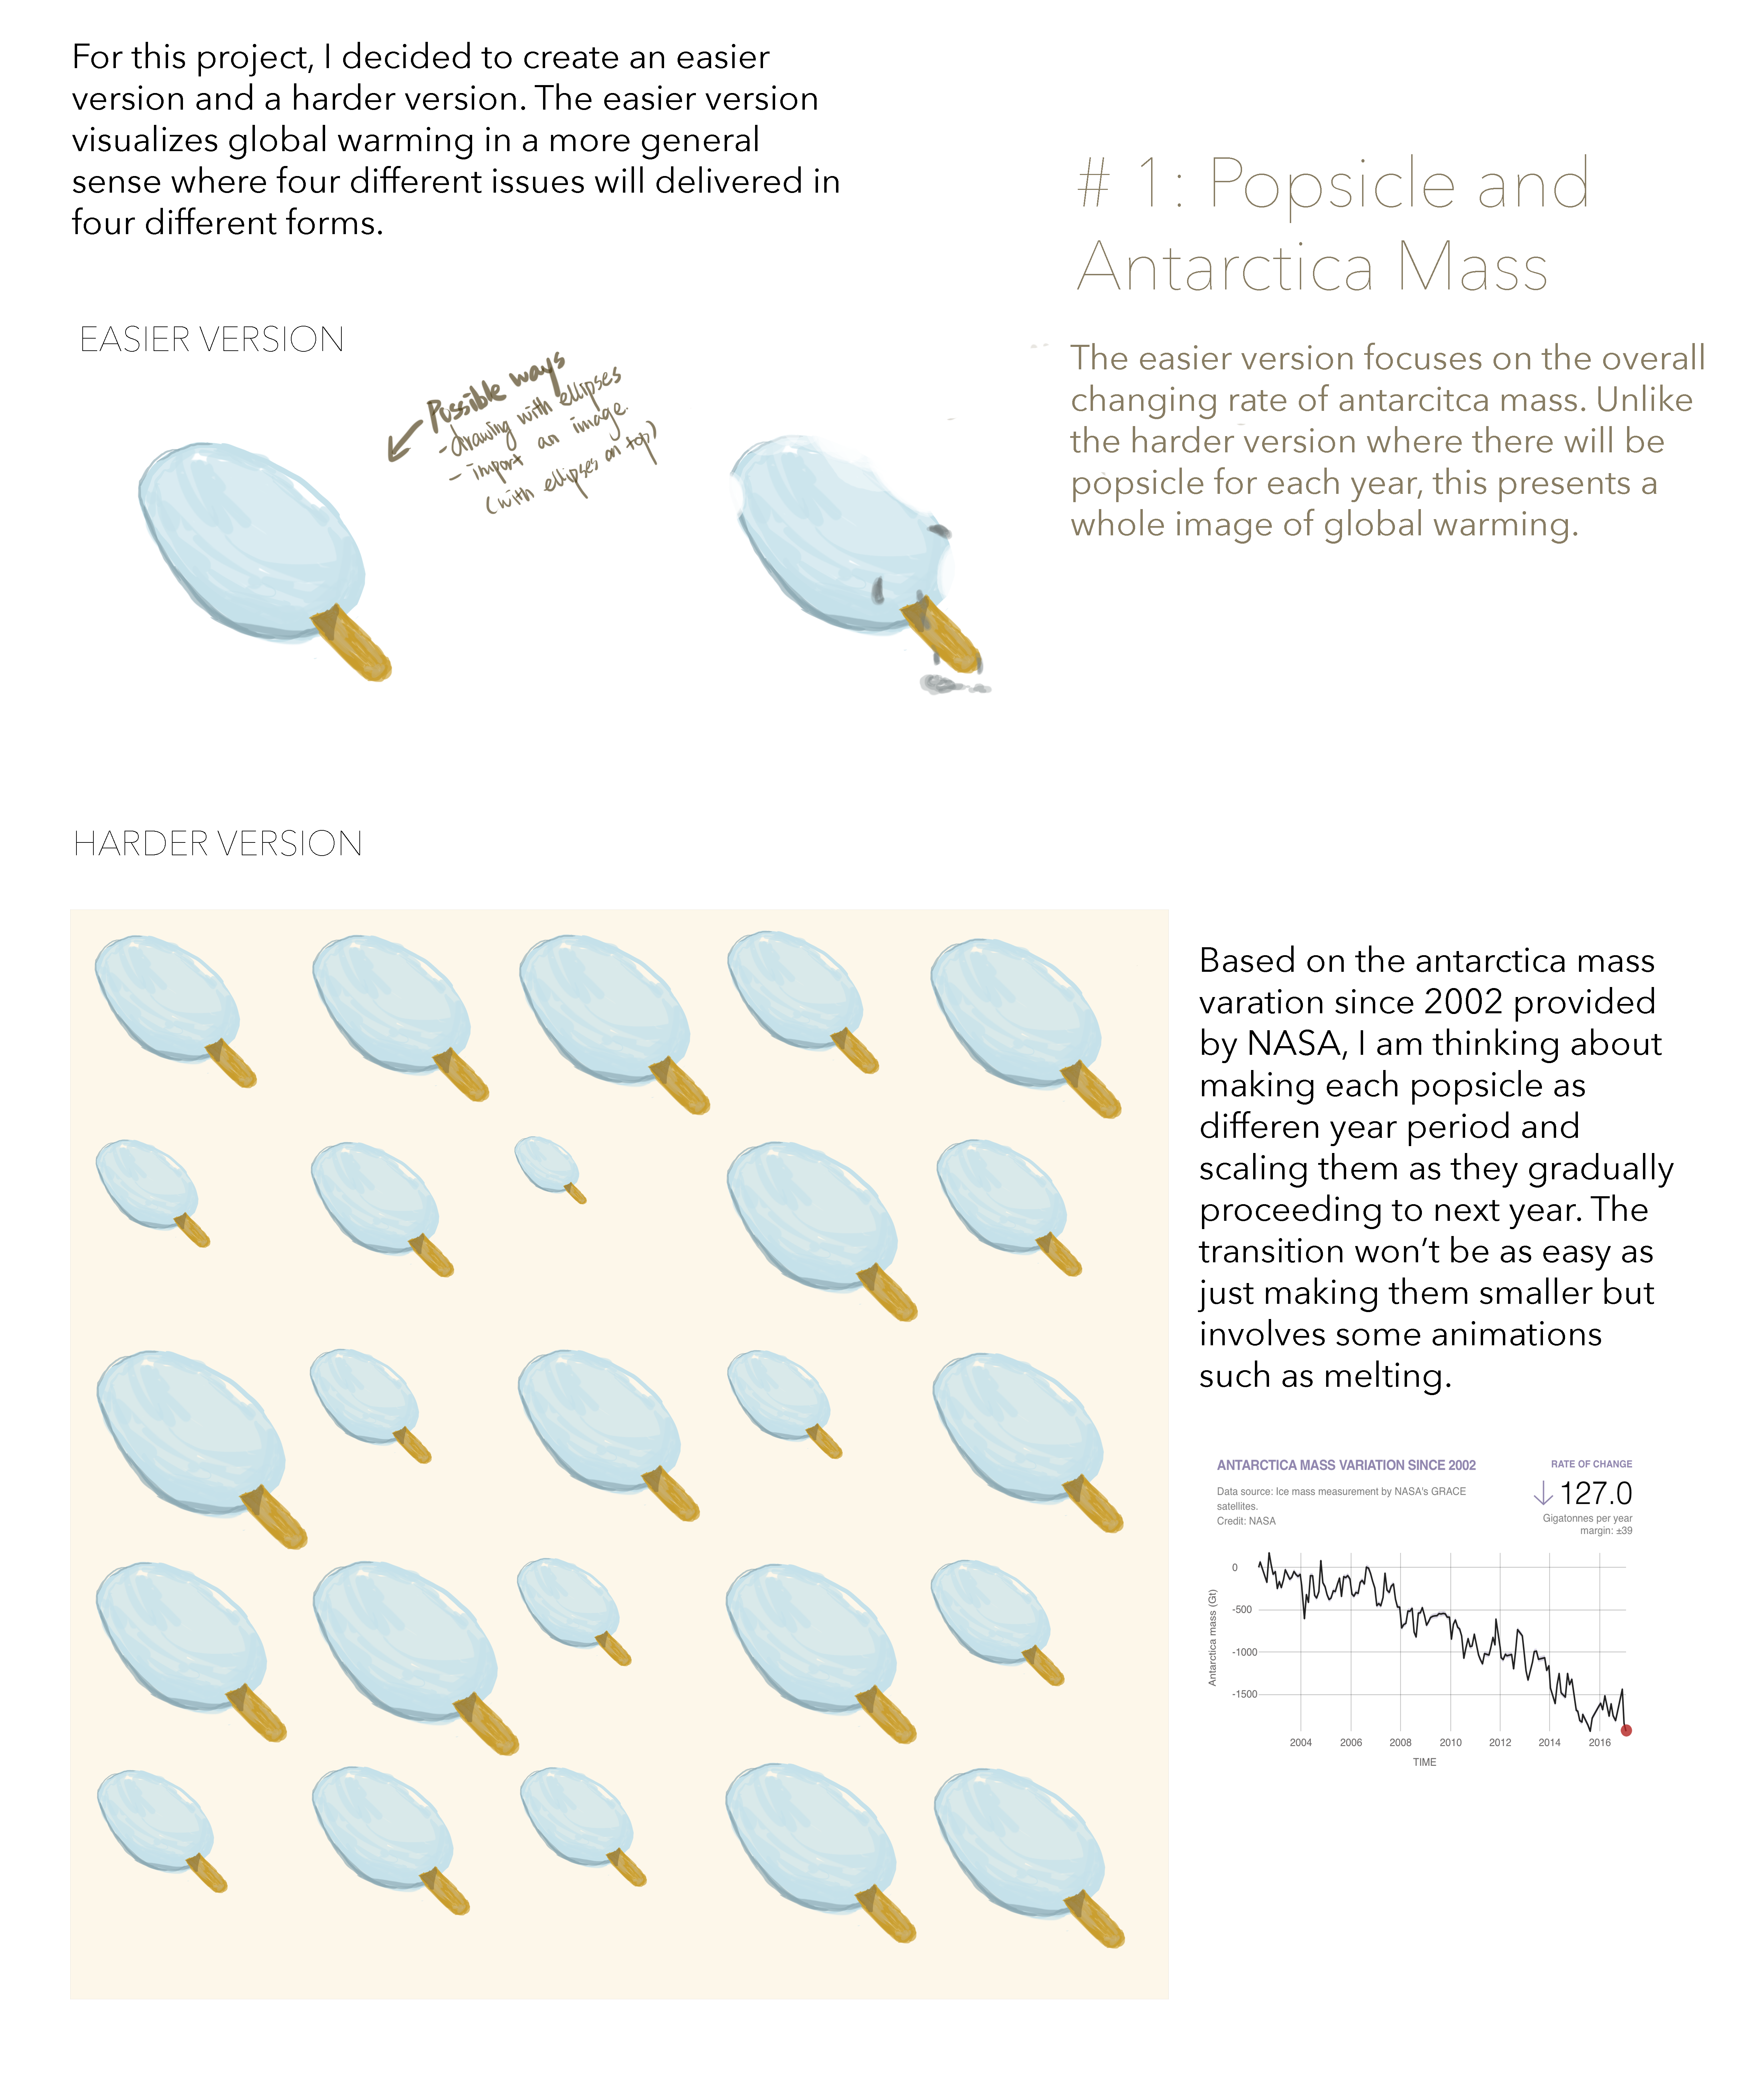
The first one conveys an easier version and a harder version as I haven’t experimented with my ideas and don’t know the achievability.
The second one deals more about the physic module we have learned in class. I will use elements like “gravity”, “damping”, “spring”, and etc.