ssharada-looking-outwards-07

Can Buyukberber is a visual artist working on immersive audiovisual experiences that’s embodied both in physical and digital spaces.

Unifield is a form experiment which attempts to explore H.S.M. Coxeter’s higher dimensional geometry studies. The work intends to trigger a timeless perception by merging both archaic and futuristic components. By using computational design techniques with a digital fabrication method and projection mapping, Unifield uses the space where digital and physical overlaps as a portal to visualization possibilities of a higher dimensional object.

It works as an ambiguous sculpture, animated with light and sound that has the qualities of this historical background and scientific studies. With this correlation, Unifield aims to transcend a single association of time, which rather is a holistic understanding.

ssharada-project-07-composition-with-curves

project04.js


function setup() {
    createCanvas(480, 480);
    angleMode(DEGREES);
    frameRate(50); //delayed feedback so lines appear to draw themselves and disappear
}

function draw() {

//making the colour of the background dependent on the cursor position
    background(mouseX/7.55, mouseY/20, mouseX/15, mouseY/20); 
    //the trasnparency of the backgroud is also dependent on the cursor position

//changing the position of the start point of the curves. 
    translate (width/3,height/2);
    noFill();

//creating the for loop variables for which the angles will change
    for (var i = 0; i < 361; i++){

        //maping the angles so they only go between 0 and 360 
        var t = map(i, 0, 360, 1, 500); 
        
        //making the colours only range 0 and 255 no matter cursor position
        var r = map(mouseX, 0, 1000, 250, 255); 
        var g = map(mouseX, 0, 1000, 120, 130);
        var b = map(mouseX, 0, 1000, 70, 80);

        //making the variables for the points' scaling
        var scale1 = 0.0005;  
        var scale2 = 0.5;
        var scale3 = 0.001;
        var scale4 = 0.4;

        //creating the curves of the graphs that the for loop is going to be used with
        var x1 = -sin(t)+cos(t);
        var y1 = cos(t);
        var x2 = cos(t) + 0.5;
        var y2 = sin(t);

        //creating the stroke colour and varying it according to the cursor position and the for loop
        stroke(r, g, t*(mouseX/800));
        strokeWeight(random(0.01, 0.05));

        line(x1*t*mouseX*scale1, y1*t*scale2, x2*t*scale2, y2*t*mouseY*scale1);
        line(x1*t*scale4, y2*t*mouseX*scale3, x2*t*mouseY*scale1, y2*t*scale4);

        push();
        //rotating the same two curves to create the rose like shape.
        rotate(90);
        
        line(x1*t*mouseX*scale1, y1*t*scale2, x2*t*scale2, y2*t*mouseY*scale1);
        line(x1*t*scale4, y2*t*mouseX*scale3, x2*t*mouseY*scale1, y2*t*scale4);
        
        pop();

    }
    
}


For this assignment I was inspired by a rose bud blooming and I was trying to figure out how to find an abstract way to represent it. I did this by changing the colours and have a frame rate that was slow enough for the lines to look like they were emerging from each other.

I experimented with cosine and sine curves and looked at what would happen if i multiplied, subtracted, added, and divided them from each other. I ended up with the above version because i felt that it represented the idea of the flower blooming the best.

ssharada-looking-outwards-06-randomness

This is the art work of Keith Peters. He is a coder and generative artist that does work in a variety of coding languages. His basic method to creating art is to use the coding software and play around with it until he gets something that looks nice. He has a whole website dedicated to his work called Art for Code.

From his work it is possible to see that there seems to be a lot of mathematics involved or the shapes that are formed look very organic and nature like which to my surprise is not uncommon in this field of generative art because a lot of the employed mathematical models are often those useful in scientific analysis and simulation.

ssharada-project-06-abstract-clock

project06-3.js

//shariwa sharada
//ssharada@andrew.cmu.edu
//project 06
//section a 


//creating global var to be used in varyingly in different functions
var diameter;
//array of points for x point of second ellipses - 60 variables for 60 seconds 
var placeX = [300,305,310,320,325,330,340,345,350,360,365,370,380,385,390,400,405,410,420,425,430,440,445,450,460,465,470,480,485,490,500,505,510,520,525,530,540,545,550,560,565,570,580,585,590,600,605,610,620,625,630,640,645,650,660,665,670,680,690,700]
//array of points for y point of second ellipses - 60 variables for 60 seconds 
var placeY = [300,305,310,320,325,330,340,345,350,360,365,370,380,385,390,400,405,410,420,425,430,440,445,450,460,465,470,480,485,490,500,505,510,520,525,530,540,545,550,560,565,570,580,585,590,600,605,610,620,625,630,640,645,650,660,665,670,680,690,700]
//array of points for x point of minute ellipses - 60 variables for 60 minutes 
var placeXMin = [50,60,75,85,100,110,125,135,150,160,175,185,200,210,225,235,250,260,275,285,300,310,325,335,350,360,375,385,400,410,425,435,450,460,475,485,500,510,525,550,575,600,625,650,675,700,725,750,775,800,825,850,875,900,925,950]
//array of points for y point of hour lines - 24 variables for 24 hours
var placeYHr = [50,75,121,150,176,200,253,300,350,375,450,473,500,550,600,675,699,737,775,803,825,869,900,925]


function setup(){
	createCanvas(500,500);	
}

function draw(){
	background(0);

	var hr = hour(); //hour variable 
	var mn = minute(); //minute variable 
	var sc = second();//second variable 

	//creating the ellipses for the seconds
	//this draws the same number of ellipses at the given second 
	//the ellipses position change with each second  
	push();
	for (var i = 0; i<sc; i++){ //for loop relative to the number of seconds 
		var diameter = random(20,180);
		frameRate(1);
		fill(random(214,254), random(92,132), random(131,171), random(0,70)); //adding transparencies to the fill 
		stroke(random(214,254), random(92,132), random(131,171), random(120,225));
		strokeWeight(random(0.5, 2.3));
		ellipseX = random(placeX); //making the index value chosen from the array random 
		ellipseY = random(placeY); //making the index value chosen from the array random 
		ellipse(ellipseX/2, ellipseY/2, diameter/2, diameter/2); //drawing the ellipses 
	}
	pop();

	//making the minutes ellipses 
	//the position of the ellipses in the y axis does not change 
	//this draws the same number of ellipses at the given minute.
	push();
	for (var j = 0; j<mn; j++){ //for loop relative to the number of minutes 
		stroke(random(215,255), random(174,214), random(5,45), random(70,100));//randomising stroke colours
		fill(255, 194, 25, 70);
		strokeWeight(random(0.1, 1.2));
		drawMin(placeXMin[j]/2); //making it relaitive to the x value of the ellipse and the for loop  
		//calling it from another functions that defines what to draw
	}
	pop();

	//making the hour lines/blobs
	//the position of these blobs does not change in the x direction 
	//this draws the same number of lines as the number of hours in a range of 1-24
	push();
	for (var k = 0; k<hr; k++){ //making the for loop relative to the hour 
		stroke(random(0,40), random(137,177), random(155,195));
		fill(20, 157, 175, 10);
		strokeWeight(random(5, 10));//making the lines blobs 
		drawHr(placeYHr[k]/2);//making it relative to hour variable, the for loop, y position array
	}
	pop();
}

//giving the parameters for the ellipses drawn for the minutes representation 
function drawMin(x){
	var diameter = random(10,50);
	ellipse(x, width/2, diameter/2, diameter/2);//only calling fro the x position to be changed. 
}

//giving the parameters for the lines drawn for the hours representation 
function drawHr(y){
	var diameter = random(30,70);
	line(height/2, y, height/2, y+5); //only calling the y value to be changed 
}


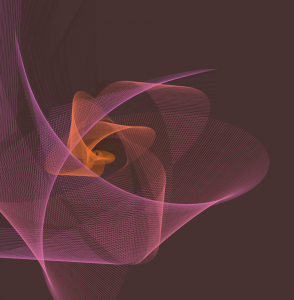
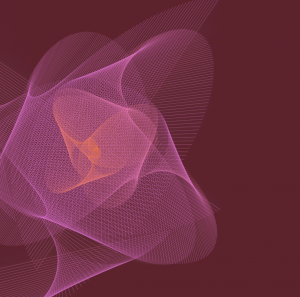
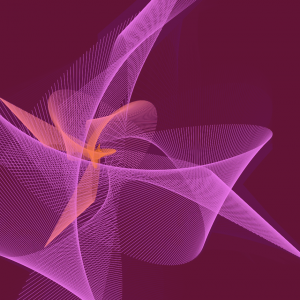
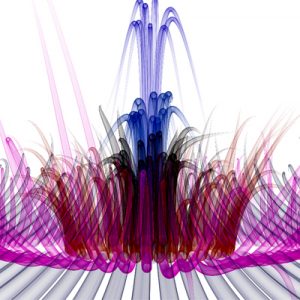
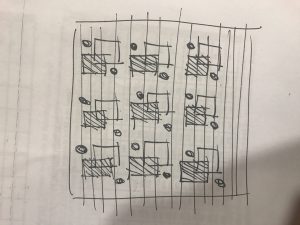
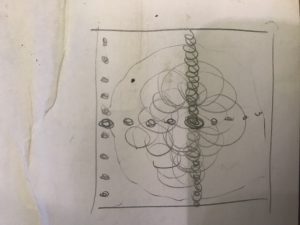
For this project I was inspired by the gear system that watches have. The way the ellipses interact represent the complexity of a traditional gear system.

Everything is relative to the second values which is why everything moves as the second changes but the objects are only added as the individual variable changes. This is similar to the idea that in a gear system, if even one part if off by the slightest bit, everything is affected.

The pink ellipses depict the seconds – the number of these ellipses show the number of seconds that have passed, and every second that goes by the placement of these ellipses randomises while adding another ellipse i.e.: a second.

The yellow ellipses represent the minutes with the number of minutes increasing from left to right as the number of minutes increase.

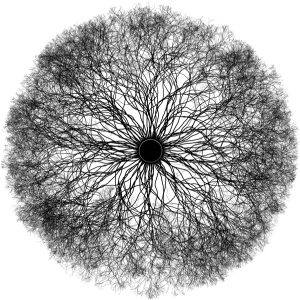
The central blobs represent the hours in a 24 hours clock with the number increasing from top to bottom as the number of hours increase.

ssharada-project-05

sketch-511.js

//Shariwa Sharada
//Section A
//ssharada@andrew.cmu.edu
//Project-05


function setup(){
	createCanvas(480,480); //background sizing 
	
} 

function draw(){

	background(255);
	
	for(var y = 4; y< height; y+=10){
		strokeWeight(2);
		stroke(255, 188, 0);
		line(0, y, width, y); //background horizontal lines
	}

	for (var a = 7.5; a<width; a+= 100){
		for (var b = 10; b<height; b+= 100){
			fill(0, 152, 255, 190); //using transparencies to show overlaps in shapes 
			noStroke();
			rect(a,b,50,50) //creating the blue coloured squares
		}
	}
	
	for (var s = 16.5; s<width; s+= 100){
		for (var t = 19; t<height; t+= 100){
			fill(255, 0, 0, 150 );
			noStroke();
			rect(s,t,50,50) //creating the red coloured squares
		}
	}

	for (var c = 50.5; c<width; c+= 100){
		for (var d = 1; d<height; d+= 100){
			fill(155, 4, 148, 120);
			noStroke();
			rect(c,d,25,25) //creating the smaller purple coloured squares
		}
	}

	for (var e = 14.5; e<width; e+= 100){
		for (var f = 66; f<height; f+= 100){
			fill(0, 255, 230, 120);
			noStroke();
			ellipse(e,f,25,25) //creating the larger cyan circles 
		}
	}

	for (var g = 20.5; g<width; g+= 100){
		for (var h = 86; h<height; h+= 100){
			fill(0, 255, 0, 120);
			noStroke();
			ellipse(g,h,10,10) //creating the smaller green circles 
		}
	}

	noLoop();
}

For this project I wanted to play with the overlapping of colours and shapes and lines to see what new objects were created. To do this I started off with the idea of the sketch you can see but decided to change some elements because the whole wallpaper ended up coming out to be too symmetrical. I played with the alpha levels of all the colours to allow the overlaps between the shapes to create new colours and additional spaces.

looking-outwards-05-ssharada

Absolut Amber from ZEITGUISED on Vimeo.

ZEITGUISED is a collective of international artists and designers working in the fields of sculpture, architecture, fashion and film. Almost impossible to categorise, the Berlin-based studio was founded by German architect Henrik Mauler and American sculpture and fashion designer Jamie Raap in 2001.

The founder was once stated saying “Synthetic poetry and lyrical systems are at the core of what drives our work. It is fair to say that often the music or soundscapes are the origin or pivot of our pieces”

On the outside their projects create a rhythmic, soft flowing fluid, and incredibly tranquillising aesthetic; but in reality are created using technology and synthetic non-physical matter – usually from coded algorithms.
So, when you believe you are seeing silk-like materials, or liquid, natural substances, you’re in fact witnessing pioneering motion graphics accentuated with sound or other stimulus.

ssharada-project-04-section-a-string-art

project04-1.js


//Shariwa Sharada
//Section-A
//ssharada@andrew.cmu.edu
//Project-04

var gap = 1; //spacing between lines 
var x1 = 0; //starting point x
var x2 = 200; //mid-point x
var x3 = 400 //endpoint x
var y1 = 150; //midpoint y 
var y2 = 0; //starting point y
var y3 = 300; //end point y 


function setup(){
	createCanvas(400,300);
	strokeWeight(1); //predetermining the stroke weights of everything 	
}

function draw(){
	background(255, 247, 213);

	gap = map(mouseY, 0, 300, 3, 10);//mapping the gap size so that it is proportionate no matter the placement of the mouse
	
	var g = 150; //changing the green value
	var b = 100; //changing the blue value
	var r = 50; //changing the red value

	
	for (var i= 0; i< width; i++){ 
		
		//creating the first pair of dark green to yellow curves 
		stroke(r,g,0);
		line (x1, gap*i, gap*i, y1);//creating lines based of the start and mid points
		line (x2, gap*i, gap*i, y2);
		g += i/20; //creating a gradation in the colour range in terms of the increment
		r += i/10;

		//creating the second pair of yellow to dark green curves 
		stroke(r,g,0);
		line (gap*i, height-y1, width-x1, gap*i); //creating lines based of the end and mid points
		line (gap*i, height-y2, width-x2, gap*i);
		g += i/2;//creating a gradation in the colour range in terms of the increment
		r += i/4;
	}

	//creating the third pair of green to blue curves 
	for (var j= 0; j< width; j++){
		stroke(0,g,b);
		line (x3, gap*j, gap*j, y1); //creating lines based of the end and mid points
		line (x1, gap*j, gap*j, y3);
		g += j/20; //creating a gradation in the colour range in terms of the increment
		b += j;


	}


}

The main aim of my work was to examine the difference between larger increments and smaller increments while trying to vanish some lines into the background and keeping focus on a few of them. I wanted to explore this idea because I found it fascinating how the lines when they come together form this dense intrinsic pattern of curves that you could never imagine that they could come from straight lines – but as you drag the mouse away, you realise what actually creates the lines and it makes you wonder about the complexity of everyday simple objects like curves

looking-outwards-04-ssharada-sound-art

Italian artist Loris Cecchini uses sound waves hitting water and creating ripples as the inspiration for his sculptural work – he focuses on creating something invisible, naked and visible in its true for to an unassuming viewer.

Each of Cecchini’s installation pieces freeze momentary natural forms on the wall, encased in polyester resin and white paint. The lack of motion and their monochromatic treatment leave each beautiful form open to interpretation and with an invitation to appreciate the patterns of the natural world.

And of course, none of this would have been possible without the correct use of technology, as Cecchini himself says:

“I’m very interested in the utopian dimension which bonds technology and nature. And I try to interpret a cultural landscape made of different “realities “, working on a diffused perception made of virtuality and consistent matter; in this sense I try to bridge. Naturally my work opens that to the wandering thoughts of the spectator.”

looking-outwards-03-ssharada-section a

As a response to how data can affect our built environments, Synthesis Design + Architecture teamed up with IBM Watson Analytics to design an interior feature wall for the Watson Experience Center in San Francisco. The project, named Data Moiré after the dizzying patterns created by overlapping sets of lines, uses data from the influence of mobile phones on monthly consumer spending to create a precise screen material that defines the wall.

The data-driven patterns on the surface of the wall are a result of parametric modeling based on Watson’s own data analysis, actively showing off the capabilities of the system itself. The generative design was CNC milled onto two sheets of aluminium, which creates an intricate screen of information that is lit from between the two layers.

ssharada_project_03_section-a

Project 3

//Shariwa Sharada
//Section-A
//ssharada@andrew.cmu.edu
//Assignment-03-A

var ssw = 135;
var ssh = 160;

function setup(){
    createCanvas (480, 360);
    rectMode(CENTER);
}

function draw(){
//changing the background depending on the position of the cursor    
    background(mouseX, mouseY, 191);
    push();
    //limiting the colour change to certain types - dependent on the mouse placement within a 4x3 grid
    //changing colours dependent on the x-axis placement
    if (mouseX>0 & mouseX < ssw){
        mouseX = 246    
    }
    if (mouseX>ssw && mouseX < ssw*2){
        mouseX = 236
    }
    if (mouseX>ssw*2 && mouseX < ssw*3){
        mouseX = 226
    }
    if (mouseX>ssw*2 && mouseX < width){
        mouseX = 216
    }
    //changing colours dependent on the y-axis placement
    if (mouseY>0 && mouseY < ssh){
        mouseX = 180
    }
    if (mouseY>ssh && mouseY < ssh*2){
        mouseX = 170
    }
    if (mouseY>ssh*2 && mouseY < height){
        mouseX = 160
    }
    pop();

    push();
//creating the translating and moving squares
    translate (width/2, height/2);
    //stating the number of squares i want within the first level - 
    //using the increment command to have the squares rotated with equal distances.
    for (var a = 0; a < 15; a++){
        push();
        //rotation and pasting
        rotate(TWO_PI * a / 15);
        //making the placement of the level dependent 
        //on the y-axis placement of the cursor
        var X = mouseY;
        translate(X, 0);
        //the colour of this rectangles and randomising the transparancy
        //of the white to make the quares appear to flicker
        fill(255, random(20,90));
        noStroke();
        //the size of the first level of rectangles.
        rect(0,0,60,60);
        //stating the number of squares i want within the second level - 
        //using the increment command to have the squares rotated with equal distances.
        for (var b = 0; b < 12; b++){
            push();
            //rotation and pasting
            rotate(TWO_PI * b/12);
            //making the placement of the level dependent 
            //on the x-axis placement of the cursor
            var Y = mouseX;
            //the size of the second level of rectangles.
            rect (Y,0,30,30);
            //the colour of this rectangles and randomising the 
            //transparancy of the white to make the quares appear to flicker
            fill(255, random(10,80));
            noStroke();
            //stating the number of squares i want within the third level - 
            //using the increment command to have the squares rotated with equal distances.
            for (var c = 0; c < 8; c++){
                push();
                //rotation and pasting
                rotate(TWO_PI* c/8);
                //making the placement of the level dependent 
                //on the y-axis placement of the cursor
                var Z = mouseY;
                //the size of the third level of rectangles.
                rect (0,Z,10,10);
                //the colour of this rectangles and randomising the 
                //transparancy of the white to make the quares appear to flicker
                fill(255, random(10,50));
                noStroke();
                //preventing the code from affecting other factors of the program
                pop();
            }

            //preventing the code from affecting other factors of the program
            pop();
            }

        //preventing the code from affecting other factors of the program
        pop();
    }
    pop();
}