abradbur – Project-07 – Curves

icantbelieveit’snotHS

function setup() {
    createCanvas(480, 480);
}

function draw() {
    background(56, 136, 249);
    stroke(66, 229, 253);
    strokeWeight(5);
    noFill();

    //shaky box
    rect(width/2 - random(118,120), height/2 - random(118,120),
    random(238,240), random(235,240));

    //draw the hypcocylcoids
    push();
    translate(width/2, height/2);
    drawHypocyclo();
    drawCyclo2();
    pop();

}

function drawHypocyclo(){ //hypocycloid
    var x;
    var y;
    //big radius
    var a = map(mouseX, 0, 480, 50 *.01 * mouseX, 25 * .01 * mouseX);
    //lil radius
    var b = map(mouseY, 0, 480, 1 * .01 * mouseY, 10 * .01 * mouseY);
    var r; //angle

    beginShape();
    stroke(255);
    strokeWeight(1);
    for (var r = 0; r < TWO_PI * 10; r += 0.01){
        x = (a - b) * cos(r) - b * cos(((a-b)/(b))* r);
        y = (a - b) * sin(r) + b * sin(((a-b)/(b))* r);
        vertex(x,y);
    }
    endShape();

}

function drawCyclo2(){
    var a = map(mouseX, 0, 480, 50 *.01 * mouseX, 80 * .01 * mouseX); 
    var b = map(mouseY, 0, 480, 10 * .01 * mouseY, 90 * .01 * mouseY); 
    
    beginShape();
    stroke(66, 229, 253);
    strokeWeight(3);
    for (var r = 0; r < TWO_PI * 50; r += 0.01){
        x = (a - b) * cos(r) - b * cos(((a-b)/(b))* r);
        y = (a - b) * sin(r) + b * sin(((a-b)/(b))* r);
        vertex(x,y);
    }
    endShape();
}


I had a surprising amount of fun with this project once I was able to figure out the math and which variables to apply to which mouse function. It was also a good opportunity for me to finally figure out how the map(); function works, which I really shouldn’t have saved for until now.

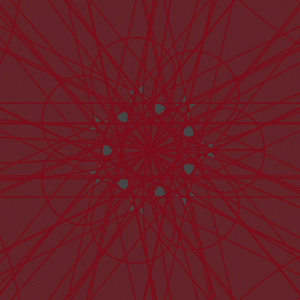
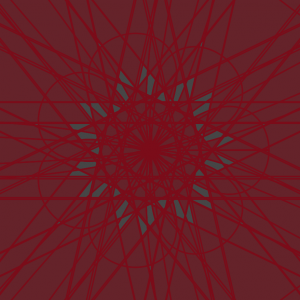
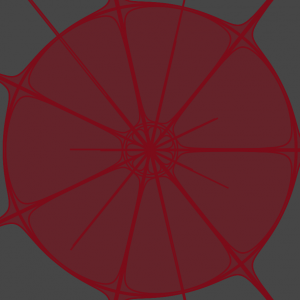
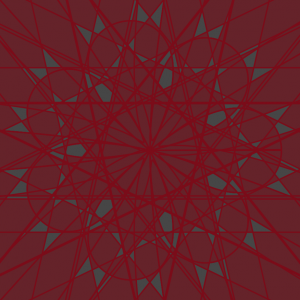
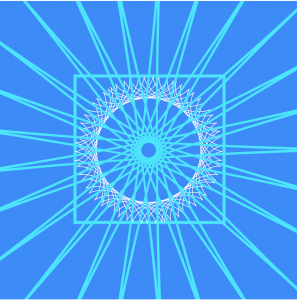
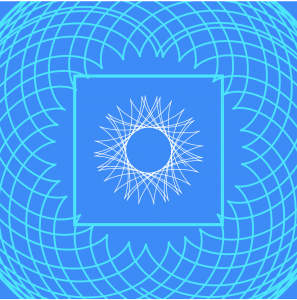
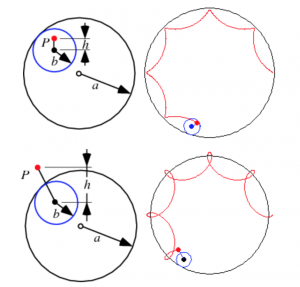
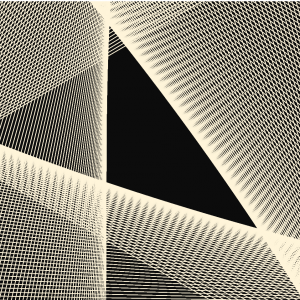
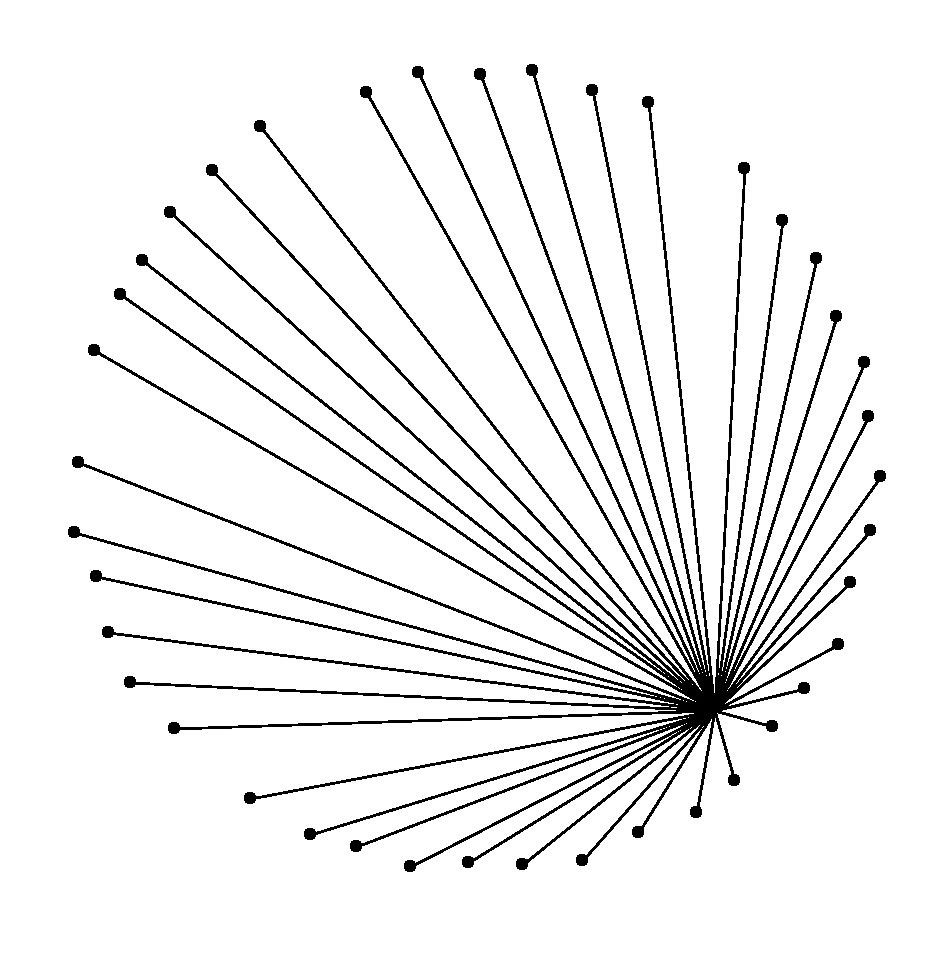
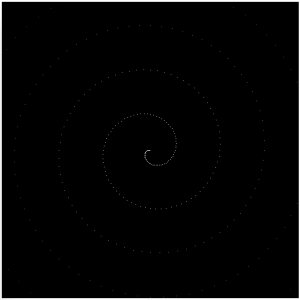
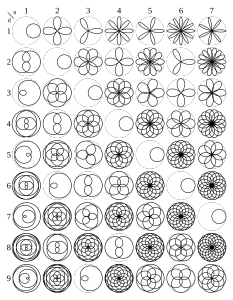
While I was playing around on the Mathworld website (wow) I found myself in love with the Hypocycloid and all the different patterns you could get out of it, so I drew two of them. I added the shaky box as a sort of center piece, and I like how it acts as a containment unit for the inner curve.

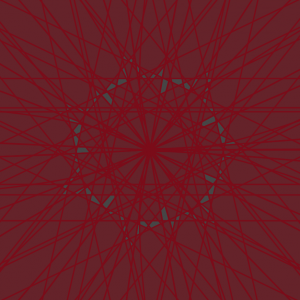
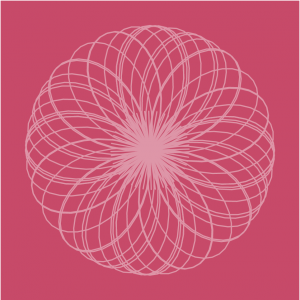
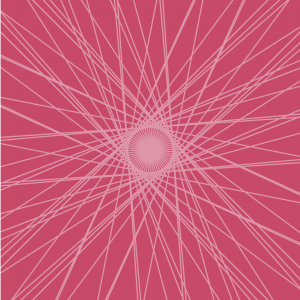
Here are a couple of states that I really enjoyed from my project.

Outward Explosion
Contained Star
Framed
Planet Box

agusman-Project07-Curves

sketch

//Anna Gusman
//agusman@andrew.cmu.edu
//Section E
//Project 07

var edges = 25;

function setup() {
  createCanvas(400, 400);
}

function draw() {
  background(10, 10); //use opacity to create lag illustion
  translate(width/2,height/2); //move "0,0" to center
  strokeWeight(0.2);
  noFill();
  drawHypotrochoid();
}

function drawHypotrochoid() {

    var x; //initialize x
    var y; //initialize y

    //set variables for hypotrochoid
    var a = 0;
    var h = map(mouseX, 0, width, 0, 480);
    var b = a/map(mouseY, 0, height, 0, 480);

    for (var i = 0; i < 20; i++){
        var x;
        var y;
        var a = map(mouseX,0,width,-200,200); //alpha
        var b = edges; //beta
        var h = map(mouseY,0,height,0,10*i);

        //changes the color gradient based on mouse position
        var red = map(i,0,50,0,255);
        var green = map(mouseX,0,width,0,255);
        var blue = map(mouseY,0,height,0,255);
        stroke(color(red,green,blue));
  }

    //draw hypotrochoid
    beginShape();
        for (var i = 0; i < 200; i++) {

            var angle = map(i, 0, 200, 0, TWO_PI);

            var x = (a - b) * cos(angle) + h * cos (((a - b)/b)*angle);
            var y = (a - b) * sin(angle) - h * sin (((a - b)/b)*angle);

            vertex(x, y);

        }

    endShape();
}

This project was culmination of happy accidents- I found that the best way to approach manipulating graphical elements of my algorithm was to experiment and play with combinations of values when mapping my mouse interactions. It was surprisingly helpful to use the mouse as a tool to explore the different geometric permutations and their relationships to one another. The experience weakened my fear of using strange and foreign numbers and letters (back from calc in high school) as a very liberating creative tool. I found that adding even the simplest and subtlest of effects (like redrawing the background with a lower opacity) resulted in really great visual manipulations. For my curve, I used a hypotrochoid because it’s roulette drawing sequence reminded me of the clock mechanism from my project 06.

Here are some screenshots of some permutations

dnam-project-07

sketch

/*
Doo Won Nam
Section B
dnam@andrew.cmu.edu
Project - 07
*/

function setup() {
createCanvas(400, 400);
ellipseMode(CENTER); //set center of ellipse to middle
stroke(255); //white lines
}

function draw() {
background(0); //black background, put it in draw so it resets while moving
var angle = 0; //set angle for ellipse and movement distance
var angle2 = 360 / mouseX; //set mouse interaction
for (var i = 0; i < 11 ;i ++) { //start loop, limit to 10 ellipses
angle = frameCount;
d = sin(radians(angle)) * 100;
var x = 200 + d * cos(radians(angle2*i + 200)); //set x to move/same x for both
var y = 200 + d * sin(radians(angle2*i + 10)); //set y to move/same y for both
  noFill(); //transparent ellipses
	ellipse(x, y, 100, 100); //small circle
	ellipse(x, y, 200, 200); //big circle
	}
}

While I had a hard time with the project due to my lack of knowledge in how cos and sin works due to not having taken math classes for a prolonged time, I used cos and sin to make the ellipses move in a cradle like fashion. The mouse interaction blooms the circles that are combined together. The location of the mouse alters the location and spread of the ellipses. This effect also alludes a display similar to those of springs.

Bettina-Project07-Curves-SectionC

sketch

// Bettina Chou
// yuchienc@andrew.cmu.edu
// Section C
// Project 07 Curves

bgCol = {"r": 200, "g": 180, "b": 180}; //background color
col = {"r": 200, "g": 220, "b": 220}; //color of dots and lines


function setup() {
    createCanvas(480,480);
}

function draw() {
    var nPoints = map(mouseX, 50, width, 1, 40, true); //varies the number of points 1 to 40
    var t = map(mouseY,0,height, 10, 400); //varies size of astroid
    var w = map(mouseY, 0, height, -100, 120); //moves center of lines left and right
    bgCol.r = map(mouseY,0,height,50,200);
    col.r = map(mouseY,0,height,50,200);
    background(bgCol.r, bgCol.g, bgCol.b);
    push();
    translate(240,235); //translate to center of canvas
    drawAstroidDots(nPoints, t, w);
    drawAstroidLines(nPoints, t, w);
    pop();
  
}

function drawAstroidDots(nPoints, t) {
    beginShape();
        for (var i = 0; i < nPoints; i++) {
            var x = t * cos(i)^3;
            var y = t * sin(i)^3;
            noStroke();
            fill(col.r, col.g, col.b);
            ellipse(x,y,5,5);
        }
    endShape();
}

function drawAstroidLines(nPoints, t, w) {
    beginShape();
        for (var i = 0; i < nPoints; i++) {
            var x = t * cos(i)^3;
            var y = t * sin(i)^3;
            if (nPoints > 1) {
                stroke(col.r, col.g, col.b);
                line(w,120,x,y); //draws lines from one center point to each dot
            }
        }
    endShape();
}

I approached this project without a visual concept as I was unfamiliar with the curves and unsure of mathematical capabilities. Instead, I found a curve that I liked, the astroid, and decided to get to know what each variable in the function does.

I soon learned of variables that affected size and number of points, and decided the astroid fit the concept of a “star burst” both in nomenclature and form.

I added interactivity with position, size, amount, and color. I was able to incorporate objects into adjust the color by adjusting the “red” variable in the RGB codes.

mmiller5-Project-07

sketch

function setup() {
    createCanvas(480, 480);
    frameRate(30);
    textAlign(CENTER);
    textSize(60);
}

function draw() {
    background(0);
    curves();
    smile();
}

function curves() {
    var cx = width / 2; //center of width
    var cy = height / 2; //center of height
    var t = 400; //iteration count
    var mx = map(min(mouseX, width), 0, width, 2, 5); //x position of mouse map
    var my = map(min(mouseY, height), 0, height, 2, 5); //y pos. of mouse mapped
    strokeWeight(1);
    for (i = 0; i < t; i ++) {
	var col = map(i, 0, t, 0, 255);
	//logarithmic spiral
	var x = (t - i) * cos(radians(i * mx));
	var y = (t - i) * sin(radians(i * my));
	fill(col);
	stroke(255 - col, 200);
	//make a quadrilateral with vertices at 4 spirals in the corners
	quad(x + width / 4, y + height / 4,
	     x + 3 * width / 4, y + height / 4,
	     x + 3 * width / 4, y + 3 * height / 4,
	     x + width / 4, y + 3 * height / 4);
    }
}

function smile() {
    var cx = width / 2; //center of width
    var cy = height / 2; //center of height
    var md = map(min(dist(mouseX, mouseY, cx, cy), 340), 0, 200, 15, -15);
    stroke(0);
    strokeWeight(3);
    noFill();
    //emoji like eyes, uses actual font, changes if mouse is in face
    if (mouseX > width / 4 & mouseX < 3 * width / 4 &&
       mouseY > height / 4 && mouseY < 3 * height / 4) {
	text("> <", cx, cy - 5);
    } else {
	text("| |", cx, cy - 5);
    }
    //smile, changes size with distance of mouse to center beacuse of var "md"
    arc(cx, cy + 30, 50 + (md / 3), 80 + md, 0, PI, CHORD);
}

Hee hee, this was fun.  I used a parametric form of a logarithmic spiral as the base of this program.  I then wanted to experiment with connecting points from different spirals together (in this case, I had 1 spiral in each corner).  I figured a good way to introduce mouseX and mouseY would be to have them affect the period of revolution (with mouseX affecting the x-position and mouseY affecting the y-position).  I thought the movement looked kinda like a snake, and since the center square was pretty barren, I decided to anthropomorphize the curve with a emoji-like smily face.


Initial logarithmic spiral (not really visible)

ssharada-project-07-composition-with-curves

project04.js


function setup() {
    createCanvas(480, 480);
    angleMode(DEGREES);
    frameRate(50); //delayed feedback so lines appear to draw themselves and disappear
}

function draw() {

//making the colour of the background dependent on the cursor position
    background(mouseX/7.55, mouseY/20, mouseX/15, mouseY/20); 
    //the trasnparency of the backgroud is also dependent on the cursor position

//changing the position of the start point of the curves. 
    translate (width/3,height/2);
    noFill();

//creating the for loop variables for which the angles will change
    for (var i = 0; i < 361; i++){

        //maping the angles so they only go between 0 and 360 
        var t = map(i, 0, 360, 1, 500); 
        
        //making the colours only range 0 and 255 no matter cursor position
        var r = map(mouseX, 0, 1000, 250, 255); 
        var g = map(mouseX, 0, 1000, 120, 130);
        var b = map(mouseX, 0, 1000, 70, 80);

        //making the variables for the points' scaling
        var scale1 = 0.0005;  
        var scale2 = 0.5;
        var scale3 = 0.001;
        var scale4 = 0.4;

        //creating the curves of the graphs that the for loop is going to be used with
        var x1 = -sin(t)+cos(t);
        var y1 = cos(t);
        var x2 = cos(t) + 0.5;
        var y2 = sin(t);

        //creating the stroke colour and varying it according to the cursor position and the for loop
        stroke(r, g, t*(mouseX/800));
        strokeWeight(random(0.01, 0.05));

        line(x1*t*mouseX*scale1, y1*t*scale2, x2*t*scale2, y2*t*mouseY*scale1);
        line(x1*t*scale4, y2*t*mouseX*scale3, x2*t*mouseY*scale1, y2*t*scale4);

        push();
        //rotating the same two curves to create the rose like shape.
        rotate(90);
        
        line(x1*t*mouseX*scale1, y1*t*scale2, x2*t*scale2, y2*t*mouseY*scale1);
        line(x1*t*scale4, y2*t*mouseX*scale3, x2*t*mouseY*scale1, y2*t*scale4);
        
        pop();

    }
    
}


For this assignment I was inspired by a rose bud blooming and I was trying to figure out how to find an abstract way to represent it. I did this by changing the colours and have a frame rate that was slow enough for the lines to look like they were emerging from each other.

I experimented with cosine and sine curves and looked at what would happen if i multiplied, subtracted, added, and divided them from each other. I ended up with the above version because i felt that it represented the idea of the flower blooming the best.

nahyunk1 -Project 07 – curves

sketch

//NaHyunKim
//section B
//nahyunk1@andrew.cmu.edu
//Project 07

var numObjects = 500;
var r = 255;
var g = 255;
var b = 255;

function setup() {
createCanvas(380, 380);
ellipseMode(CENTER);
}

function draw() {
var centerX = width/2;
var centerY = height/2;
background(0);
translate(centerX, centerY);
//draw Epicycloid
drawEpi(); //

function drawEpi() {
  noFill();
  stroke(random(0,r), random(0,g), random(0,b)); // stroke is all random colors

  beginShape();
  var x;
  var y;
  var a = mouseY/3; //the increase and the decrease of lines/curves.
  var b = -mouseX/40;//the increase and the decrease of lines/curves.
  for (var i=0; i < numObjects; i++){
    var t = map(i, 0, numObjects, 0, TWO_PI);
    var x = ((a+b)*cos(t) - b*cos(((a+b)/b*t))); // x eq. for the epicycloid
    var y = ((a+b)*sin(t) - b*sin(((a+b)/b*t))); // y eq. for the epicycloid
    vertex(x,y); // starts at the vertex.
  }
  endShape();
}
  beginShape();
  var x;
  var y;
  var a = mouseY/3;//the increase and the decrease of lines/curves.
  var b = mouseX/40;//the increase and the decrease of lines/curves.
  stroke(random(0,g), random(0,r), random(0,b)); //switch up the variables so that each epi. has different types of randomness.
  for (var i=0; i < numObjects; i++){
    var t = map(i, 0, numObjects, 0, TWO_PI);
    var x = ((a+b)*cos(t) - b*cos(((a+b)/b*t))); // x eq. for the epicycloid
    var y = ((a+b)*sin(t) - b*sin(((a+b)/b*t)));// y eq. for the epicycloid
    vertex(x,y);
  }
  endShape();
  beginShape();
  var x;
  var y;
  var a = mouseY/3;//the increase and the decrease of lines/curves.
  var b = mouseX/40;//the increase and the decrease of lines/curves.
  stroke(random(0,b), random(0,g), random(0,r));//switch up the variables so that each epi. has different types of randomness.
  for (var i=0; i < numObjects; i++){
    var t = map(i, 0, numObjects, 0, TWO_PI);
    var x = ((a+b)*cos(t*2) - b*cos(((a+b)/b*t))); // x eq. for the epicycloid
    var y = ((a+b)*sin(t*2) - b*sin(((a+b)/b*t)));// y eq. for the epicycloid
    vertex(x,y);
  }
  endShape();
  beginShape();
  var x;
  var y;
  var a = mouseY/3;//the increase and the decrease of lines/curves.
  var b = mouseX/40;//the increase and the decrease of lines/curves.
  stroke(random(0,b), random(0,g), random(0,r));//switch up the variables so that each epi. has different types of randomness.
  for (var i=0; i < numObjects; i++){
    var t = map(i, 0, numObjects, 0, TWO_PI);
    var x = ((a+b)*cos(t/2) - b*cos(((a+b)/(b/2)*t))); // x eq. for the epicycloid
    var y = ((a+b)*sin(t/2) - b*sin(((a+b)/(b/2)*t)));// y eq. for the epicycloid
    vertex(x,y);
  }
  endShape();
}

I first played around with the epicycloid itself to see how it gets formed as I move around the mouse. Then, I tried adding more layers of the same epicycloid and change around the equation to see changes occur in the image. I worked with division and multiplication of the variable ‘t’ in order to create shapes that differ from the original epicycloid made with the initial equation. Here are the screenshots of the initial, single epicycloid and my progressional adaptation of the shape through adding the altered versions of the original.

gyueunp – Project-07: Composition with Curves

Composition with Curves

//GyuEun Park
//15-104 E
//gyueunp@andrew.cmu.edu
//Project-07

//define rose curves by r = cos kθ 
var k = 7/4;

function setup() {
    createCanvas(440, 440);
    frameRate(1000);
}

function draw() {
	background(70);
	
	//change the origin to the center of canvas
	translate(width/2, height/2);

	beginShape();

	stroke(124, 9, 21);
	fill(124, 9, 21, 150);
	strokeWeight(2);
	
	for (var a = 0; a < TWO_PI * 8; a += 0.01){
		var r = map(mouseX, 0, (70 * cos(k * a)), mouseY, (200 * cos(k * a)));
		var x = r * cos(a);
		var y = r * sin(a);
		vertex(x,y);
	}

	for (var b = 0; b < TWO_PI * 4; b += 0.01){
		var r2 = map(mouseX, 0, (40 * cos(k * b)), mouseY, (20 * cos(k * b)));
		var x2 = r2 * cos(b);
		var y2 = r2 * sin(b);
		vertex(x2,y2);
	}

	endShape(CLOSE);
}

I used a rhodonea/rose curve to create a composition that bears a resemblance to a petalled flower. As seen in the code, I used one of the curves defined by , with the value 7 as the numerator and 4 as the denominator in defining k as n/d.

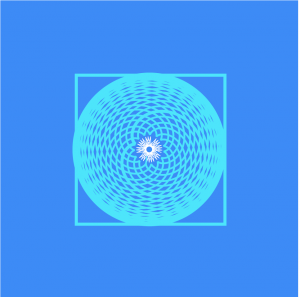
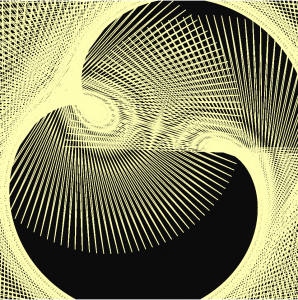
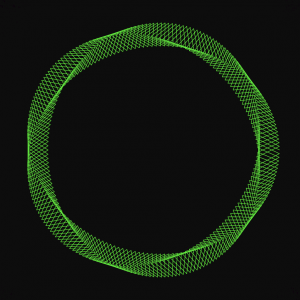
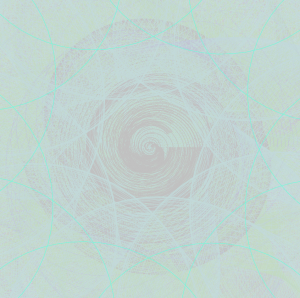
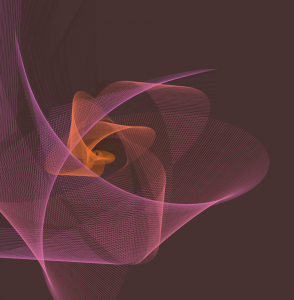
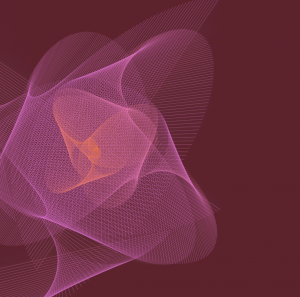
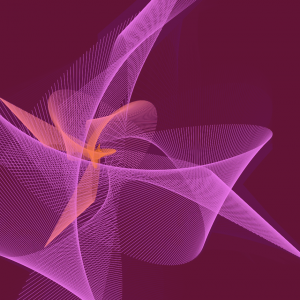
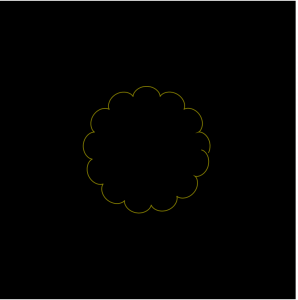
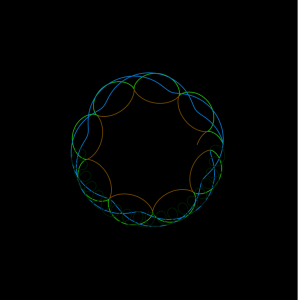
However, the addition of the interactive quality using mouseX and mouseY led to forms that are more fascinating and intricate than the stagnant rose. I’m glad that the project requirement pushed me to enable a broader range of possible compositions.

Screenshots :

amui1 – Project-07-Curves

amui1-p7

//Allison Mui
//15-104 Section A
//amui1@andrew.cmu.edu
//Project-07


//global variables
var nPoints = 100;

function setup() {
    createCanvas(480,480);
}

function draw() {
    background(0,0,63);
    //places bottom left corner
    drawAstroid(70,height-80);
    //places top right corner
    drawAstroid(width-60,80);
    drawRose();
}

function drawAstroid(xPos,yPos) {

    //size
    var a = 30;

    beginShape();
    noFill();


    stroke(255,242,254);
    strokeWeight(1);

    //loops ten times to make layer of astroid
    for (var num = 0; num < 10; num += 1) {
      //test loop
      //print(num);
      //loops through 100 times to make the curve
      for (var i = 0; i < nPoints; i++) {
        //constrains and maps theta to be between 0 and two pi
        var theta = map(i, 0, nPoints, 0, TWO_PI);

        //formulas provided by MathWorld
        x = xPos + a*(cos(theta)**3);
        y = yPos + a*(sin(theta)**3);


        vertex(x,y);

      }
      endShape();
      //decreases size of astroid in accordance with mouseX
      a = a - constrain(mouseX,0,width);
    }
}

function drawRose() {
    stroke(255,252,201);
    noFill();
    //size of rose inm accordance with mouseX
    var roseA = constrain(mouseX,50,200);
    //number of petals
    var roseFactor = 6;

    //loop through 10 times for extra layers
    for (var roseNum = 0 ; roseNum < 10; roseNum += 1) {
      for (var i = 0; i < nPoints; i++) {
        //constrains theta to be between 0 and two pi
        var roseTheta = map(i,0,nPoints,0,TWO_PI);

        //formulas from mathworld
        r = roseA*sin(roseFactor*roseTheta);

        roseX = width/2 + r*cos(roseTheta);
        roseY = height/2 + r*sin(roseTheta);

        ellipse(roseX,roseY,1,1);
      }
      //decreases size of rose in accordance with mouseX
      roseFactor = roseFactor - mouseX;
      //to test
      // print(roseFactor);
    }
}

This project was pretty challenging. I found mathWorld extremely useful in showcasing the x and y equations in order to make the shape. However, I found it difficult to come up with a creative idea that implemented the curve shape. What I came up with was inspired by the stars. Overall, I’m satisfied with my end product. However, in the future, I would like to explore more and maybe implement something new using the time function. Another thing that I wish I could have taken more time researching was finding a way to make the astroid curve into a rose curve over the movement of mouseX. But, that was too hard and too much of a time constraint for the time being. Overall, I’m satisfied with my end product which gives off a “sparkly” feel.

ifv-Project-07

sketch

//Isabelle Vincent
//Section E
//ifv@andrew.cmu.edu
//Assignment ifv-07-Project
var y;
var x;
var a;
var t;
var nPoints = 100;
function setup() {
  createCanvas(480,480);
}
function draw(){
  background(199, 74, 105);
  strokeWeight(2);
  translate(width / 2, height / 2);
  //center ray circle
  for(var l = 0; l <60; l++){
    drawRay(l)
  }
  //rotate and overlap looping arc
  for(var i = 0; i < 20; i+=1.5){
    stroke(222, 150, 168);

    if(i==0){
      push();
      drawCurve();
      pop();
    } else {
      push();
      rotate(PI/i);
      drawCurve();
      pop();
    }
  }
}
//drawing ray circ function
function drawRay(count) {
  push();
  rotate(radians(count*6));
  var H = hour();
  var rayH = map(H,0,0,140);
  line(0,0,(width/10),mouseY/4);
  pop();
}
//looping arc func
function drawCurve(){
  var x;
   var y;
   push();

   var a = 80.0;
   var b = a / 2.0;
   var h = constrain(mouseY / 2, 0, height);
   var ph = mouseX / 230;

   noFill();
   beginShape();
   for (var i = 0; i < nPoints; i++) {
       var t = map(i, 0, nPoints, 0, TWO_PI);
       x	=	(b*cos(t))/ph+b*cos(3*t)/(ph)
       y	=	(b*sin(t))/ph-b*sin(3*t)/(ph)
       vertex(x, y);
   }
   endShape(CLOSE);
}

I wanted to make a design that blended curved lines and straight lines. The mouse’s X and Y position affect the shape and size of the curved forms and the length and position of the lines in the cluster.